• Trade
  • Markets
  • Copy
  • Contests
  • 24/7
  • Calendar
  • Q&A
  • Chats
Screeners
SYMBOL
LAST
BID
ASK
HIGH
LOW
NET CHG.
%CHG.
SPREAD
SOURCE
SPX
S&P 500 Index
7688.62
7688.62
7688.62
7715.57
7635.81
+119.70
+ 1.58%
--
--
DJI
Dow Jones Industrial Average
53356.12
53356.12
53356.12
53492.40
52410.23
+1569.40
+ 3.03%
--
--
IXIC
NASDAQ Composite Index
25736.52
25736.52
25736.52
26048.83
25602.14
+364.52
+ 1.44%
--
--
USDX
US Dollar Index
101.140
101.140
101.220
101.223
101.087
-0.205
-0.20%
--
--
EURUSD
Euro / US Dollar
1.12537
1.12537
1.12545
1.12579
1.12217
+0.00262
+ 0.23%
--
--
GBPUSD
Pound Sterling / US Dollar
1.34878
1.34878
1.34891
1.34916
1.34621
+0.00171
+ 0.13%
--
--
XAUUSD
Gold / US Dollar
4130.28
4130.28
4130.73
4138.00
4057.55
+69.43
+ 1.71%
--
--
WTI
Light Sweet Crude Oil
86.411
86.411
86.446
87.736
86.164
-0.953
-1.09%
--
--

Community Accounts

Signal Accounts
--
Profit Accounts
--
Loss Accounts
--
View More

Become a signal provider

Sell trading signals to earn additional income

View More

Guide to Copy Trading

Get started with ease and confidence

View More

Signal Accounts for Members

All Signal Accounts

Best Return
  • Best Return
  • Best P/L
  • Best MDD
Past 1W
  • Past 1W
  • Past 1M
  • Past 1Y

All Contests

  • All
  • Recommend
  • Stocks
  • Cryptocurrencies
  • Central Banks
  • Trump Updates
  • Featured News
Top News Only
Share

The Main Contract For Bottled Chip Chips Hit The Daily Limit Down, Falling 6.02% To 7,676 Yuan/ton

Share

The Most Active Palladium Futures Contract Rose 8% Intraday, Currently Trading At 242.25 Yuan

Share

Palladium Futures Rose 2% On The Day, Currently Trading At $1,023.46 Per Ounce

Share

The Indonesian Rupiah Rose To 18,060 Against The US Dollar

Share

South Korean Foreign Minister Cho Hyun: We Are Prepared For All Possibilities Regarding Revisions To The ROK-US Nuclear Agreement

Share

Fluor: Signed A Memorandum Of Understanding With Inelectra To Support Customers In Venezuela's Energy, Petrochemical, And Industrial Sectors

Share

The South Korean Prime Minister Stated That He Does Not Expect Any Major Changes In South Korea-US Relations After The Midterm Elections

Share

The Taiwan Dollar Fell 0.4% Against The US Dollar To 32.954

Share

Spot Silver Broke Through $53/ounce, Up 1.59% On The Day

Share

New York Silver Futures Broke Through $53 Per Ounce, Up 1.37% On The Day

Share

The Main Contract For Low-sulfur Fuel Oil (LU) Plunged 12.00% Intraday, Currently Trading At 4790.00 Yuan/ton

Share

The Main Polysilicon Futures Contract Rose 4% Intraday, Currently Trading At 35,515.00 Yuan

Share

The Shanghai Crude Oil Futures Contract Fell 10% Intraday, Currently Trading At 608.50 Yuan

Share

The Most Active Gold Futures Contract Rose 4% Intraday, Currently Trading At 886.92 Yuan

Share

New York Gold Futures Broke Through $4,130 Per Ounce, Up 1.40% On The Day

Share

The Most Active Palm Oil Futures Contract Fell 2.00% During The Day, Currently Trading At 8826.00 Yuan/ton

Share

American Bitcoin's Q3 Net Profit Approximately $126 Million

Share

Both WTI And Brent Crude Oil Prices Fell By More Than 1% During The Day, Currently Trading At $87.04 Per Barrel And $92.87 Per Barrel, Respectively

Share

On The Afternoon Of November 4, Ling Ji, Vice Minister Of Commerce And Deputy Representative Of The People's Republic Of China For International Trade Negotiations, Held Talks With Redonne, Deputy Director-General Of The European Commission's Directorate-General For Trade And Economic Security

Share

Brent Crude Oil Fell 1% On The Day, Currently Trading At $93.64 Per Barrel

TIME
ACT
FCST
PREV
IMPACT
Euro Zone Core CPI Prelim MoM (Oct)

A:--

F: --

P: --

EURUSD
  • EURUSD
  • XAUUSD
  • XAGUSD
  • WTI
  • USDX
Euro Zone HICP Prelim YoY (Oct)

A:--

F: --

P: --

EURUSD
  • EURUSD
  • XAUUSD
  • XAGUSD
  • WTI
  • USDX
U.S. MBA Mortgage Application Activity Index WoW

A:--

F: --

P: --

USDX
  • USDX
  • XAUUSD
  • XAGUSD
  • WTI
U.S. ADP Employment (Oct)

A:--

F: --

P: --
XAUUSD
  • XAUUSD
  • XAGUSD
  • WTI
  • USDX
ECB Chief Economist Lane Speaks
Canada Exports (SA) (Sept)

A:--

F: --

P: --
USDCAD
  • USDCAD
  • XAUUSD
  • XAGUSD
  • WTI
  • USDX
Canada Imports (SA) (Sept)

A:--

F: --

P: --
USDCAD
  • USDCAD
  • XAUUSD
  • XAGUSD
  • WTI
  • USDX
U.S. Exports (Sept)

A:--

F: --

P: --

USDX
  • USDX
  • XAUUSD
  • XAGUSD
  • WTI
Canada Trade Balance (SA) (Sept)

A:--

F: --

P: --
WTI
  • WTI
  • XAUUSD
  • XAGUSD
  • USDX
U.S. Trade Balance (Sept)

A:--

F: --

P: --
USDX
  • USDX
  • XAUUSD
  • XAGUSD
  • WTI
The U.S. Treasury Department released its quarterly refinancing announcement.
U.S. IHS Markit Services PMI Final (Oct)

A:--

F: --

P: --

USDX
  • USDX
  • XAUUSD
  • XAGUSD
  • WTI
U.S. IHS Markit Composite PMI Final (Oct)

A:--

F: --

P: --

USDX
  • USDX
  • XAUUSD
  • XAGUSD
  • WTI
U.S. ISM Non-Manufacturing New Orders Index (Oct)

A:--

F: --

P: --

USDX
  • USDX
  • XAUUSD
  • XAGUSD
  • WTI
U.S. ISM Non-Manufacturing Inventories Index (Oct)

A:--

F: --

P: --

USDX
  • USDX
  • XAUUSD
  • XAGUSD
  • WTI
U.S. ISM Non-Manufacturing Price Index (Oct)

A:--

F: --

P: --

USDX
  • USDX
  • XAUUSD
  • XAGUSD
  • WTI
U.S. ISM Non-Manufacturing PMI (Oct)

A:--

F: --

P: --

USDX
  • USDX
  • XAUUSD
  • XAGUSD
  • WTI
U.S. ISM Non-Manufacturing Employment Index (Oct)

A:--

F: --

P: --

USDX
  • USDX
  • XAUUSD
  • XAGUSD
  • WTI
U.S. EIA Weekly Gasoline Stocks Change

A:--

F: --

P: --

WTI
  • WTI
  • XAUUSD
  • XAGUSD
  • USDX
U.S. EIA Weekly Crude Stocks Change

A:--

F: --

P: --

WTI
  • WTI
  • XAUUSD
  • XAGUSD
  • USDX
U.S. EIA Weekly Cushing, Oklahoma Crude Oil Stocks Change

A:--

F: --

P: --

WTI
  • WTI
  • XAUUSD
  • XAGUSD
  • USDX
U.S. EIA Weekly Crude Demand Projected by Production

A:--

F: --

P: --

WTI
  • WTI
  • XAUUSD
  • XAGUSD
  • USDX
U.S. EIA Weekly Crude Oil Imports Changes

A:--

F: --

P: --

WTI
  • WTI
  • XAUUSD
  • XAGUSD
  • USDX
U.S. EIA Weekly Heating Oil Stock Changes

A:--

F: --

P: --

WTI
  • WTI
  • XAUUSD
  • XAGUSD
  • USDX
Brazil CAGED Net Payroll Jobs (Sept)

A:--

F: --

P: --

XAUUSD
  • XAUUSD
  • XAGUSD
  • WTI
  • USDX
Brazil Selic Interest Rate

A:--

F: --

P: --

XAUUSD
  • XAUUSD
  • XAGUSD
  • WTI
  • USDX
Japan IHS Markit Composite PMI (Oct)

A:--

F: --

P: --

USDJPY
  • USDJPY
  • XAUUSD
  • XAGUSD
  • WTI
Japan IHS Markit Services PMI (Oct)

A:--

F: --

P: --

USDJPY
  • USDJPY
  • XAUUSD
  • XAGUSD
  • WTI
Australia Trade Balance (SA) (Sept)

A:--

F: --

P: --
AUDUSD
  • AUDUSD
  • XAUUSD
  • XAGUSD
  • WTI
  • USDX
Australia Exports MoM (SA) (Sept)

A:--

F: --

P: --
AUDUSD
  • AUDUSD
  • XAUUSD
  • XAGUSD
  • WTI
Japan 10-Year Note Auction Yield

--

F: --

P: --

Indonesia GDP YoY (Q3)

--

F: --

P: --

Russia IHS Markit Services PMI (Oct)

--

F: --

P: --

South Africa IHS Markit Composite PMI (SA) (Oct)

--

F: --

P: --

France Industrial Output MoM (SA) (Sept)

--

F: --

P: --

Germany Construction PMI (SA) (Oct)

--

F: --

P: --

Italy Retail Sales MoM (SA) (Sept)

--

F: --

P: --

U.K. Markit/CIPS Construction PMI (Oct)

--

F: --

P: --

Euro Zone PPI YoY (Sept)

--

F: --

P: --

Euro Zone PPI MoM (Sept)

--

F: --

P: --

France 10-Year OAT Auction Avg. Yield

--

F: --

P: --

U.S. Challenger Job Cuts YoY (Oct)

--

F: --

P: --

U.S. Challenger Job Cuts (Oct)

--

F: --

P: --

U.S. Challenger Job Cuts MoM (Oct)

--

F: --

P: --

Mexico Consumer Confidence Index (Oct)

--

F: --

P: --

U.K. BOE MPC Vote Unchanged

--

F: --

P: --

U.K. BOE MPC Vote Hike

--

F: --

P: --

U.K. Benchmark Interest Rate

--

F: --

P: --

U.K. BOE MPC Vote Cut

--

F: --

P: --

MPC Rate Statement
Bank of England Governor Bailey held a press conference on monetary policy.
Brazil IHS Markit Services PMI (Oct)

--

F: --

P: --

Brazil IHS Markit Composite PMI (Oct)

--

F: --

P: --

U.S. Weekly Initial Jobless Claims (SA)

--

F: --

P: --

U.S. Weekly Continued Jobless Claims (SA)

--

F: --

P: --

U.S. Initial Jobless Claims 4-Week Avg. (SA)

--

F: --

P: --

FOMC Member Hammack Speaks
Richmond Federal Reserve President Barkin delivered a speech.
ECB President Lagarde Speaks
U.S. EIA Weekly Natural Gas Stocks Change

--

F: --

P: --

Bank of Canada Governor Macklem and Senior Deputy Governor Rogers testified before a Senate committee.
Q&A with Experts
    • All
    • Chatrooms
    • Groups
    • Friends
    EuroTrader flag
    Matthew
    @EuroTraderi want republican so that they can support trump
    @Matthewbit despite Trump losing the house he still has veto power over the Congress
    EuroTrader flag
    EuroTrader
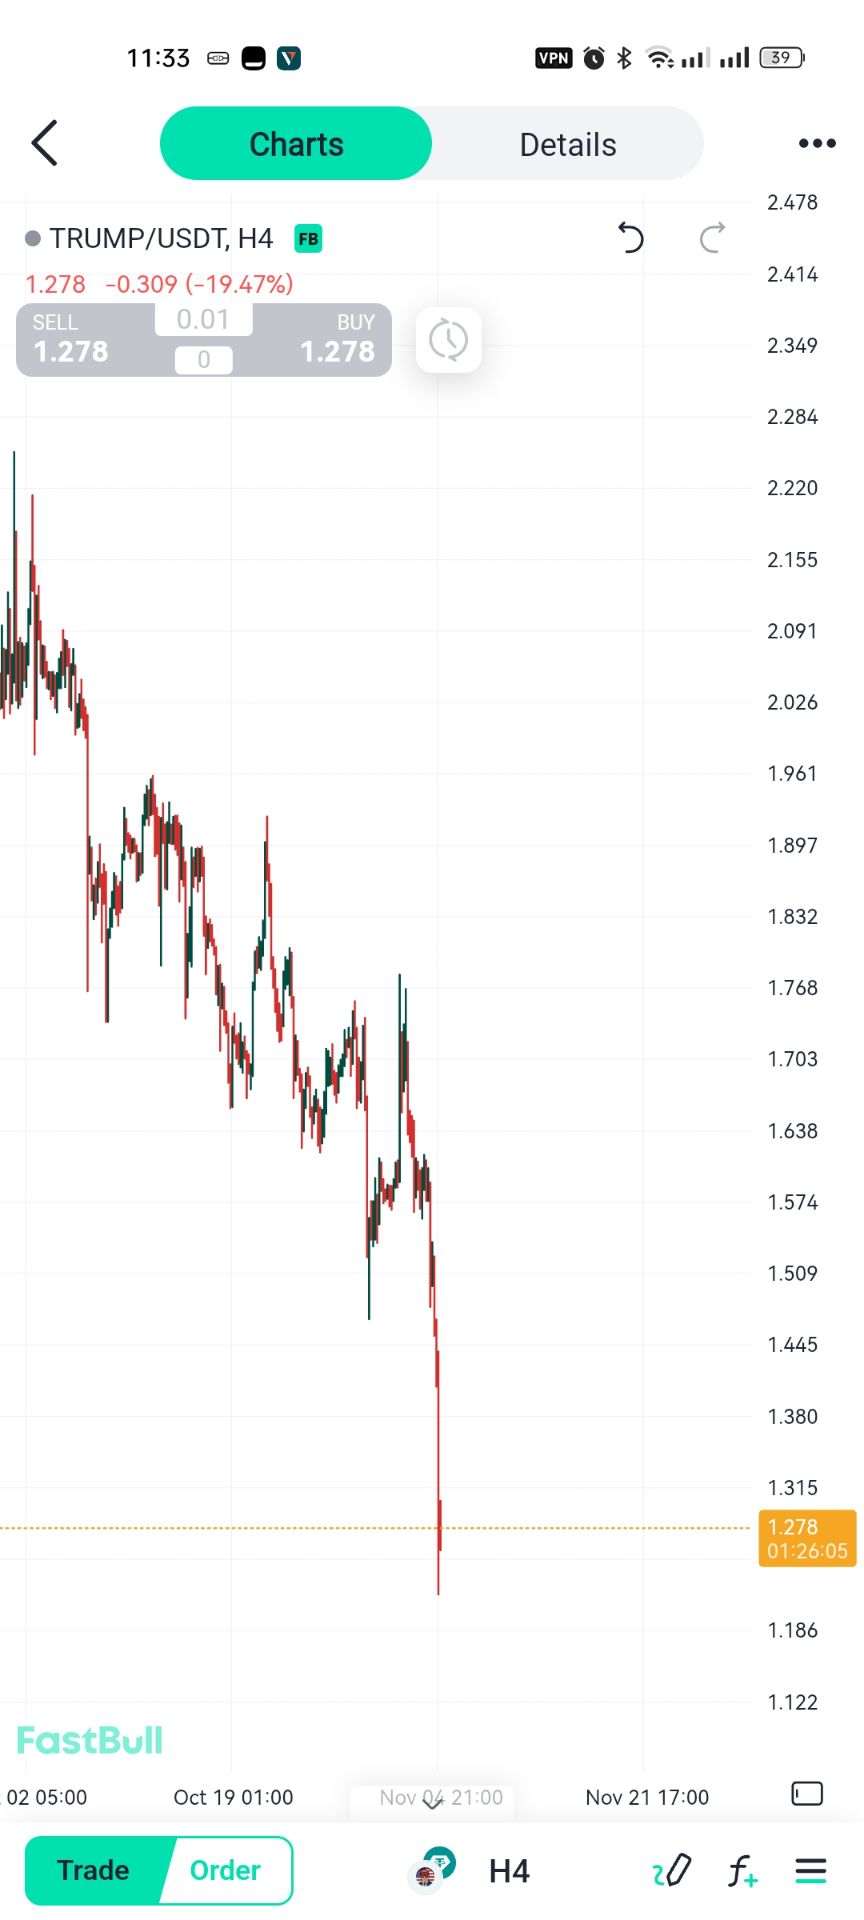
    @Matthewwhst I wanted to show you is how trump coin failed on anticipating the losing of the Republican
    5979741 flag
    como le ven en la semana al euro/dolar
    EuroTrader flag
    Matthew
    @EuroTraderhow did you know that
    @Matthewyou gonna research and keep an eye on the fundamentals. The fundamentals are gonna be short term drivers
    EuroTrader flag
    5979741
    como le ven en la semana al euro/dolar
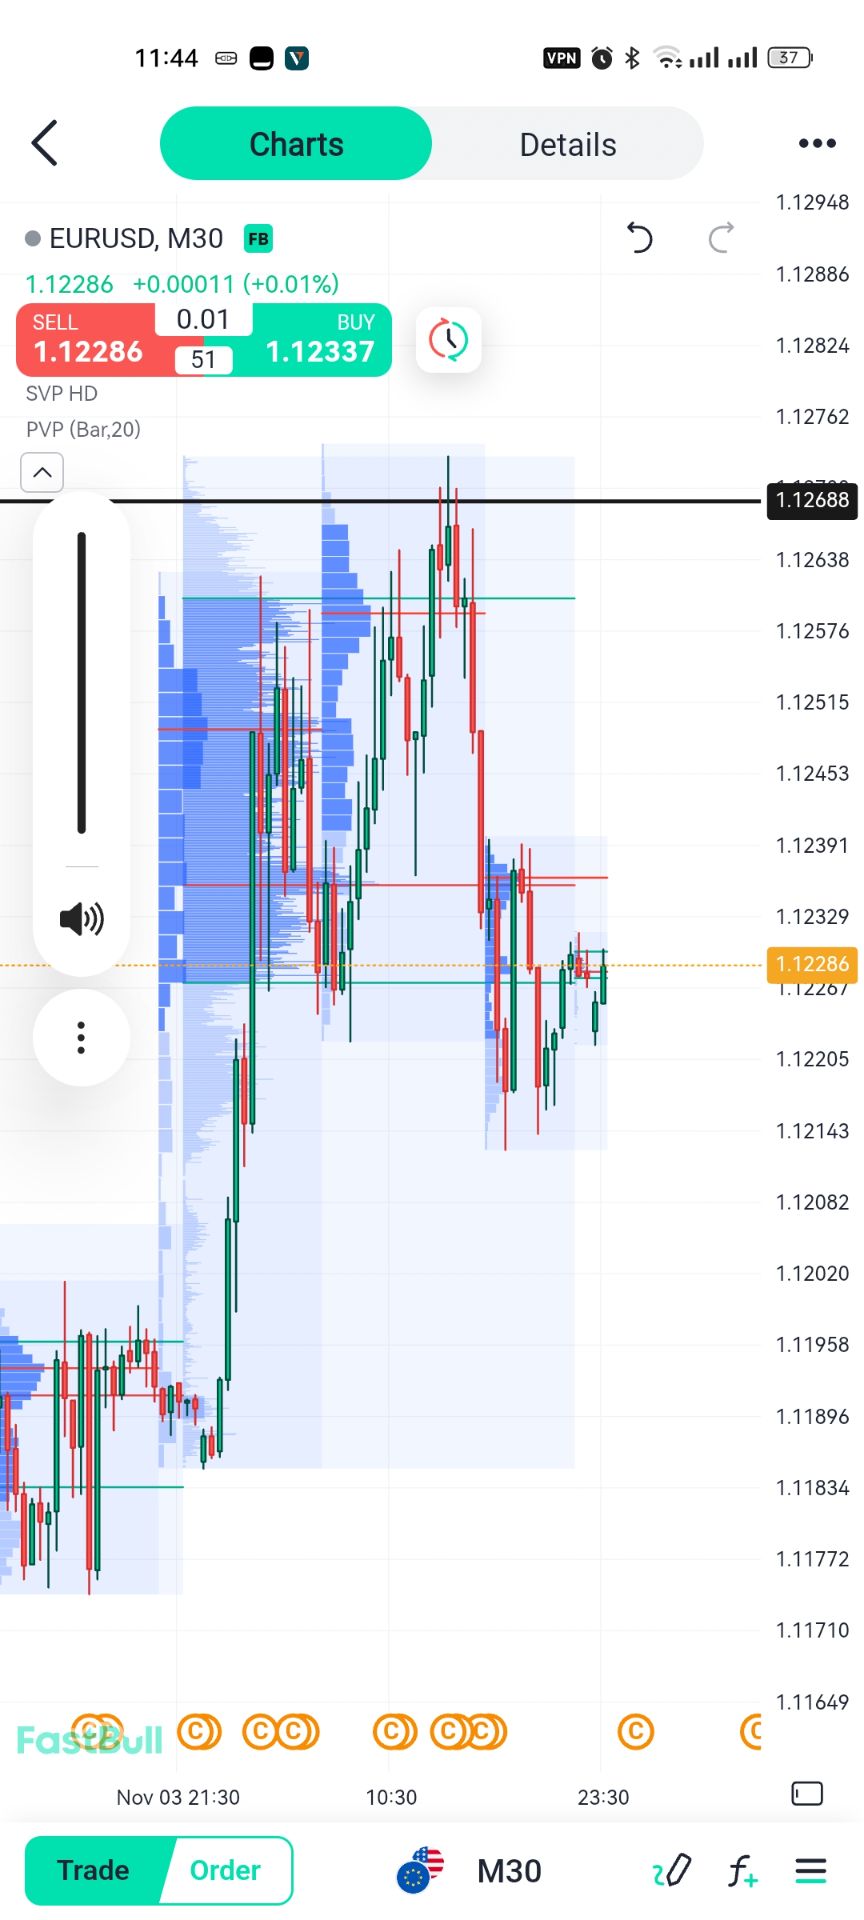
    @5979741irs in a range and there is a string possibility it would trade back into the range
    EuroTrader flag
    EuroTrader flag
    5979741
    como le ven en la semana al euro/dolar
    @5979741eurudf is still playing in the range so we should trade at the edges my bro
    Matthew flag
    EuroTrader
    @5979741irs in a range and there is a string possibility it would trade back into the range
    @EuroTraderi would pay attention to this
    Matthew flag
    5979741
    como le ven en la semana al euro/dolar
    @Visitor5979741are you trading the reverse now?
    Matthew flag
    EuroTrader
    @5979741irs in a range and there is a string possibility it would trade back into the range
    @EuroTraderI would call it a day here. thank you for your time I will be back in London
    EuroTrader flag
    @Matthewokay it's all good you know you should just have a good time away from the chetds. Cheers
    ankit flag
    Market is not opening
    ankit flag
    Why
    Osaghae Cephas flag
    hops hops hola
    liyan flag
    hello
    5975999 flag
    Any one selling gold now.? It has trapped all the sellers at lower levels.
    Jeric Soli flag
    yeah your right
    Jeric Soli flag
    I did buy now
    5975999 flag
    Anyone can check why it has came from 3900 to 4100 so fast and are we not looking now to sweep the weekly liquidity at around 3800 and under 3800 levels, I guess when trump annouce he is hitting Iran again we can see the drop again .? Very difficult to trade at this stage.
    Sammy Mwan
    5975999
    Anyone can check why it has came from 3900 to 4100 so fast and are we not looking now to sweep the weekly liquidity at around 3800 and under 3800 levels, I guess when trump annouce he is hitting Iran again we can see the drop again .? Very difficult to trade at this stage.
    @5975999 the mid term elections
    Type here...
    Add Symbol or Code

      No matching data

      All
      Recommend
      Stocks
      Cryptocurrencies
      Central Banks
      Trump Updates
      Featured News
      • All
      • Russia-Ukraine Conflict
      • Middle East Flashpoint
      • All
      • Russia-Ukraine Conflict
      • Middle East Flashpoint

      Search
      Products

      Charts Free Forever

      Chats Q&A with Experts
      Screeners Economic Calendar Data Tools
      Membership Features
      Data Warehouse Market Trends Institutional Data Policy Rates Macro

      Market Trends

      Market Sentiment Order Book Forex Correlations

      Top Indicators

      Charts Free Forever
      Markets

      News

      24/7 Analysis Education

      Latest Views

      Latest Update

      Signals

      Copy Rankings Latest Signals Become a signal provider AI Rating
      Contests
      Brokers

      Overview Brokers Assessment Rankings Regulators News Claims
      Broker listing Forex Brokers Comparison Tool Live Spread Comparison Scam
      Q&A Complaint Scam Alert Videos Tips to Detect Scam
      More

      Business
      Events
      Careers About Us Advertising Help Center

      White Label

      Broker API

      Data API

      Web Plug-ins

      Affiliate Program

      Awards Institution Evaluation IB Seminar Salon Event Exhibition
      Vietnam Thailand Singapore Dubai
      Fans Party Investment Sharing Session
      FastBull Summit BrokersView Expo
      Recent Searches
        Top Searches
          Markets
          Analysis
          User
          24/7
          Economic Calendar
          Education
          Data
          • Names
          • Latest
          • Prev

          View All

          No data

          Scan to Download

          Faster Charts, Chat Faster!

          Download
          English
          • English
          • Español
          • العربية
          • Bahasa Indonesia
          • Bahasa Melayu
          • Tiếng Việt
          • ภาษาไทย
          • Français
          • Italiano
          • Türkçe
          • Русский язык
          • 简中
          • 繁中
          Open Account
          Search
          Products
          Charts Free Forever
          Markets
          News
          Signals

          Copy Rankings Latest Signals Become a signal provider AI Rating
          Contests
          Brokers

          Overview Brokers Assessment Rankings Regulators News Claims
          Broker listing Forex Brokers Comparison Tool Live Spread Comparison Scam
          Q&A Complaint Scam Alert Videos Tips to Detect Scam
          More

          Business
          Events
          Careers About Us Advertising Help Center

          White Label

          Broker API

          Data API

          Web Plug-ins

          Affiliate Program

          Awards Institution Evaluation IB Seminar Salon Event Exhibition
          Vietnam Thailand Singapore Dubai
          Fans Party Investment Sharing Session
          FastBull Summit BrokersView Expo

          EUR/CAD BUY at 1.5680: Can the Euro Reclaim 1.5750 After a Strong Recovery?

          Gerik

          Forex

          Summary:

          EUR/CAD is attempting to stabilise around 1.5680 after recovering from October's low near 1.5553. The latest available market data shows the pair trading around 1.5703, with a daily range of 1.5672–1.5719. ...

          BUY EURCAD
          EXP
          TRADING

          1.56800

          Entry Price

          1.57500

          TP

          1.56450

          SL

          1.57036 +0.00125 +0.08%

          0.0

          Pips

          Flat

          1.56450

          SL

          Exit Price

          1.56800

          Entry Price

          1.57500

          TP
          Market Overview

          The European Central Bank's September decision to raise interest rates by 25 basis points reflects persistent inflationary pressure across the eurozone. Its projections anticipated inflation averaging 3.0% in 2026, before gradually declining toward its 2% target. This relatively restrictive monetary stance provides structural support for the euro, particularly if inflation remains elevated and policymakers maintain their willingness to tighten further.
          Canada, however, is not offering an easy fundamental advantage to euro buyers. The Bank of Canada raised its policy rate to 2.50% on 28 October, citing stronger global activity and persistent inflation. It also indicated that further increases could be necessary if elevated energy costs continue spreading through the economy. This creates a competitive yield environment between the two currencies rather than an obvious directional advantage.
          The more interesting development is the divergence between short-term recovery and longer-term weakness. EUR/CAD declined approximately 2.91% between January and November's latest monthly closing observations, while October's low reached approximately 1.5553. The subsequent recovery toward 1.5680 suggests that buyers are attempting to establish a base, but the pair has not yet demonstrated a decisive reversal of its broader declining structure.
          For the proposed BUY at 1.5680, the critical level is 1.5658. If this support region holds, the pair could attempt another advance toward 1.5719 and subsequently 1.5750. A sustained breakdown below 1.5650, however, would suggest that the recent recovery is losing credibility.

          Market Sentiment

          Current sentiment is cautiously constructive on the intraday timeframe, although the broader market remains defensive toward EUR/CAD. The latest available technical assessment identifies the daily trend as bearish, with RSI around 41.11 and MACD remaining negative. These readings indicate that medium-term selling pressure has not disappeared, even though shorter-term moving averages have begun generating positive signals.
          This divergence is particularly important for the BUY setup. Short-term traders may interpret the recent recovery as an opportunity to accumulate positions near support, while longer-term participants may continue selling into resistance. Consequently, the pair could experience considerable volatility around 1.5700–1.5720.
          The Canadian dollar also benefits from the Bank of Canada's relatively hawkish policy direction. Reuters reported on 4 November that Canada was the only major G10 central bank to raise interest rates during October, highlighting the relative strength of its current monetary-policy stance. This limits the fundamental case for aggressive euro appreciation.
          The strongest bullish development would be a successful retest of 1.5680, followed by higher M15 lows and a decisive break above 1.5719. Such behaviour would indicate that buyers are absorbing supply rather than simply benefiting from temporary short covering. Until that breakout occurs, the trade should be treated as a tactical rebound rather than a confirmed trend reversal.

          Technical Analysis

          EUR/CAD BUY at 1.5680: Can the Euro Reclaim 1.5750 After a Strong Recovery?_1
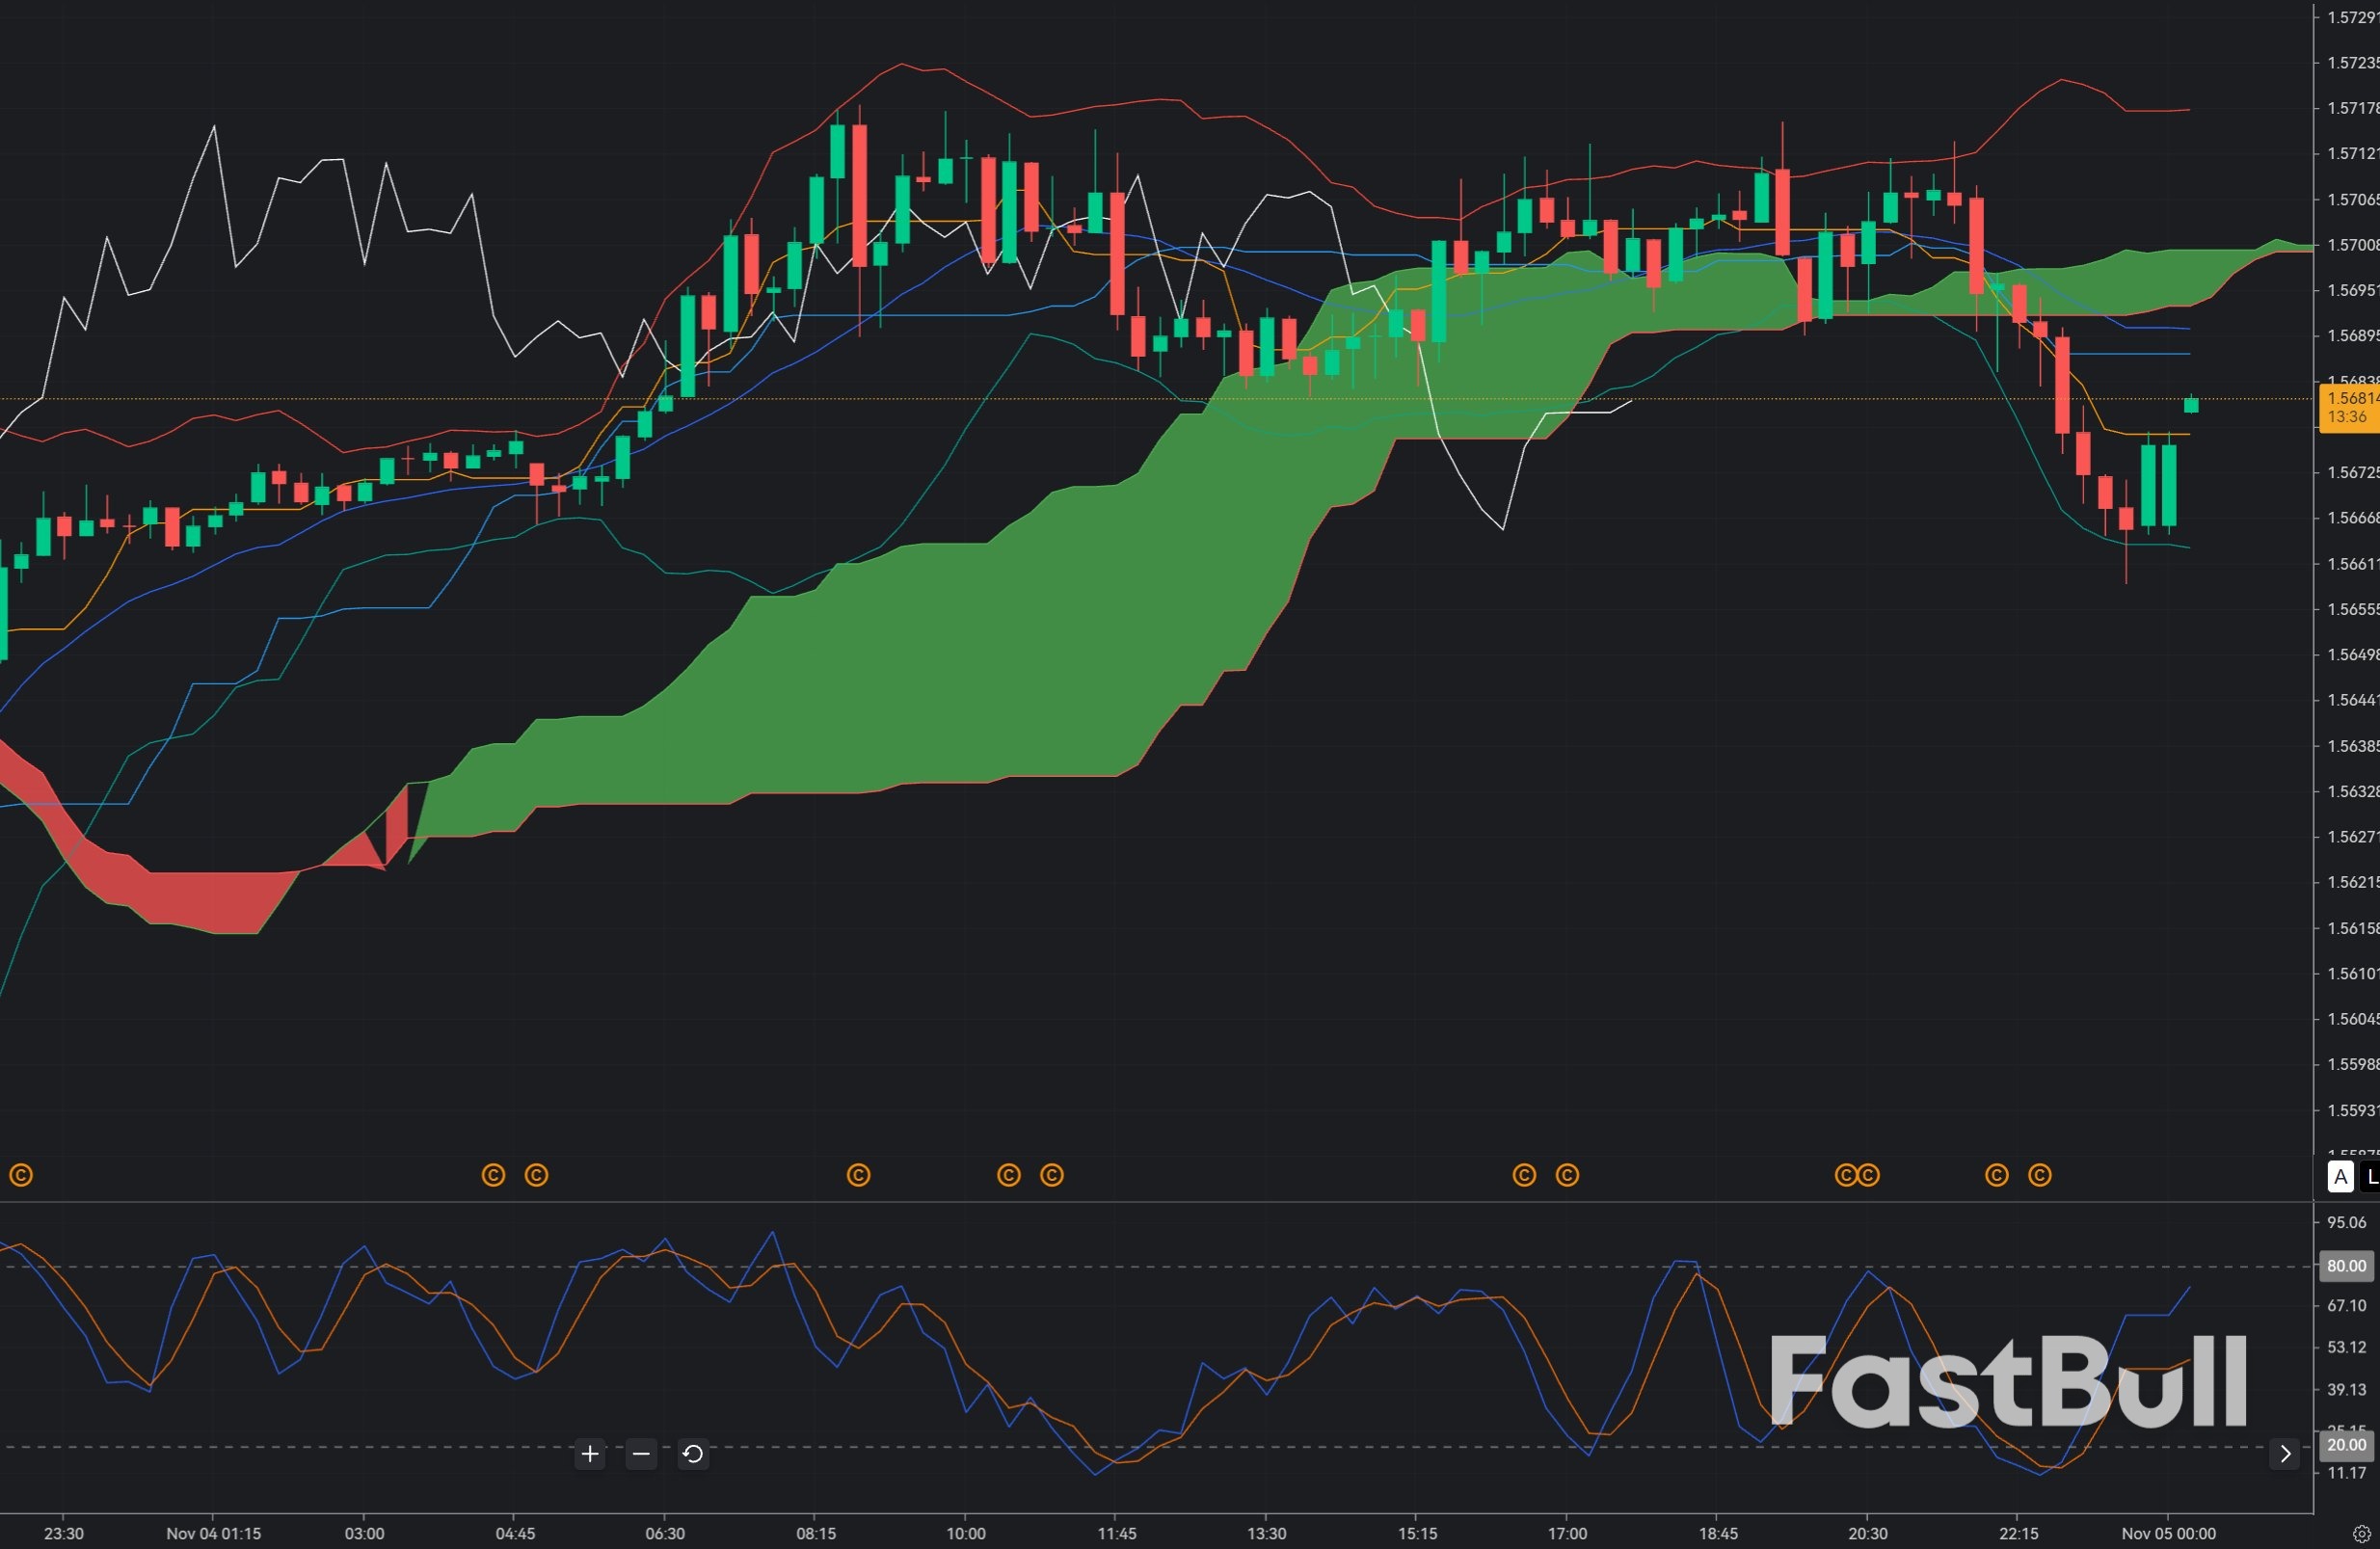
          Bollinger Bands (20,0,2): The preferred setup is for price to hold around the middle band or recover from the lower band near the proposed entry. A bullish candle closing back inside the bands after testing lower prices would indicate that selling pressure is weakening. A sustained move toward the upper band would support an advance toward 1.5720–1.5750. However, expanding bands with repeated closes below the middle band would invalidate the immediate bullish interpretation.
          Ichimoku Kinko Hyo (9,26,52): A bullish Tenkan-sen/Kijun-sen crossover would strengthen the setup, especially if price remains above the Kumo cloud. The Kijun-sen should provide dynamic support during a potential pullback. If price remains below the cloud, the broader intraday structure is still vulnerable to renewed selling, making confirmation above resistance essential.
          Stochastic (5,3,3): A bullish crossover below 20 would offer a favourable signal if price simultaneously holds above 1.5658. This would suggest that selling momentum is weakening and buyers are returning. Conversely, a bearish crossover above 80 near 1.5719 could indicate exhaustion and increase the probability of another correction.
          The combined technical outlook favours a cautious BUY while 1.5658 remains intact. The first important challenge is 1.5719, followed by 1.5750. A sustained break below 1.5650 would weaken the recovery thesis. These are technical confirmation conditions; live M15 indicator values have not been independently verified.

          Trade Recommendation

          Entry: 1.56800
          Take Profit: 1.57500
          Stop Loss: 1.56450
          Risk Warnings and Disclaimers
          You understand and acknowledge that there is a high degree of risk involved in trading. Following any strategies or investment methods may lead to potential losses. The content on the site is provided by our contributors and analysts for information purposes only. You are solely responsible for determining whether any trading assets, securities, strategy, or any other product is suitable for investing based on your own investment objectives and financial situation.
          Add to Favorites
          Share
          FastBull
          Copyright © 2026 FastBull Ltd

          728 RM B 7/F GEE LOK IND BLDG NO 34 HUNG TO RD KWUN TONG KLN HONG KONG

          TelegramInstagramTwitterfacebooklinkedin
          App Store Google Play Android Windows
          Products
          Charts

          Chats

          Q&A with Experts
          Screeners
          Economic Calendar
          Data
          Tools
          Membership
          Features
          Function
          Markets
          Copy Trading
          Latest Signals
          Contests
          24/7
          Analysis
          Education
          Company
          Careers
          About Us
          Contact Us
          Advertising
          Download FastBull
          Help Center
          Feedback
          User Agreement
          Privacy Policy
          Personal Information Protection Statement
          Business

          White Label

          Broker API

          Data API

          Web Plug-ins

          Poster Maker

          Affiliate Program

          Risk Disclosure

          The risk of loss in trading financial instruments such as stocks, FX, commodities, futures, bonds, ETFs and crypto can be substantial. You may sustain a total loss of the funds that you deposit with your broker. Therefore, you should carefully consider whether such trading is suitable for you in light of your circumstances and financial resources.

          No decision to invest should be made without thoroughly conducting due diligence by yourself or consulting with your financial advisors. Our web content might not suit you since we don't know your financial conditions and investment needs. Our financial information might have latency or contain inaccuracy, so you should be fully responsible for any of your trading and investment decisions. The company will not be responsible for your capital loss.

          Without getting permission from the website, you are not allowed to copy the website's graphics, texts, or trademarks. Intellectual property rights in the content or data incorporated into this website belong to its providers and exchange merchants.

          Not Logged In

          Log in to access more features

          Connect Broker
          Become a signal provider
          Help Center
          Customer Service
          Dark Mode
          Price Up/Down Colors

          Log In

          Sign Up

          Position
          Layout
          Fullscreen
          Default to Chart
          The chart page opens by default when you visit fastbull.com