• Trade
  • Markets
  • Copy
  • Contests
  • 24/7
  • Calendar
  • Q&A
  • Chats
Screeners
SYMBOL
LAST
BID
ASK
HIGH
LOW
NET CHG.
%CHG.
SPREAD
SOURCE
SPX
S&P 500 Index
7541.40
7541.40
7541.40
7662.23
7539.38
-38.67
-0.51%
--
--
DJI
Dow Jones Industrial Average
51983.98
51983.98
51983.98
52424.91
51981.66
+213.67
+ 0.41%
--
--
IXIC
NASDAQ Composite Index
25164.31
25164.31
25164.31
25799.46
25145.95
-272.68
-1.07%
--
--
USDX
US Dollar Index
101.633
101.633
101.713
101.643
101.608
-0.010
-0.01%
--
--
EURUSD
Euro / US Dollar
1.11861
1.11861
1.11871
1.11972
1.11815
-0.00001
0.00%
--
--
GBPUSD
Pound Sterling / US Dollar
1.34056
1.34056
1.34069
1.34154
1.33996
+0.00003
0.00%
--
--
XAUUSD
Gold / US Dollar
3951.87
3951.87
3952.32
3964.23
3942.71
+5.10
+ 0.13%
--
--
WTI
Light Sweet Crude Oil
96.028
96.028
96.063
96.175
95.255
+0.698
+ 0.73%
--
--

Community Accounts

Signal Accounts
--
Profit Accounts
--
Loss Accounts
--
View More

Become a signal provider

Sell trading signals to earn additional income

View More

Guide to Copy Trading

Get started with ease and confidence

View More

Signal Accounts for Members

All Signal Accounts

Best Return
  • Best Return
  • Best P/L
  • Best MDD
Past 1W
  • Past 1W
  • Past 1M
  • Past 1Y

All Contests

  • All
  • Recommend
  • Stocks
  • Cryptocurrencies
  • Central Banks
  • Trump Updates
  • Featured News
Top News Only
Share

Brent Crude Oil Broke Through $105 Per Barrel, Up 0.27% On The Day

Share

The Taiwan Dollar Fell 0.3% Against The US Dollar To 32.690

Share

The Most Active Asphalt Futures Contract Fell 6% Intraday, Currently Trading At 4941.00 Yuan

Share

The Most Active Ethylene Glycol Futures Contract Fell 3% Intraday, Currently Trading At 5168.00 Yuan

Share

The Most Active PVC Futures Contract Fell 1% Intraday, Currently Trading At 5167.00 Yuan

Share

The Shanghai Crude Oil Futures Contract Fell 7% Intraday, Currently Trading At 687.60 Yuan

Share

WTI Crude Oil Broke Through $97 Per Barrel, Up 0.56% On The Day

Share

Market News: The United States Attacked Iran's Qeshm Island

Share

The Offshore Yuan Weakened Against The US Dollar In The Short Term, Currently Trading At 6.6550

Share

China's Central Bank Announced That, Effective November 15, 2026, It Will Raise The Reserve Requirement Ratio For Foreign Exchange Deposits Of Financial Institutions By 2 Percentage Points, From The Current 4% To 6%

Share

New York Gold Futures Broke Through $3,970 Per Ounce, Up 0.02% On The Day

Share

Spot Gold Broke Through $3,960 Per Ounce, Up 0.38% On The Day

Share

The Bank Of Korea Expects Inflation To Remain Above 2% In November

Share

Market News: Disney Plans To Lay Off Thousands Of Employees; Management Has Been Asked To Cut Spending By 20%

Share

Eddie Yue, Chief Executive Of The Hong Kong Monetary Authority: The Exchange Fund Is Expected To Perform Well

Share

North Korea Denies Involvement In Binance Hack, Calls US Allegations 'absurd Remarks'

Share

[Research Selection • Research Report Data] The China Securities Regulatory Commission (CSRC) Has Stated That It Will Make Every Effort To Stabilize The Market And Expectations, And Analysts Are Optimistic That The Securities Sector Will Directly Benefit; This Insurance Company Maintains Steady Growth In Core Profits, Has Stable Solvency, And Short-term Investment Fluctuations Do Not Change The Resilience Of Its Main Insurance Business

Share

Spot Gold And WTI Crude Oil Opened Steady On Tuesday, Currently Trading At $3,947 Per Ounce And $95.4 Per Barrel, Respectively

Share

Spot Gold Broke Through $3,950 Per Ounce, Up 0.07% On The Day

Share

A Senior U.S. Official Said The Trilateral Talks Between The U.S., Russia, And Ukraine Would Cover Ending The War, A Post-war Security Agreement, De-escalation Of The Situation, And Aid Measures

TIME
ACT
FCST
PREV
IMPACT
South Korea Trade Balance Prelim (Oct)

A:--

F: --

P: --
XAUUSD
  • XAUUSD
  • XAGUSD
  • WTI
  • USDX
Indonesia IHS Markit Manufacturing PMI (Oct)

A:--

F: --

P: --

XAUUSD
  • XAUUSD
  • XAGUSD
  • WTI
  • USDX
Australia Building Permits YoY (SA) (Sept)

A:--

F: --

P: --

AUDUSD
  • AUDUSD
  • XAUUSD
  • XAGUSD
  • WTI
  • USDX
Australia Building Permits MoM (SA) (Sept)

A:--

F: --

P: --
AUDUSD
  • AUDUSD
  • XAUUSD
  • XAGUSD
  • WTI
  • USDX
Australia Private Building Permits MoM (SA) (Sept)

A:--

F: --

P: --

AUDUSD
  • AUDUSD
  • XAUUSD
  • XAGUSD
  • WTI
  • USDX
Japan Manufacturing PMI Final (Oct)

A:--

F: --

P: --

USDJPY
  • USDJPY
  • XAUUSD
  • XAGUSD
  • WTI
  • USDX
South Korea IHS Markit Manufacturing PMI (SA) (Oct)

A:--

F: --

P: --

XAUUSD
  • XAUUSD
  • XAGUSD
  • WTI
  • USDX
China, Mainland Caixin Manufacturing PMI (SA) (Oct)

A:--

F: --

P: --

XAUUSD
  • XAUUSD
  • XAGUSD
  • WTI
  • USDX
Indonesia Inflation Rate YoY (Oct)

A:--

F: --

P: --

XAUUSD
  • XAUUSD
  • XAGUSD
  • WTI
  • USDX
Indonesia Trade Balance (Sept)

A:--

F: --

P: --

XAUUSD
  • XAUUSD
  • XAGUSD
  • WTI
  • USDX
Indonesia Core Inflation YoY (Oct)

A:--

F: --

P: --

XAUUSD
  • XAUUSD
  • XAGUSD
  • WTI
  • USDX
India HSBC Manufacturing PMI Final (Oct)

A:--

F: --

P: --

XAUUSD
  • XAUUSD
  • XAGUSD
  • WTI
  • USDX
Australia Commodity Price YoY (Oct)

A:--

F: --

P: --

AUDUSD
  • AUDUSD
  • XAUUSD
  • XAGUSD
  • WTI
  • USDX
Russia IHS Markit Manufacturing PMI (Oct)

A:--

F: --

P: --

WTI
  • WTI
  • XAUUSD
  • XAGUSD
  • USDX
Germany Actual Retail Sales MoM (Sept)

A:--

F: --

P: --
EURUSD
  • EURUSD
  • XAUUSD
  • XAGUSD
  • WTI
  • USDX
Turkey Manufacturing PMI (Oct)

A:--

F: --

P: --

XAUUSD
  • XAUUSD
  • XAGUSD
  • WTI
  • USDX
Italy Manufacturing PMI (SA) (Oct)

A:--

F: --

P: --

EURUSD
  • EURUSD
  • XAUUSD
  • XAGUSD
  • WTI
  • USDX
South Africa Manufacturing PMI (Oct)

A:--

F: --

P: --

XAUUSD
  • XAUUSD
  • XAGUSD
  • WTI
  • USDX
Euro Zone Manufacturing PMI Final (Oct)

A:--

F: --

P: --

EURUSD
  • EURUSD
  • XAUUSD
  • XAGUSD
  • WTI
  • USDX
U.K. Manufacturing PMI Prelim (Oct)

A:--

F: --

P: --

GBPUSD
  • GBPUSD
  • XAUUSD
  • XAGUSD
  • WTI
  • USDX
Canada National Economic Confidence Index

A:--

F: --

P: --

USDCAD
  • USDCAD
  • XAUUSD
  • XAGUSD
  • WTI
  • USDX
Canada Manufacturing PMI (SA) (Oct)

A:--

F: --

P: --

USDCAD
  • USDCAD
  • XAUUSD
  • XAGUSD
  • WTI
  • USDX
U.S. IHS Markit Manufacturing PMI Final (Oct)

A:--

F: --

P: --

USDX
  • USDX
  • XAUUSD
  • XAGUSD
  • WTI
U.S. ISM Inventories Index (Oct)

A:--

F: --

P: --

USDX
  • USDX
  • XAUUSD
  • XAGUSD
  • WTI
U.S. Construction Spending MoM (Sept)

A:--

F: --

P: --
USDX
  • USDX
  • XAUUSD
  • XAGUSD
  • WTI
U.S. ISM Output Index (Oct)

A:--

F: --

P: --

USDX
  • USDX
  • XAUUSD
  • XAGUSD
  • WTI
U.S. ISM Manufacturing Employment Index (Oct)

A:--

F: --

P: --

USDX
  • USDX
  • XAUUSD
  • XAGUSD
  • WTI
U.S. ISM Manufacturing PMI (Oct)

A:--

F: --

P: --

USDX
  • USDX
  • XAUUSD
  • XAGUSD
  • WTI
U.S. ISM Manufacturing New Orders Index (Oct)

A:--

F: --

P: --

USDX
  • USDX
  • XAUUSD
  • XAGUSD
  • WTI
South Korea CPI YoY (Oct)

A:--

F: --

P: --

XAUUSD
  • XAUUSD
  • XAGUSD
  • WTI
Australia Overnight (Borrowing) Key Rate

--

F: --

P: --

RBA Rate Statement
Saudi Arabia IHS Markit Composite PMI (Oct)

--

F: --

P: --

RBA Press Conference
U.S. Dallas Fed PCE Price Index YoY (Sept)

--

F: --

P: --

Turkey CPI YoY (Oct)

--

F: --

P: --

Turkey PPI YoY (Oct)

--

F: --

P: --

Brazil IHS Markit Manufacturing PMI (Oct)

--

F: --

P: --

U.S. Weekly Redbook Index YoY

--

F: --

P: --

U.S. JOLTS Job Openings (SA) (Sept)

--

F: --

P: --

U.S. Factory Orders MoM (Sept)

--

F: --

P: --

U.S. Factory Orders MoM (Excl. Transport) (Sept)

--

F: --

P: --

U.S. Factory Orders MoM (Excl. Defense) (Sept)

--

F: --

P: --

Mexico Manufacturing PMI (Oct)

--

F: --

P: --

U.S. API Weekly Crude Oil Stocks

--

F: --

P: --

U.S. API Weekly Cushing Crude Oil Stocks

--

F: --

P: --

U.S. API Weekly Gasoline Stocks

--

F: --

P: --

U.S. API Weekly Refined Oil Stocks

--

F: --

P: --

Australia Services PMI Prelim (Oct)

--

F: --

P: --

Japan Monetary Base YoY (SA) (Oct)

--

F: --

P: --

China, Mainland Caixin Composite PMI (Oct)

--

F: --

P: --

China, Mainland Caixin Services PMI (Oct)

--

F: --

P: --

India HSBC Services PMI Final (Oct)

--

F: --

P: --

India IHS Markit Composite PMI (Oct)

--

F: --

P: --

Italy Services PMI (SA) (Oct)

--

F: --

P: --

Italy Composite PMI (Oct)

--

F: --

P: --

Germany Composite PMI Final (SA) (Oct)

--

F: --

P: --

Euro Zone Services PMI Final (Oct)

--

F: --

P: --

Euro Zone Composite PMI Final (Oct)

--

F: --

P: --

U.K. Services PMI Prelim (Oct)

--

F: --

P: --

Q&A with Experts
    • All
    • Chatrooms
    • Groups
    • Friends
    Sanjeev Ku flag
    EuroTrader
    @Sanjeev Kuand the propensity to talke risk frops as you grow higher and highe r
    @EuroTrader yeh reason during college days carefree attitude but with age come maturity and responsibilty. like rwsponsibilty of wife kids old mother father if alive. i have two mother too take care off haha
    EuroTrader flag
    Sanjeev Ku
    @EuroTrader yeh reason during college days carefree attitude but with age come maturity and responsibilty. like rwsponsibilty of wife kids old mother father if alive. i have two mother too take care off haha
    @Sanjeev Kueactly, when there is more res[ponsibility, losses actually hits differently than when we are much younger
    EuroTrader flag
    Sanjeev Ku
    @EuroTrader yeh reason during college days carefree attitude but with age come maturity and responsibilty. like rwsponsibilty of wife kids old mother father if alive. i have two mother too take care off haha
    @Sanjeev Kuthis week i would just be sitting pretty chill and waiting for the nfp numbers
    Matthew flag
    EuroTrader
    @Sanjeev Kuthis week i would just be sitting pretty chill and waiting for the nfp numbers
    @EuroTradernfp is this week, i never knew
    EuroTrader flag
    Matthew
    @EuroTradernfp is this week, i never knew
    @Matthewyou truly forgot because nfp is actually the first friday of evry month
    EuroTrader flag
    EuroTrader flag
    EuroTrader
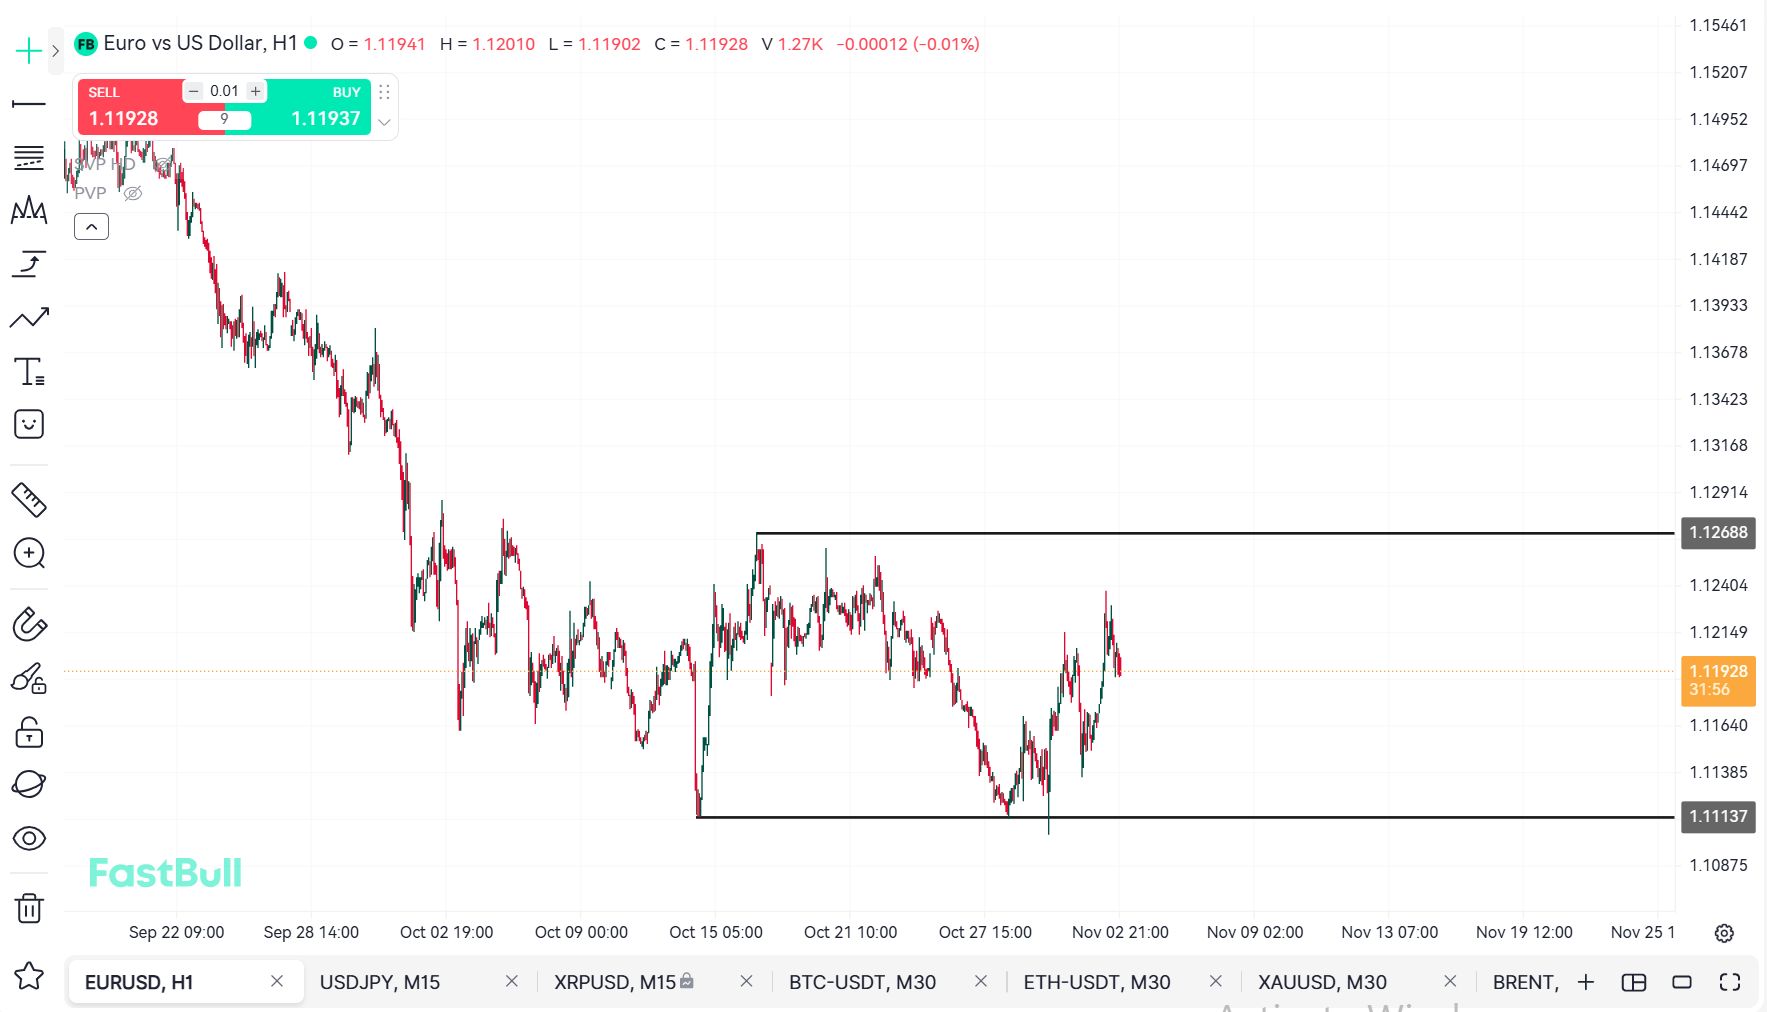
    @Matthewthis is eurusd, i am ready for the week, remember the plan, buy at support and sell resiatance because we are in a sideways profile
    Matthew flag
    EuroTrader
    @Matthewyou truly forgot because nfp is actually the first friday of evry month
    @EuroTraderyes i just remember
    Matthew flag
    EuroTrader
    @Matthewyou truly forgot because nfp is actually the first friday of evry month
    @EuroTradernfp week is sometimes slow before friday
    EuroTrader flag
    Matthew
    @EuroTradernfp week is sometimes slow before friday
    @Matthewno one would want to sit out before the numbers are released, would you like to be exposed in the markets before a major release?
    EuroTrader flag
    Matthew
    @EuroTraderyes i just remember
    @Matthewthe non farm payroll numbers would really have an impact on the rate decisions
    Matthew flag
    EuroTrader
    @Matthewthe non farm payroll numbers would really have an impact on the rate decisions
    @EuroTraderthe next one is when
    Matthew flag
    EuroTrader
    @Matthewthe non farm payroll numbers would really have an impact on the rate decisions
    @EuroTraderthe next one is when
    Matthew flag
    EuroTrader
    @Matthewno one would want to sit out before the numbers are released, would you like to be exposed in the markets before a major release?
    @EuroTraderevrtyone is careful
    EuroTrader flag
    Matthew
    @EuroTraderthe next one is when
    @Matthewthe next rate decision is in december, thats when the next rate numbers would be announced effectively
    EuroTrader flag
    Matthew
    @EuroTraderevrtyone is careful
    @Matthewevry one has to be careful cause we might get to see some volatility hit the markets
    EuroTrader flag
    EuroTrader flag
    EuroTrader
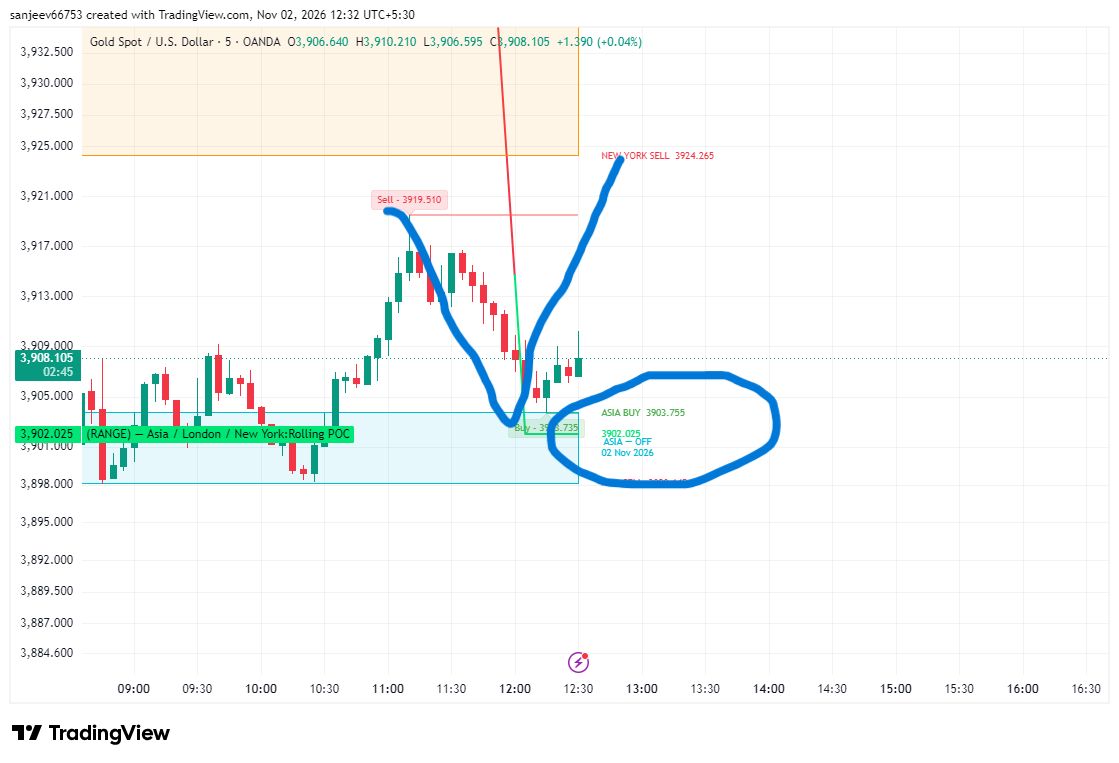
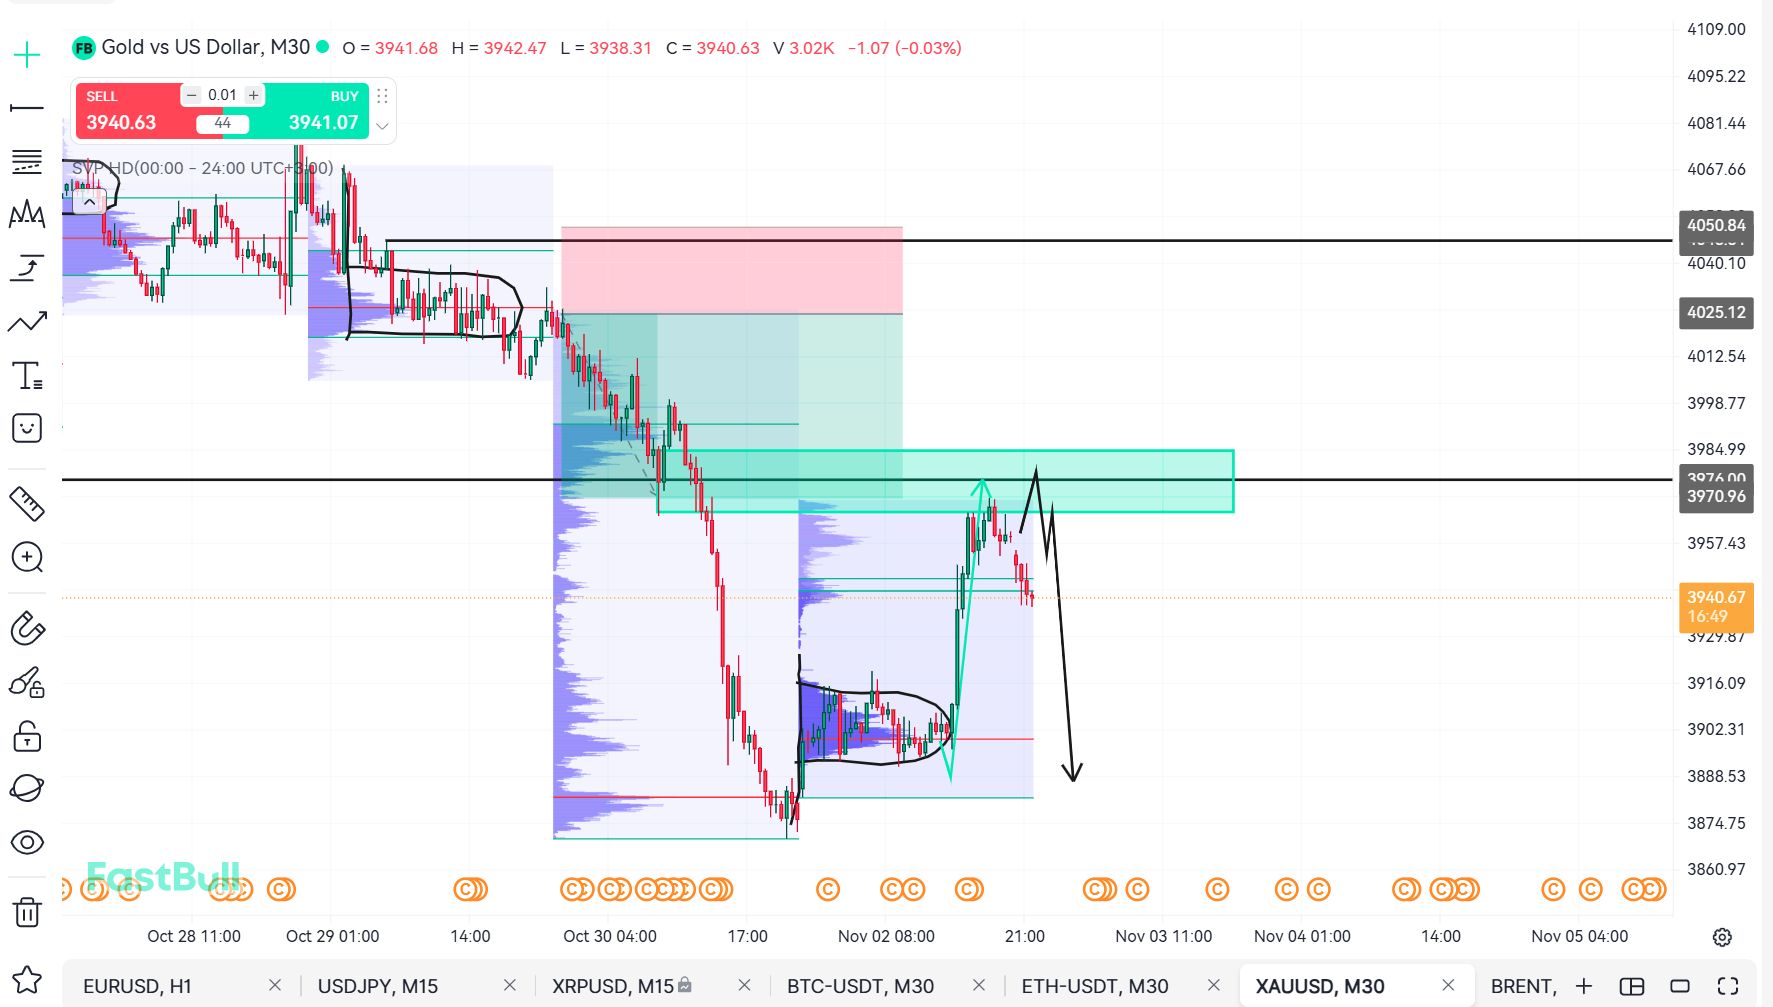
    @Matthewgold is heavy at the moment, te price is reacting at the resistance level as we had expected it to do
    B&W flag
    mohon sinyal emas?
    5920320 flag
    Sanjeev Ku
    @Sanjeev Ku Hi Sanjeev will you be selling now, market is so confusing at this stage, alo OIL just had a huge spike. What is your view now.? Gold is above 200 EMA so if it comes under that would you sell, if it breaks PDH will you buy and what will you target for.?
    Type here...
    Add Symbol or Code

      No matching data

      All
      Recommend
      Stocks
      Cryptocurrencies
      Central Banks
      Trump Updates
      Featured News
      • All
      • Russia-Ukraine Conflict
      • Middle East Flashpoint
      • All
      • Russia-Ukraine Conflict
      • Middle East Flashpoint

      Search
      Products

      Charts Free Forever

      Chats Q&A with Experts
      Screeners Economic Calendar Data Tools
      Membership Features
      Data Warehouse Market Trends Institutional Data Policy Rates Macro

      Market Trends

      Market Sentiment Order Book Forex Correlations

      Top Indicators

      Charts Free Forever
      Markets

      News

      24/7 Analysis Education

      Latest Views

      Latest Update

      Signals

      Copy Rankings Latest Signals Become a signal provider AI Rating
      Contests
      Brokers

      Overview Brokers Assessment Rankings Regulators News Claims
      Broker listing Forex Brokers Comparison Tool Live Spread Comparison Scam
      Q&A Complaint Scam Alert Videos Tips to Detect Scam
      More

      Business
      Events
      Careers About Us Advertising Help Center

      White Label

      Broker API

      Data API

      Web Plug-ins

      Affiliate Program

      Awards Institution Evaluation IB Seminar Salon Event Exhibition
      Vietnam Thailand Singapore Dubai
      Fans Party Investment Sharing Session
      FastBull Summit BrokersView Expo
      Recent Searches
        Top Searches
          Markets
          Analysis
          User
          24/7
          Economic Calendar
          Education
          Data
          • Names
          • Latest
          • Prev

          View All

          No data

          Scan to Download

          Faster Charts, Chat Faster!

          Download
          English
          • English
          • Español
          • العربية
          • Bahasa Indonesia
          • Bahasa Melayu
          • Tiếng Việt
          • ภาษาไทย
          • Français
          • Italiano
          • Türkçe
          • Русский язык
          • 简中
          • 繁中
          Open Account
          Search
          Products
          Charts Free Forever
          Markets
          News
          Signals

          Copy Rankings Latest Signals Become a signal provider AI Rating
          Contests
          Brokers

          Overview Brokers Assessment Rankings Regulators News Claims
          Broker listing Forex Brokers Comparison Tool Live Spread Comparison Scam
          Q&A Complaint Scam Alert Videos Tips to Detect Scam
          More

          Business
          Events
          Careers About Us Advertising Help Center

          White Label

          Broker API

          Data API

          Web Plug-ins

          Affiliate Program

          Awards Institution Evaluation IB Seminar Salon Event Exhibition
          Vietnam Thailand Singapore Dubai
          Fans Party Investment Sharing Session
          FastBull Summit BrokersView Expo

          CAD/CHF BUY at 0.5850: Will Key Support Trigger a Bullish Reversal?

          Gerik

          Forex

          Summary:

          CAD/CHF is trading around 0.5870–0.5890 in the latest available market data, with technical support identified near 0.5856 and resistance around 0.5919. Your proposed BUY at 0.5850 sits just beneath that support...

          BUY CADCHF
          EXP
          TRADING

          0.58500

          Entry Price

          0.58900

          TP

          0.58250

          SL

          0.58550 +0.00041 +0.07%

          0.0

          Pips

          Flat

          0.58250

          SL

          Exit Price

          0.58500

          Entry Price

          0.58900

          TP
          Market Overview

          CAD/CHF is approaching a decision point after retreating from its late-October highs. Historical data places the pair's recent peak near 0.5929 on 29 October, while subsequent market observations show a pullback toward the 0.5870–0.5890 area. This correction matters because the Canadian dollar had benefited from the Bank of Canada's 25-basis-point rate increase, yet the market has struggled to maintain its earlier upward momentum.
          The monetary-policy differential remains favourable to CAD in principle. The Bank of Canada raised its overnight rate to 2.50% on 28 October, whereas the Swiss National Bank maintained its policy rate at 0% at its September meeting. Higher Canadian yields may support demand for CAD relative to CHF, particularly when investors are comfortable holding risk-sensitive currencies. Nevertheless, this advantage is not sufficient by itself to guarantee appreciation.
          The more immediate concern is Canada's weakening economic momentum. Preliminary data showed that Canadian GDP contracted by 0.1% in September, against expectations for modest growth. This introduces a meaningful complication: the Bank of Canada has tightened policy, but a weakening economy could limit the sustainability of the Canadian dollar's gains. Meanwhile, the Swiss franc can attract defensive demand when investors become concerned about global growth or financial-market volatility.
          For a BUY at 0.5850, the key question is whether the decline represents a temporary correction within the broader advance or the beginning of a deeper reversal. Technical analysis identifies 0.5856 as nearby support, 0.5777 as a lower support reference and 0.5919 as resistance. A successful defence of the 0.5850–0.5856 region could create room for a recovery toward 0.5890 and subsequently 0.5919. A decisive breakdown, however, would undermine the bullish setup.

          Market Sentiment

          The sentiment picture is mixed rather than decisively bullish. The broader technical trend remains classified as bullish across short-, medium- and long-term horizons, but the latest pullback shows that sellers are challenging the market's upward structure. This combination can produce sharp two-way price action: buyers may defend established support, while sellers exploit disappointing Canadian data to push the pair lower.
          The most important distinction is between a market that is oversold and one that has actually reversed. A decline toward 0.5850 may attract short-covering, especially if traders who sold near 0.5920 begin taking profits. However, if price repeatedly tests support without recovering, the selling pressure may indicate that buyers are withdrawing rather than accumulating positions.
          For the BUY thesis to strengthen, CAD/CHF should show an identifiable rejection of lower prices, followed by a recovery above 0.5860–0.5870. Higher M15 lows would indicate that buyers are gradually regaining control. Conversely, consecutive bearish candles closing below 0.5850 would suggest that the market is repricing Canadian growth risks and that the lower support around 0.5777 may become relevant.
          The immediate outlook therefore favours patience. The 0.5850 entry is attractive only if the market demonstrates that demand is present; the monetary-policy differential provides supporting context, not a substitute for confirmation.

          Technical Analysis

          CAD/CHF BUY at 0.5850: Will Key Support Trigger a Bullish Reversal?_1
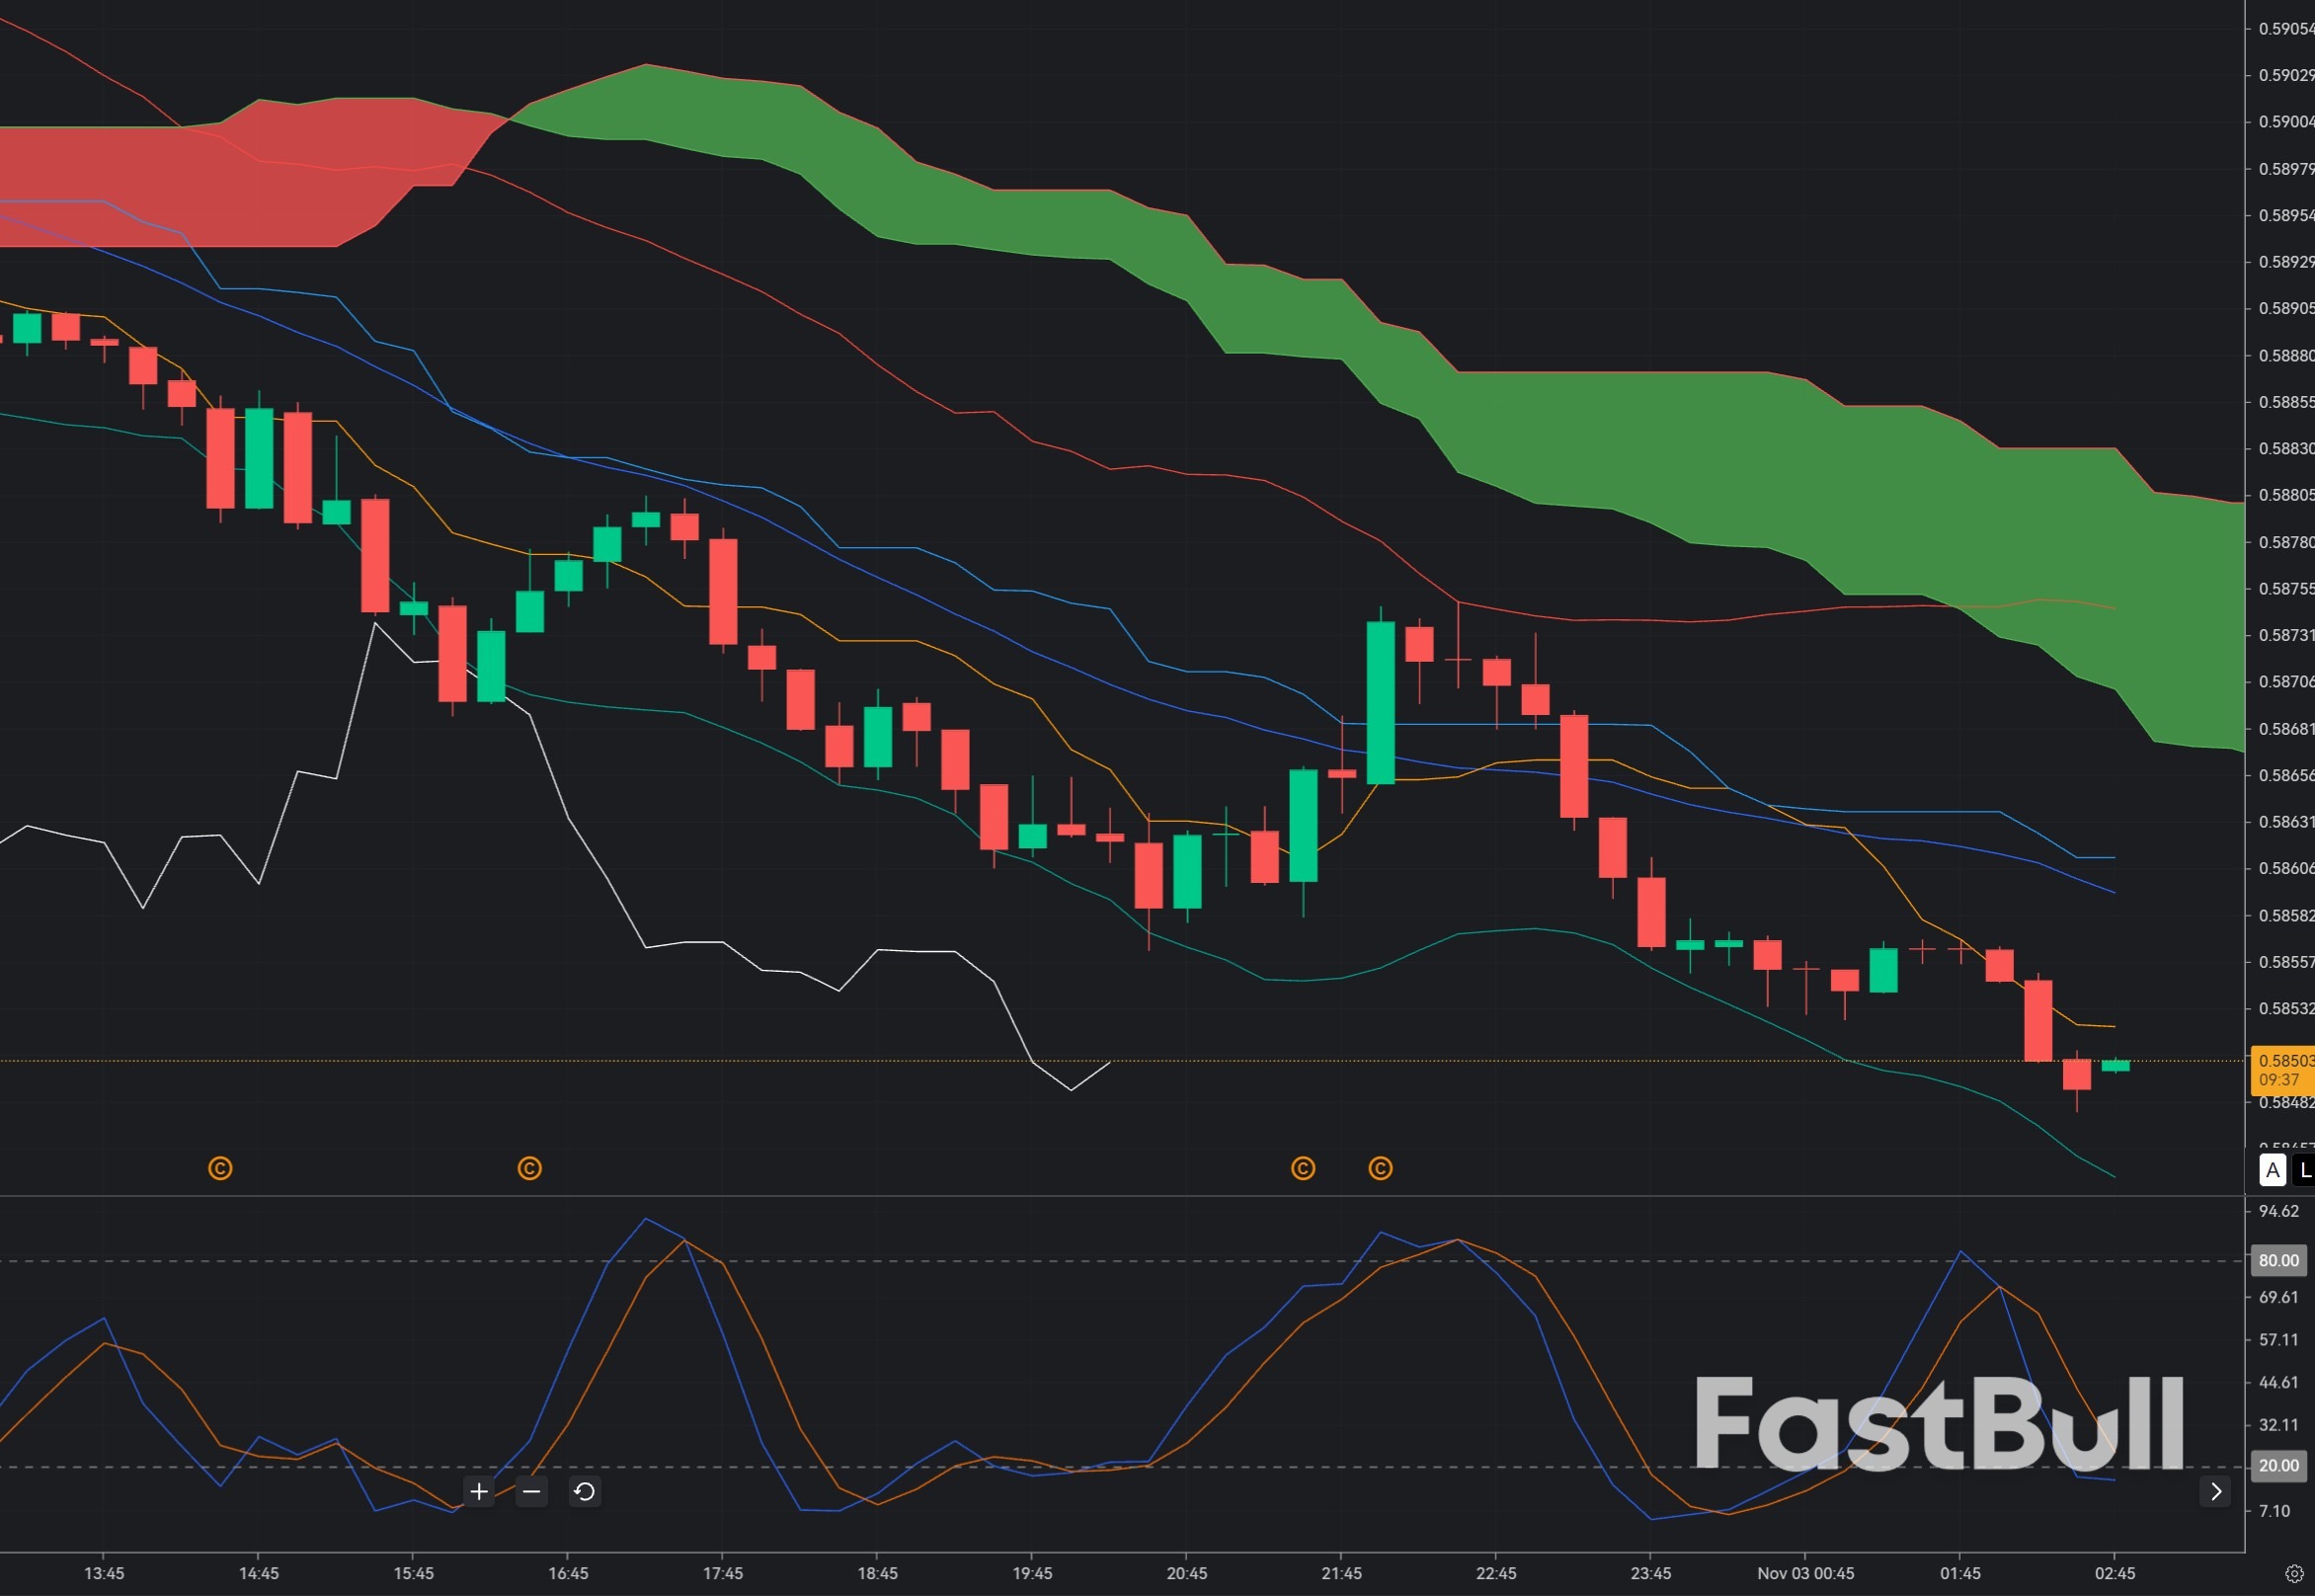
          Bollinger Bands (20,0,2): The preferred setup is a test of the lower Bollinger Band near 0.5850, followed by a candle closing back inside the bands. This would suggest that selling pressure is easing and a mean-reversion move may be developing. A recovery toward the middle band would provide the first upside objective, while a move toward the upper band could support an extension toward 0.5910–0.5919. If the bands expand downward and price repeatedly closes near the lower boundary, the decline is more likely to represent sustained bearish momentum than a temporary oversold condition.
          Ichimoku Kinko Hyo (9,26,52): The Tenkan-sen and Kijun-sen should be monitored for a bullish crossover around support. A recovery above both lines would strengthen the entry, particularly if price subsequently approaches the Ichimoku cloud. If CAD/CHF remains below the cloud while both lines slope downward, the broader intraday structure remains bearish. In that situation, a bounce from 0.5850 should be treated as a countertrend recovery rather than confirmation of a new bullish trend.
          Stochastic (5,3,3): The preferred signal is a bullish crossover below 20, followed by rising momentum while price holds above 0.5850. This combination would suggest that selling pressure is weakening and buyers are beginning to regain control. However, Stochastic can remain oversold during a strong downtrend. A crossover without a corresponding price recovery is therefore insufficient justification for entering a BUY position.
          The combined technical thesis is straightforward: support must hold, momentum must turn upward, and price should recover above nearby resistance. The wider trend provides some support for this approach, but the latest available data does not establish the live M15 readings of your three indicators. These are confirmation conditions rather than claims that the signals have already appeared.

          Trade Recommendation

          Entry: 0.58500
          Take Profit: 0.58900
          Stop Loss: 0.58250
          Risk Warnings and Disclaimers
          You understand and acknowledge that there is a high degree of risk involved in trading. Following any strategies or investment methods may lead to potential losses. The content on the site is provided by our contributors and analysts for information purposes only. You are solely responsible for determining whether any trading assets, securities, strategy, or any other product is suitable for investing based on your own investment objectives and financial situation.
          Add to Favorites
          Share
          FastBull
          Copyright © 2026 FastBull Ltd

          728 RM B 7/F GEE LOK IND BLDG NO 34 HUNG TO RD KWUN TONG KLN HONG KONG

          TelegramInstagramTwitterfacebooklinkedin
          App Store Google Play Android Windows
          Products
          Charts

          Chats

          Q&A with Experts
          Screeners
          Economic Calendar
          Data
          Tools
          Membership
          Features
          Function
          Markets
          Copy Trading
          Latest Signals
          Contests
          24/7
          Analysis
          Education
          Company
          Careers
          About Us
          Contact Us
          Advertising
          Download FastBull
          Help Center
          Feedback
          User Agreement
          Privacy Policy
          Personal Information Protection Statement
          Business

          White Label

          Broker API

          Data API

          Web Plug-ins

          Poster Maker

          Affiliate Program

          Risk Disclosure

          The risk of loss in trading financial instruments such as stocks, FX, commodities, futures, bonds, ETFs and crypto can be substantial. You may sustain a total loss of the funds that you deposit with your broker. Therefore, you should carefully consider whether such trading is suitable for you in light of your circumstances and financial resources.

          No decision to invest should be made without thoroughly conducting due diligence by yourself or consulting with your financial advisors. Our web content might not suit you since we don't know your financial conditions and investment needs. Our financial information might have latency or contain inaccuracy, so you should be fully responsible for any of your trading and investment decisions. The company will not be responsible for your capital loss.

          Without getting permission from the website, you are not allowed to copy the website's graphics, texts, or trademarks. Intellectual property rights in the content or data incorporated into this website belong to its providers and exchange merchants.

          Not Logged In

          Log in to access more features

          Connect Broker
          Become a signal provider
          Help Center
          Customer Service
          Dark Mode
          Price Up/Down Colors

          Log In

          Sign Up

          Position
          Layout
          Fullscreen
          Default to Chart
          The chart page opens by default when you visit fastbull.com