


- GBPUSD
- XAUUSD
- XAGUSD
- WTI
- USDX


行情
分析
用户
快讯
财经日历
学习
数据
- 名称
- 最新值
- 前值










将旧的外汇报价直接套用到数据空白期中,不会产生任何收益,也不会带来新的市场观察结果。两条可复现的价格走势表明,这种做法为何会提高或降低测得的波动率,以及为何成交价格本身无法支撑回测成交价。
外汇价格文件中的一段平坦区域可能表示报价未发生变化,也可能表示某个数据源停止记录。这两种情况属于不同的证据类型。将最后一个可用价格复制到空白行中,虽然可以使文件看起来连续,但并不能确定市场在缺口期间的报价。
填补数据缺口并不总能降低测得的波动率。它可能掩盖价格反转,但也可能将多次渐进式波动合并成一次较大的记录变化。实际问题在于,观测结果是否支持所选的采样间隔和执行假设,而不是最终的电子表格是否得出令人安心的数字。
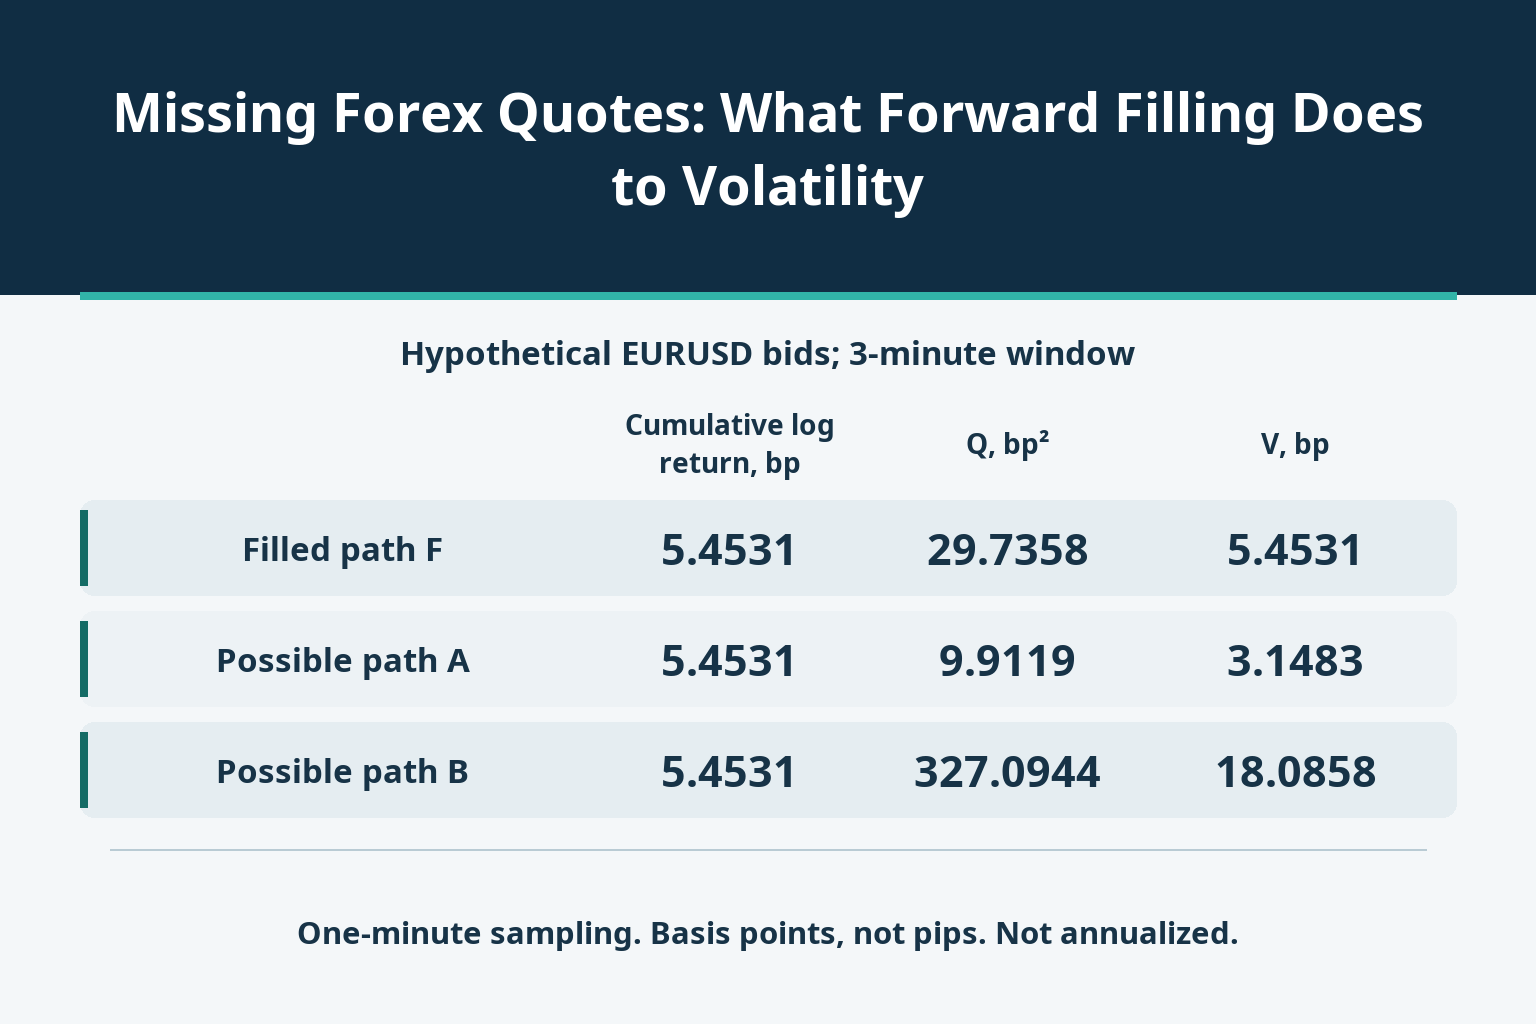
假设一个 EURUSD 文件旨在包含每分钟边界处的有效买价。由于数据采集故障,导致两个边界缺失。前向填充会将最后记录的买价分配给这两个边界。由此产生的收益序列中的零值是该分配的结果;它们并不表明买价保持不变。
另一种情况是,如果事件流能够正常报告报价的变更,并且其完整消息和报价规则表明报价仍然有效,则可以继续保持该状态。同样价格的新记录也可能产生真实的零回报。不要删除所有零值,也不要假设没有新消息就意味着系统不活跃或出现故障。
首先要明确源记录的内容:快照、变动、参考价格、可执行报价或交易。确保交易品种和买价、卖价或中间价的定义保持一致。在判定某个时间段缺失之前,请先核对其预期的时间边界;检查外汇K线的时间窗口和价格定义有助于区分窗口不匹配和真正的记录缺失。
使用假设的欧元/美元报价,以美元/欧元为单位,选取一个UTC日期连续四个分钟边界点。仅保存了12:00的1.1000和12:03的1.1006这两个价格。12:01和12:02的记录丢失。表格显示了已填充的序列F以及两条可能的完整分钟采样路径A和B,这两条路径与已保存的端点一致。
| UTC时间 | 已保存出价 | 填充路径 F | 可能的路径 A | 可能的路径 B |
|---|---|---|---|---|
| 12:00 | 1.1000 | 1.1000 | 1.1000 | 1.1000 |
| 12:01 | 丢失的 | 1.1000 | 1.1002 | 1.1010 |
| 12:02 | 丢失的 | 1.1000 | 1.1004 | 1.0996 |
| 12:03 | 1.1006 | 1.1006 | 1.1006 | 1.1006 |
路径 A 每分钟上涨 2 个点。路径 B 分别上涨 10 个点、下跌 14 个点和上涨 10 个点。路径 F 则分别记录 0 个点、0 个点和上涨 6 个点。此处,欧元兑美元汇率的一个点等于 1 欧元兑 0.0001 美元。这些变化有助于解读价格走势,但点数并非下文波动率计算中使用的百分比收益基点。
A 和 B 都不是恢复的历史数据,也不是连续的逐笔交易路径。它们是特意构建的替代方案,旨在展现两个已保存价格无法识别的信息。它们的共同端点确定了整体价格变动,但并未揭示三个单独的一分钟价格变动。
For each one-minute interval define z_i = 10000 × ln(P_i/P_(i−1)), a log return measured in basis points. For this same three-minute window, calculate Q = Σz_i² and V = √Q. Q is the sampled realized-variance measure in squared basis points; V is its square root in basis points. Neither is annualized. This calculation does not subtract the mean or divide by the number of returns, so it is not the usual sample standard deviation.
| Three-minute path | One-minute log returns, bp | Cumulative log return, bp | Q, bp² | V, bp |
|---|---|---|---|---|
| Filled F | 0; 0; 5.4531 | 5.4531 | 29.7358 | 5.4531 |
| Possible A | 1.8180; 1.8177; 1.8174 | 5.4531 | 9.9119 | 3.1483 |
| Possible B | 9.0868; −12.7238; 9.0901 | 5.4531 | 327.0944 | 18.0858 |
F produces Q = 29.7358, compared with 9.9119 for the gradual path A: filling has made the measured square sum roughly three times as large. Against the reversing path B, whose Q is 327.0944, the same filled series substantially understates it. Since the square root is increasing, the direction of the comparison is the same for V. There is no universal rule that the inserted zeros must lower the whole-window result.
The arithmetic explains why. When several missing log returns are replaced by zeros and one catch-up return, their squared contribution becomes (Σz_i)² rather than Σz_i². The difference is 2Σ_(ij)z_i z_j. Moves in the same direction reinforce one another when combined; opposing moves can cancel. In all three examples, the cumulative log return remains 10000 × ln(1.1006/1.1000) = 5.4531 basis points.
These are comparisons on a specified one-minute grid over three minutes, not claims about the true continuous-time volatility or tomorrow’s risk. A and B are not confidence limits or the highest and lowest possible histories. More unobserved paths remain possible, and assigning equal probabilities to these two examples would add another unsupported assumption.
The same gap can contaminate a trading test. Suppose the valid 12:00 quote is bid 1.1000 and ask 1.1002. A signal to buy 10000 euros arrives at 12:01 without using future information, but its execution quote is missing. The next saved valid quote, at 12:03, is bid 1.1006 and ask 1.1008. For this illustration there are no separate commissions, financing charges or slippage.
A test that simply treats the copied 1.1002 ask as an available entry at 12:01, then exits at the 12:03 bid, reports 10000 × (1.1006−1.1002) = $4 gross profit. The arithmetic is correct; the missing evidence is whether that entry was available at the signal time and for the required quantity. The filled row cannot supply it.
For contrast, explicitly change the model: the signal remains valid until the next saved quote, entry occurs at the 12:03 ask of 1.1008, and the position is immediately closed at the bid of 1.1006. That model produces a $2 gross loss. This is an intentionally different execution rule, not a reconstruction of the actual trade or a lower bound on its result. Both calculations already include the bid/ask difference; subtracting an estimated spread again would double-count it.
A stale timestamp alone does not prove that the old quote had expired, just as copying it does not prove it remained executable. Without a valid execution record or a predefined alternative execution rule, the trade remains unresolved—not a zero-profit observation. Cancelling or delaying a signal also changes the strategy; if it affects later positions, cash or entries, replay those consequences rather than choosing the favorable treatment afterward.
If the two empty rows are deleted, the return from 12:00 to 12:03 is still a three-minute return. It can be correctly reported with that duration, but must not be relabelled as a one-minute observation and mixed into an equal-frequency calculation. Under a strict rule requiring genuine endpoint observations exactly one minute apart, none of the three one-minute returns in this example is available. The answer is missing information, not zero.
Four populated price rows also do not mean four independent observations. Two rows here contain copied values. Conversely, counting only nonzero returns is not a valid count of independent evidence: genuine quotes can repeat and successive returns can be dependent. Report original records, inserted values, gap lengths and coverage separately from statistical sample-size claims.
Filling backward from the next observation, or drawing an interpolated path using that future endpoint, can place information into a historical signal before it was available. Such a curve may be acceptable as a labelled retrospective illustration, but not as an unnoticed live-trading input. Carrying only past information avoids that particular timing error; it still does not make the old price current or executable.
Nor is deleting every incomplete period a neutral cure. If recording failures cluster in difficult market conditions, a complete-record subset can answer a different question from the intended full-period test. Keep the excluded coverage visible and examine how sensitive the conclusion is to the affected periods instead of silently discarding them.
Preserve the raw file. For every sampled value, retain the grid time, original quote time, source identifier, price side and a flag identifying inserted values; keep receipt time when available. The age of the last genuine quote must remain visible. Replacing its timestamp with the new row’s time disguises an old observation as a fresh one.
检查数据源是否正常,消息是否乱序或重复到达,以及是否捕获了报价撤回或状态变更。将已知的非交易窗口与数据采集器故障区别对待。匹配同一交易品种和价格定义内的观测结果;分别传递旧的买价和新的卖价并不会自动生成一致的可执行报价。
在评估性能之前,请先设置允许的引用时长限制并测试其效果。例如,限制为一行已填充的数据并不一定意味着限制为一分钟(在不规则网格上),而且没有一个固定的时长限制能够适用于所有数据源。务必将计时、数据质量和执行检查分开进行:通过其中一项检查并不意味着通过其他检查。
最后,要展示哪些收益和交易依赖于替代,在明确标注的时间段内比较合理的处理方法,并保留未解决的案例。如果声称的波动率水平或策略优势在缺乏支持的缺口处理方法下发生显著变化,则历史数据尚未证实该结论。更平滑的图表和更多的小数位数无法弥补缺失的观测值。

728 RM B 7/F GEE LOK IND BLDG NO 34 HUNG TO RD KWUN TONG KLN HONG KONG


交易股票、货币、商品、期货、债券、基金等金融工具或加密货币属高风险行为,这些风险包括损失您的部分或全部投资金额,所以交易并非适合所有投资者。
做出任何财务决定时,应该进行自己的尽职调查,运用自己的判断力,并咨询合格的顾问。本网站的内容并非直接针对您,我们也未考虑您的财务状况或需求。本网站所含信息不一定是实时提供的,也不一定是准确的。本站提供的价格可能由做市商而非交易所提供。您做出的任何交易或其他财务决定均应完全由您负责,并且您不得依赖通过网站提供的任何信息。我们不对网站中的任何信息提供任何保证,并且对因使用网站中的任何信息而可能造成的任何交易损失不承担任何责任。
未经本站书面许可,禁止使用、存储、复制、展现、修改、传播或分发本网站所含数据。提供本网站所含数据的供应商及交易所保留其所有知识产权。


