行情
新闻
分析
用户
快讯
财经日历
学习
数据
- 名称
- 最新值
- 前值


VIP跟单
所有跟单
所有比赛


法国贸易账 (季调后) (10月)公:--
预: --
欧元区就业人数年率 (季调后) (第三季度)公:--
预: --
加拿大兼职就业人数 (季调后) (11月)公:--
预: --
前: --
加拿大失业率 (季调后) (11月)公:--
预: --
前: --
加拿大全职就业人数 (季调后) (11月)公:--
预: --
前: --
加拿大就业参与率 (季调后) (11月)公:--
预: --
前: --
加拿大就业人数 (季调后) (11月)公:--
预: --
前: --
美国PCE物价指数月率 (9月)公:--
预: --
前: --
美国个人收入月率 (9月)公:--
预: --
前: --
美国核心PCE物价指数月率 (9月)公:--
预: --
前: --
美国PCE物价指数年率 (季调后) (9月)公:--
预: --
前: --
美国核心PCE物价指数年率 (9月)公:--
预: --
前: --
美国个人支出月率 (季调后) (9月)公:--
预: --
美国五至十年期通胀率预期 (12月)公:--
预: --
前: --
美国实际个人消费支出月率 (9月)公:--
预: --
美国当周钻井总数公:--
预: --
前: --
美国当周石油钻井总数公:--
预: --
前: --
美国消费信贷 (季调后) (10月)公:--
预: --
中国大陆外汇储备 (11月)公:--
预: --
前: --
日本贸易账 (10月)公:--
预: --
前: --
日本名义GDP季率修正值 (第三季度)公:--
预: --
前: --
中国大陆进口额年率 (人民币) (11月)公:--
预: --
前: --
中国大陆出口额 (11月)公:--
预: --
前: --
中国大陆进口额 (人民币) (11月)公:--
预: --
前: --
中国大陆贸易账 (人民币) (11月)公:--
预: --
前: --
中国大陆出口额年率 (美元) (11月)公:--
预: --
前: --
中国大陆进口额年率 (美元) (11月)公:--
预: --
前: --
德国工业产出月率 (季调后) (10月)公:--
预: --
欧元区Sentix投资者信心指数 (12月)公:--
预: --
前: --
加拿大全国经济信心指数公:--
预: --
前: --
英国BRC同店零售销售年率 (11月)--
预: --
前: --
英国BRC总体零售销售年率 (11月)--
预: --
前: --
澳大利亚隔夜拆借利率--
预: --
前: --
澳联储利率决议
澳联储主席布洛克召开货币政策新闻发布会
德国出口月率 (季调后) (10月)--
预: --
前: --
美国NFIB小型企业信心指数 (季调后) (11月)--
预: --
前: --
墨西哥12个月通胀年率 (CPI) (11月)--
预: --
前: --
墨西哥核心CPI年率 (11月)--
预: --
前: --
墨西哥PPI年率 (11月)--
预: --
前: --
美国当周红皮书商业零售销售年率--
预: --
前: --
美国JOLTS职位空缺 (季调后) (10月)--
预: --
前: --
中国大陆M1货币供应量年率 (11月)--
预: --
前: --
中国大陆M0货币供应量年率 (11月)--
预: --
前: --
中国大陆M2货币供应量年率 (11月)--
预: --
前: --
美国EIA当年短期前景原油产量预期 (12月)--
预: --
前: --
美国EIA次年天然气产量预期 (12月)--
预: --
前: --
美国EIA次年短期原油产量预期 (12月)--
预: --
前: --
EIA月度短期能源展望报告
美国当周API汽油库存--
预: --
前: --
美国当周API库欣原油库存--
预: --
前: --
美国当周API原油库存--
预: --
前: --
美国当周API精炼油库存--
预: --
前: --
韩国失业率 (季调后) (11月)--
预: --
前: --
日本路透短观非制造业景气判断指数 (12月)--
预: --
前: --
日本路透短观制造业景气判断指数 (12月)--
预: --
前: --
日本国内企业商品价格指数月率 (11月)--
预: --
前: --
日本国内企业商品价格指数年率 (11月)--
预: --
前: --
中国大陆PPI年率 (11月)--
预: --
前: --
中国大陆CPI月率 (11月)--
预: --
前: --
意大利工业产出年率 (季调后) (10月)--
预: --
前: --


无匹配数据
Trump Media and Technology Group (TMTG), the company that owns US President Donald Trump’s Truth Social platform and is partially owned by the president, has received approval from the US Securities and Exchange Commission (SEC) for its registration statement tied to its $2.3 billion Bitcoin treasury deal.
According to a June 13 SEC filing, the agency “declared effective” TMTG’s S-3 registration statement — filed on June 6 — for the Bitcoin (BTC) treasury deal. The S-3 is a form that US companies use to register the sale of various securities, like stocks, options, and different types of debt. TMTG filed a corresponding final prospectus with the SEC on the same day.
Trump Media’s CEO says the firm is “aggressively” expanding
The SEC filing said that, as part of its Bitcoin treasury plan, TMTG registered the resale of approximately 56 million shares and 29 million more tied to convertible notes as part of debt and equity agreements with around 50 investors, which yielded $2.3 billion.
Although the registration statement includes a universal shelf to give TMTG “greater flexibility” for future growth plans, the company currently has “no immediate plans” to issue any securities under it.
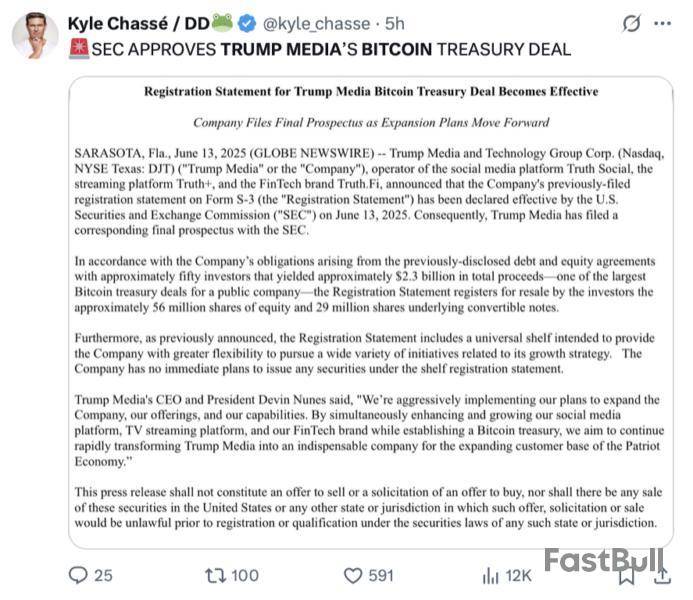
Trump Media’s CEO and President Devin Nunes said, “We’re aggressively implementing our plans to expand the Company, our offerings, and our capabilities.” Nunes added:
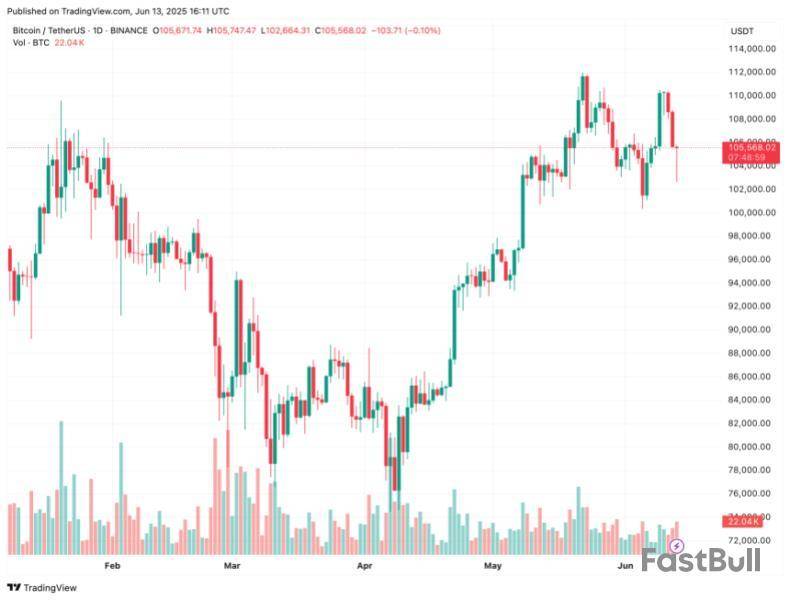
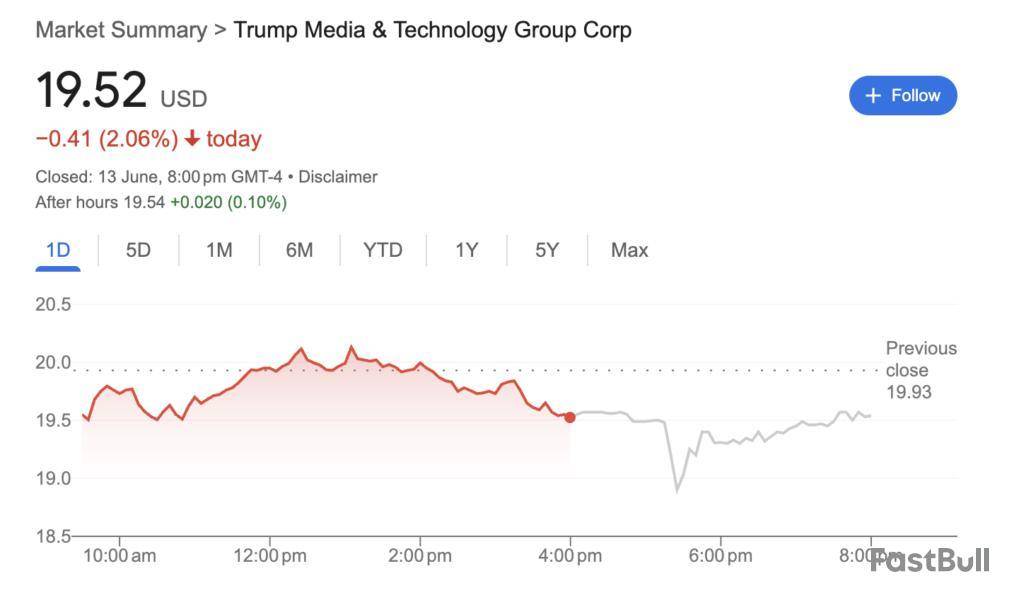
On the same day, TMTG’s stock price fell 2.06%, closing the trading day at $19.52, according to Google Finance data.
It comes only weeks after the company confirmed a $2.5 billion capital raise to purchase Bitcoin on May 27 after denying earlier reports of the deal.
At the time, Nunes said that TMTG views “Bitcoin as an apex instrument of financial freedom, and now Trump Media will hold cryptocurrency as a crucial part of our assets.”
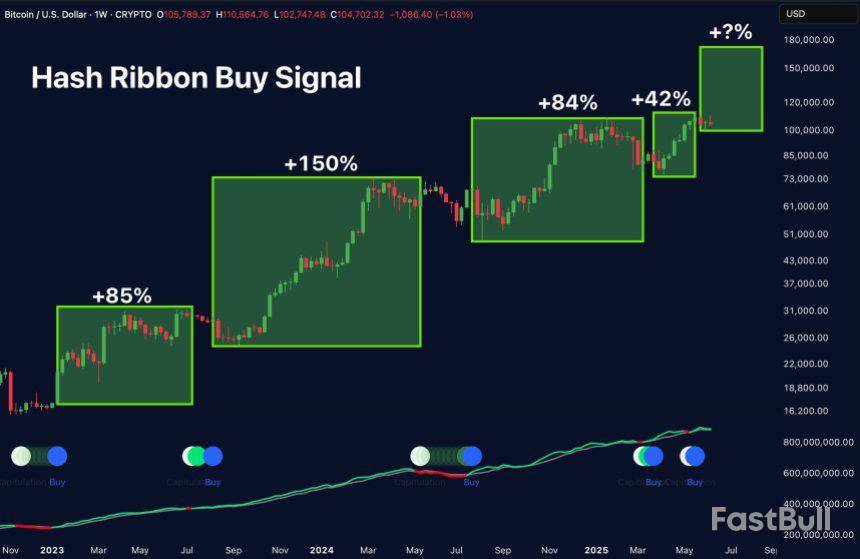
TMTG recently filed to launch a spot Bitcoin ETF
Blockchain analysis company Arkham said in a May 28 X post, “Donald Trump’s company, Trump Media, will buy $2.5 BILLION of Bitcoin. Is Trump about to go Saylor Mode?”
Meanwhile, on June 5, TMTG filed with the SEC to launch a Bitcoin exchange-traded fund (ETF).
“The assets of the Trust consist primarily of Bitcoin held by a custodian on behalf of the Trust. The Trust seeks to reflect generally the performance of the price of Bitcoin,” TMTG said in a June 5 filing.
Bitcoin’s recent rally appears to have paused as the asset declined to just above $104,000 following a 2.1% drop over the past 24 hours. This latest movement signals a potential shift in short-term market momentum, with traders increasingly opting to exit positions.
While the broader cryptocurrency market has experienced similar pullbacks, Bitcoin’s trajectory is attracting closer scrutiny due to its influence on overall sentiment and market structure.
Analysts are looking into how external factors, particularly geopolitical developments, are impacting trading behavior. One such development is the reported military engagement between Israel and Iran on June 13, which triggered sell pressure across high-risk assets, including digital currencies.
Amid these events, key metrics on Binance, particularly Net Taker Volume, are showing increased sell-side dominance, suggesting short-term volatility may continue.
Binance Net Taker Volume Hits Multi-Week Low Amid Bitcoin Panic Selling
According to on-chain analyst Amr Taha on CryptoQuant’s QuickTake platform, Bitcoin’s Net Taker Volume on Binance fell to -$197 million, the most negative reading since June 6.
This metric, which compares aggressive selling to aggressive buying, indicates heightened urgency among traders to sell at market prices, bypassing limit orders. The seven-hour moving average (7HMA) has remained in negative territory since June 12, reinforcing the current downward pressure.
Historically, such extremes in net taker volume have been linked to local price bottoms, as they often signal panic-induced capitulation by retail and overleveraged traders.
Taha highlighted that a similar event occurred on June 6, followed by a 4% rebound in Bitcoin’s price within 24 hours. The implication is that, while aggressive selling may signal weakness, it also presents conditions that have previously preceded price reversals.
Geopolitical Shock Triggers Liquidation Cascade, May Signal Local Bottom
Taha also pointed to the geopolitical backdrop, specifically the sudden escalation between Israel and Iran, as a major catalyst for recent market behavior. News of the strike led to a surge in liquidation activity, especially among long-leveraged positions.
The correlation between the timing of the conflict and the spike in Binance sell volume suggests that traders are reacting to broader market uncertainty, contributing to downward momentum.
Despite this, Taha still views these conditions as potentially bullish in the medium term. Heavy selling often flushes out weaker hands, creating opportunities for long-term holders or institutional participants to accumulate positions at lower prices.
Taha suggests that while the short-term outlook remains volatile, the current setup resembles previous recovery phases, marked by contrarian buying and reduced selling pressure.
Featured image created with DALL-e, Chart from TradingView
Brewing tensions between Israel and Iran have triggered global de-risking across risk-on assets, including Bitcoin (BTC). The top cryptocurrency by market cap is down 1.7% over the past 24 hours. That said, technical indicators still point toward a potential new all-time high (ATH) for BTC in the coming months.
Bitcoin Tracing The ABCD Pattern
According to a recent post on X by crypto analyst Titan of Crypto, BTC appears to be following the ABCD pattern. The analyst noted that Bitcoin is currently trading within a wedge formation and could target as high as $137,000 if it breaks out.
For the uninitiated, the ABCD pattern is a classic chart setup with four points and three legs – AB, BC, and CD – where AB and CD are typically equal in length, and BC serves as the retracement. It helps identify potential reversal zones and signals when a price move may be losing momentum.
Several other technical indicators also point to a potential new ATH for BTC. For instance, crypto analyst Crypto Caesar shared the following 4-hour Bitcoin chart highlighting a bullish double bottom pattern that suggests BTC is primed for recovery.
Fellow crypto commentator Jelle identified a cup and handle pattern on the daily BTC chart. Jelle shared the following chart showing that BTC has already formed the “cup” and is now beginning to shape the “handle,” which typically precedes a sharp upward move.
Meanwhile, crypto trader Merlijn the Trader pointed to the Hash Ribbons – an on-chain indicator historically associated with major rallies. Merlijn shared the following BTC daily chart, noting that the last four appearances of this signal preceded strong Bitcoin uptrends.
To explain, Hash Ribbons is an on-chain indicator that uses Bitcoin’s 30-day and 60-day hash rate moving averages (MA) to spot miner capitulation and recovery. A bullish signal appears when the short-term average crosses above the long-term one.
Are BTC Bears Regaining Ground?
Although BTC remains above the psychologically important $100,000 mark, some concerning signs are beginning to emerge. The cryptocurrency was recently rejected from the $110,000 resistance level again, giving bears temporary control.
Similarly, on-chain data shows that long-term holders are beginning to exit the Bitcoin market which retail investors are starting to join in. Such dynamics are typically observed during the late phase of a bull cycle.
In parallel, short-term holders are showing signs of declining confidence in BTC, as reflected in recent on-chain activity. At the time of writing, BTC trades at $105,568, down 1.7% over the past 24 hours.
Bitcoin’s market price has experienced renewed downward pressure, falling to just under $106,000 in the last 24 hours. This marks a 1.8% dip over the past day and places the asset approximately 6% below its all-time high of over $111,000 reached last month.
While the correction is not severe compared to historical volatility, it highlights ongoing uncertainty in the market as BTC consolidates near record highs without sustained upward momentum.
One metric drawing attention amid this price movement is the Puell Multiple, a tool used to evaluate whether Bitcoin is overvalued or undervalued relative to miner income.
Bitcoin Puell Multiple Suggests Miner Revenues Have Yet to Catch Up
CryptoQuant analyst Gaah highlighted that while prices recently surged above $108,000, the Puell Multiple remains below 1.40, a level typically associated with discounted or non-euphoric market phases.
This decoupling between BTC price and miner revenue offers insight into how recent gains may be more demand-driven than organically supported by on-chain mining fundamentals.
The Puell Multiple measures the daily issuance of BTC in USD terms relative to its 365-day moving average. Historically, readings below 1.0 are seen during market bottoms or accumulation phases, indicating undervaluation.
Gaah points out that current readings hovering around 1.40 suggest miner profitability is still lagging, even as the asset trades near historic highs. This pattern contrasts with previous bull cycles where high prices were often accompanied by elevated miner earnings, driven by both network activity and block rewards.
This disparity may be due in part to the April 2024 Bitcoin halving event, which reduced block rewards from 6.25 BTC to 3.125 BTC per block. While halving events typically drive price appreciation through reduced supply, they simultaneously put downward pressure on miner revenue.
In this case, despite a climb in market price, the halving’s impact continues to suppress income for miners, implying that the price increase has not yet been accompanied by the kind of broader economic expansion that would traditionally drive a full-fledged bull market.
Potential for Continued Growth as Institutional Forces Drive Demand
Gaah also points to the possibility that external factors may be playing a more dominant role in driving recent price action. These include increasing institutional inflows through spot Bitcoin ETFs, as well as a tighter circulating supply as long-term holders reduce active selling.
These forces could be supporting price without necessarily boosting miner profitability in the short term, especially if the uptick is concentrated in secondary market demand rather than new BTC issuance.
The current environment may signal a unique window for participants analyzing Bitcoin’s valuation. A high market price combined with conservative fundamentals suggests the market is not yet in a speculative excess phase.
If miner revenues eventually rise in line with growing demand, driven by either increased transaction fees or broader network usage, it could support further upside. As such, both technical and fundamental indicators may continue to evolve in the coming months, offering a clearer view of whether the current cycle has more room to run.
Featured image created with DALL-E, Chart from TradingView
Short-term holders may face serious repercussions after Shiba Inu recently broke through a crucial support level. SHIB has dropped by almost 3% today and is currently trading at about $0.00001187, well below the crucial technical barrier of $0.00001231, which served as a launching pad for rallies in April and May.
Following several unsuccessful attempts to break above resistance close to the 50-day and 100-day EMAs, which are both presently convergent around $0.0000138-$0.0000140, the market broke through this floor. The asset has sunk so far into bearish territory that the 200-day EMA, which is situated further above at $0.00001546, has remained unchanged for weeks. The volume of this breakdown spike is also concerning because there is not any obvious buying support to intervene, leaving SHIB open to further declines. Chart by TradingView">
The RSI at 32.79 indicates that the token is almost oversold, but it is too soon to consider this a dip-buying opportunity in the absence of any obvious reversal signals. As of right now, investors should not anticipate a recovery rally unless SHIB can swiftly and heavily retake the $0.0000123 zone.
If not, momentum will probably push the asset lower toward the psychological $0.00001000 level, which is a significant round number and the last line of defense before panic-selling gets worse. The general sentiment of the market exacerbates the situation. In times of declining risk appetite, meme-based assets like SHIB are typically the first to be dumped. It is reasonable to anticipate further declines or at most stagnation unless there is an unexpected catalyst (a burn event, whale movement or integration news, for example).
Bitcoin's direct hit
Following a textbook recovery, all eyes are on what will happen next with Bitcoin . Directly off the 50-day EMA, Bitcoin experienced a rapid reversal back toward $105,000, following a precipitous decline to $102,816. Such a response at a crucial technical support level indicates the existence of aggressive interest in dip buying as well as potentially algorithmic activity in the vicinity of moving averages.
The action was taken shortly after a significant liquidation cascade that we previously reported on, which consisted of a series of lengthy liquidations that went above and beyond expectations and cleared out overly leveraged positions. As the sell pressure subsided and buyers intervened at support, that aggressive flush set the stage for a countermove. One factor, though, cannot be disregarded: descending volume. The volume did not rise proportionately to the strong candle recovery.
Bulls' lack of conviction could indicate that this is a temporary relief bounce rather than a return to the trend. It makes sense that market participants would be cautious. Although there may still be room to run without crossing overbought territory, the RSI, which is currently at 53.75, indicates that momentum is not as strong as it was when Bitcoin tested its all-time high of $112,000 in early June.
That level is still the main psychological barrier, and a retest might take longer to occur if there is not a clear trigger. In the short term, bulls are likely to keep control if Bitcoin stays above the 50 EMA (~$103,000) and does not fall below $102,000. The 100-day EMA may provide the next line of defense if risk shifts back toward $98,000.
XRP's last chance
Even though XRP is holding onto its last line of defense, bulls may need it to engineer a dramatic reversal. The asset has retreated toward the 200-day moving average, which now serves as a crucial turning point for any possible recovery and is currently trading close to $2.14. Despite recent rejection in the $2.40-2.50 range, XRP has not yet made a clear break.
Moving averages, especially the 50, 100 and 200-day EMAs, are converging and compressing the price into a tight structure, indicating that a high-volatility move may be imminent. Red candles notwithstanding, this consolidation might be a traditional springboard configuration. Since the RSI is still neutral at about 45, neither side has yet to experience severe exhaustion.
A bounce toward $2.60 and ultimately a retest of $3 is still possible if bulls defend the 200 EMA and the price stays above $2.09. But at the moment, bears are gaining momentum. Over the past few sessions, the volume has been decreasing, suggesting that neither side is very convinced. On a red day, if volume increases and XRP closes below the 200 EMA, a steeper sell-off toward $1.85 or less is probably in store.
However, for traders and long-term investors, considering an entry this might be a unique chance. As there is currently no structural breakdown and a slow bleed into key support, the current setup is similar to past XRP price action that has preceded significant reversals.
Whales are increasingly turning to TRON for moving USDT, with on-chain data showing a record $694.54 billion in transfers during May. Nearly 60% of these transfers came from transactions over $1 million.
At the same time, USDT supply on TRON has increased by $21 billion in just six months, marking a 36% growth. With the US Treasury forecasting a $2 trillion stablecoin market by 2028, TRON’s rapid growth signals a major shift in how digital dollars move across the crypto ecosystem.
Whales Fuel Stablecoin Boom on TRON
Stablecoins are quickly gaining traction as a cornerstone of crypto adoption, with both on-chain activity and institutional interest reinforcing their growing influence.
According to CryptoQuant’s JA Maartunn:
“Stablecoins are becoming a key part of crypto adoption, a trend also seen by Circle’s recent IPO. On-chain data also shows that whales are actively using stablecoins! The chart below shows the total monthly USDT transferred on TRON. In May, it hit an all-time high: $694.54 billion. ~59% of that volume came from transactions over $1 million, totaling $411.2 billion in large transfers alone.”
This surge cements TRON’s role as the leading USDT transfer network and shows how stablecoins have become essential for large-value transactions and institutional capital flows.
At the same time, long-term projections are just as bullish.
The US Treasury forecasts that the stablecoin market could reach a $2 trillion market cap by 2028, fueled by rising institutional demand, the tokenization of real-world assets, and broader payment integrations.
TRX Benefits from Increasing Stablecoin Supply on the Network
Tron’s explosive growth in transaction volume and stablecoin activity is redefining its role in the crypto ecosystem.
In May 2025, “the Tron network’s native token, TRX, achieved a new all-time high (ATH) in monthly transfer volume,” reaching 490.3 billion tokens moved, equivalent to $121.2 billion USD at the time, according to CryptoQuant.
That lead became even more pronounced in 2025, as TRON officially surpassed Ethereum in total USDT supply and daily transactions.
That number has since climbed further, surging from $58 billion to $79 billion—an astounding 36% increase in just the first half of the year.
With over 2.4 million daily USDT transfers and $23.7 billion in daily volume, TRON is appearing as the most preferred network for stablecoin payments worldwide.
交易股票、货币、商品、期货、债券、基金等金融工具或加密货币属高风险行为,这些风险包括损失您的部分或全部投资金额,所以交易并非适合所有投资者。
做出任何财务决定时,应该进行自己的尽职调查,运用自己的判断力,并咨询合格的顾问。本网站的内容并非直接针对您,我们也未考虑您的财务状况或需求。本网站所含信息不一定是实时提供的,也不一定是准确的。本站提供的价格可能由做市商而非交易所提供。您做出的任何交易或其他财务决定均应完全由您负责,并且您不得依赖通过网站提供的任何信息。我们不对网站中的任何信息提供任何保证,并且对因使用网站中的任何信息而可能造成的任何交易损失不承担任何责任。
未经本站书面许可,禁止使用、存储、复制、展现、修改、传播或分发本网站所含数据。提供本网站所含数据的供应商及交易所保留其所有知识产权。