行情
新闻
分析
用户
快讯
财经日历
学习
数据
- 名称
- 最新值
- 前值


VIP跟单
所有跟单
所有比赛


法国工业产出月率 (季调后) (10月)公:--
预: --
法国贸易账 (季调后) (10月)公:--
预: --
欧元区就业人数年率 (季调后) (第三季度)公:--
预: --
加拿大兼职就业人数 (季调后) (11月)公:--
预: --
前: --
加拿大失业率 (季调后) (11月)公:--
预: --
前: --
加拿大全职就业人数 (季调后) (11月)公:--
预: --
前: --
加拿大就业参与率 (季调后) (11月)公:--
预: --
前: --
加拿大就业人数 (季调后) (11月)公:--
预: --
前: --
美国PCE物价指数月率 (9月)公:--
预: --
前: --
美国个人收入月率 (9月)公:--
预: --
前: --
美国核心PCE物价指数月率 (9月)公:--
预: --
前: --
美国PCE物价指数年率 (季调后) (9月)公:--
预: --
前: --
美国核心PCE物价指数年率 (9月)公:--
预: --
前: --
美国个人支出月率 (季调后) (9月)公:--
预: --
美国五至十年期通胀率预期 (12月)公:--
预: --
前: --
美国实际个人消费支出月率 (9月)公:--
预: --
美国当周钻井总数公:--
预: --
前: --
美国当周石油钻井总数公:--
预: --
前: --
美国消费信贷 (季调后) (10月)公:--
预: --
中国大陆外汇储备 (11月)公:--
预: --
前: --
日本贸易账 (10月)公:--
预: --
前: --
日本名义GDP季率修正值 (第三季度)公:--
预: --
前: --
中国大陆进口额年率 (人民币) (11月)公:--
预: --
前: --
中国大陆出口额 (11月)公:--
预: --
前: --
中国大陆进口额 (人民币) (11月)公:--
预: --
前: --
中国大陆贸易账 (人民币) (11月)公:--
预: --
前: --
中国大陆出口额年率 (美元) (11月)公:--
预: --
前: --
中国大陆进口额年率 (美元) (11月)公:--
预: --
前: --
德国工业产出月率 (季调后) (10月)公:--
预: --
欧元区Sentix投资者信心指数 (12月)公:--
预: --
前: --
加拿大全国经济信心指数--
预: --
前: --
英国BRC同店零售销售年率 (11月)--
预: --
前: --
英国BRC总体零售销售年率 (11月)--
预: --
前: --
澳大利亚隔夜拆借利率--
预: --
前: --
澳联储利率决议
澳联储主席布洛克召开货币政策新闻发布会
德国出口月率 (季调后) (10月)--
预: --
前: --
美国NFIB小型企业信心指数 (季调后) (11月)--
预: --
前: --
墨西哥12个月通胀年率 (CPI) (11月)--
预: --
前: --
墨西哥核心CPI年率 (11月)--
预: --
前: --
墨西哥PPI年率 (11月)--
预: --
前: --
美国当周红皮书商业零售销售年率--
预: --
前: --
美国JOLTS职位空缺 (季调后) (10月)--
预: --
前: --
中国大陆M1货币供应量年率 (11月)--
预: --
前: --
中国大陆M0货币供应量年率 (11月)--
预: --
前: --
中国大陆M2货币供应量年率 (11月)--
预: --
前: --
美国EIA当年短期前景原油产量预期 (12月)--
预: --
前: --
美国EIA次年天然气产量预期 (12月)--
预: --
前: --
美国EIA次年短期原油产量预期 (12月)--
预: --
前: --
EIA月度短期能源展望报告
美国当周API汽油库存--
预: --
前: --
美国当周API库欣原油库存--
预: --
前: --
美国当周API原油库存--
预: --
前: --
美国当周API精炼油库存--
预: --
前: --
韩国失业率 (季调后) (11月)--
预: --
前: --
日本路透短观非制造业景气判断指数 (12月)--
预: --
前: --
日本路透短观制造业景气判断指数 (12月)--
预: --
前: --
日本国内企业商品价格指数月率 (11月)--
预: --
前: --
日本国内企业商品价格指数年率 (11月)--
预: --
前: --
中国大陆PPI年率 (11月)--
预: --
前: --


无匹配数据
Bitcoin investors are currently holding an estimated $1.2 trillion in unrealized profits, according to on-chain analytics platform Glassnode.
This significant figure highlights the paper gains accumulated by long-term holders as Bitcoin continues to trade close to its record highs.
Bitcoin Investor Base Shifts From Traders to Long-Term Institutional Allocators
Glassnode data reveals that the average unrealized profit per investor stands at around 125%, which is lower than the 180% seen in March 2024, when the BTC price reached a peak of $73,000.
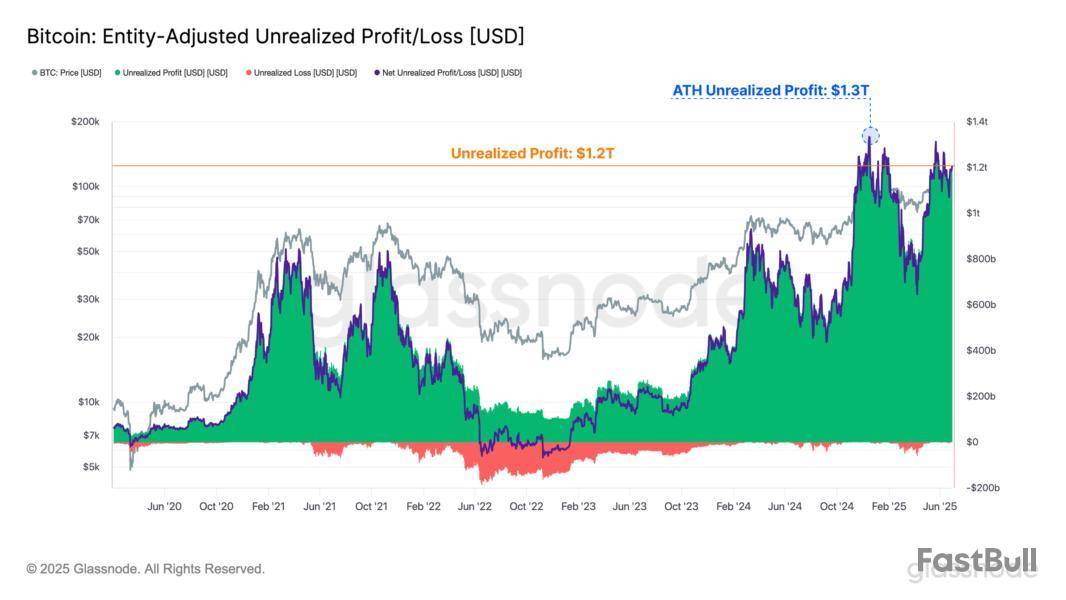
However, despite these massive unrealized gains, investor behavior suggests no major rush to sell the top crypto. BeInCrypto previously reported that daily realized profits have remained relatively subdued, averaging just $872 million.
This starkly contrasts previous price surges, when realized gains surged to between $2.8 billion and $3.2 billion at BTC price points of $73,000 and $107,000, respectively.
Moreover, current market sentiment suggests that investors are waiting for a more decisive price movement before adjusting their upward or downward positions. The trend points to firm conviction among long-term holders, with accumulation continuing to outweigh selling pressure.
“This underscores that HODLing remains the dominant market behavior amongst investors, with accumulation and maturation flows significantly outweighing distribution pressures,” Glassnode stated.
Meanwhile, Bitcoin analyst Rezo noted that the current trend reflects a fundamental shift in the significantly evolved profile of Bitcoin holders. According to him, the typical BTC holder has shifted from short-term speculative traders to long-term institutional investors and allocators.
Rezo pointed to the increasing influence of institutional players such as ETFs and public companies like Strategy (formerly MicroStrategy).
“The holder base has changed – from traders seeking exit to allocators seeking exposure. MicroStrategy, sitting on tens of billions in unrealized gains, keeps adding. ETFs = constant bid, not swing traders,” he said.
Notably, public companies like Strategy increased their Bitcoin holdings by 18% in Q2, while ETF exposure to Bitcoin climbed by 8% in the same period.
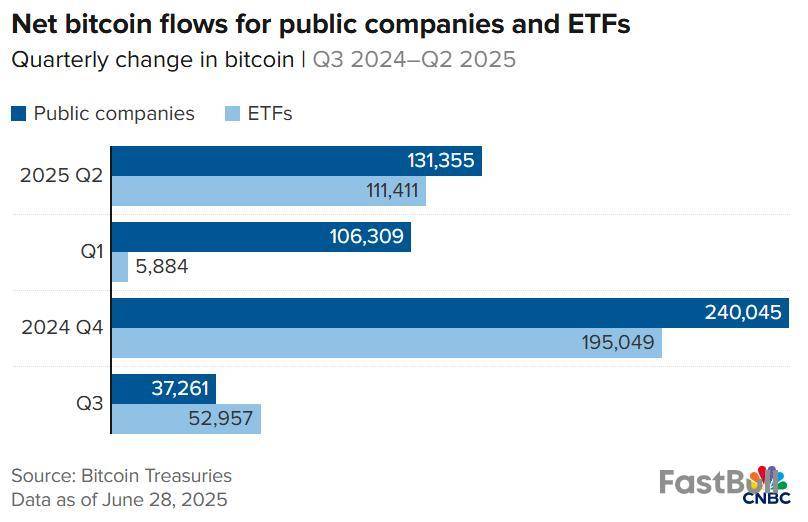
Considering this, Rezo concluded that most short-term sellers likely exited between $70,000 and $100,000. He added that what remains are investors who treat Bitcoin less as a speculative trade and more as a strategic long-term allocation.
Bitcoin prices dipped by 0.93% in the last day after the premier cryptocurrency suffered another price rejection in the $110,000 range. This latest price pullback forces Bitcoin to maintain a consolidatory movement that has dominated the majority of last month drawing speculations about a potential market top. Interestingly, prominent market analyst Ted Pillows has weighed in on this discourse stating that historical data shows that Bitcoin is yet to achieve a peak price for the current market cycle.
Bitcoin’s Consolidation: A Preparation For Final Bull Leg
In an X post on July 4, Ted Pillows shares a bullish market insight following another Bitcoin price dip. Notably, the premier cryptocurrency seemed on course to resume its market uptrend after a significant price rebound from $99,000 in late June following weeks of downward consolidatory movement. However, another decisive rejection in the $110,000 indicates Bitcoin’s prices remain range-bound thereby worsening investors’ concern across the market. In interpreting this situation, Pillows has called for calm stating the recent price dip is merely a “leverage flush” that requires no panic. Using a visual study on the BTC weekly chart, the renowned analyst shows that the current and previous price pullbacks are part of a predictable pattern that has played out across previous Bitcoin cycles.
The chart shows that after each halving event, Bitcoin tends to peak approximately 18 months (518 days) later. With the most recent halving occurring in mid April 2024, the expected peak for this cycle would fall somewhere around Q4 2025, specifically on October 13, 2025, consistent with historical performance. Furthermore, a recurring 140-day rally window is also depicted in the chart, usually forming the final leg of the bull run. In each previous cycle, this 10-bar stretch delivered parabolic price movements. If history is rhyming once again, Bitcoin is now within range of initiating this 10-week bull run, suggesting the equivalent rally seen in previous could soon kick in.
How High Can Bitcoin Price Go?
Based on Pillows’ recent analysis, Bitcoin may be gathering momentum for its final rally of the present market cycle. The extent of this anticipated uptrend remains unknown; however, the presence of bullish factors most notably the high influx of institutional investment and the US pro-crypto policies supports a range of sky scraping targets. For example, Pillows has previously shared that the popular stock-to-flow model which uses Bitcoin’s scarcity to project long-term price trajectory has predicted a potential price target of $368,925 by 2025 end. If this prediction holds true, Bitcoin investors are eyeing an estimated 242% from current market prices. At press time, Bitcoin continues to trade at $108,299 reflecting a 0.83% gain in the past week.
As the second half of 2025 begins, Bitcoin is showing decreased volatility and logging fewer monthly transactions, as its U.S.-based spot ETFs near $50 billion in cumulative net inflows.
Bitcoin's "at-the-market" implied volatility, a measure of how volatile Bitcoin is expected to trade across timespans ranging from seven days to six months, has fallen in July to its lowest levels since October, 2023, when Bitcoin traded around a third of its current value, according to data from The Block.
Alongside the decrease in volatility, monthly transactions on the Bitcoin network fell by 15% in June compared to May, The Block's data shows, logging the fewest monthly transactions since October, 2023. Transaction activity has seen notable lows in recent weeks, with some abnormally low-fee transactions even being scooped up by miners looking deep in the mempool for transactions to add to blocks.
As transaction activity on the network falls, Wall Street's demand for BTC has only increased, with U.S. spot Bitcoin ETFs continually logging new cumulative inflow records. The funds logged over $1 billion in inflows over two days last week, bringing the cumulative total net inflow to just below $50 billion. The funds hold around $137.6 billion worth of BTC in total, a new all-time high, according to SoSoValue data.
Publicly-listed companies also bought BTC in June—around 65,000 BTC, worth about $7 billion at current prices, according to data from BitcoinTreasuries. A Glassnode analysis in June found that, though Bitcoin's onchain activity is a 'ghost town,' the increase in transactions from high net worth agents signals institutions and whales are becoming more dominant on the network.
A decrease in Bitcoin futures volume could also signal a summer slump for the world's largest cryptocurrency, The Block recently reported.
Disclaimer: The Block is an independent media outlet that delivers news, research, and data. As of November 2023, Foresight Ventures is a majority investor of The Block. Foresight Ventures invests in other companies in the crypto space. Crypto exchange Bitget is an anchor LP for Foresight Ventures. The Block continues to operate independently to deliver objective, impactful, and timely information about the crypto industry. Here are our current financial disclosures.
© 2025 The Block. All Rights Reserved. This article is provided for informational purposes only. It is not offered or intended to be used as legal, tax, investment, financial, or other advice.
In a recent X post, CryptoWzrd highlighted that Litecoin (LTC) closed the day on a slightly bearish note. He explained that LTC’s price action remains closely tied to Bitcoin’s movement and overall market sentiment, with the $96 level standing out as the next resistance.
Bearish Daily Close For Litecoin Amid Bitcoin Correlation
According to CryptoWzrd, Litecoin closed the day with a bearish daily candle, while mirroring Bitcoin’s price action. This alignment suggests that LTC remains heavily influenced by broader market sentiment and BTC’s directional moves. Meanwhile, the LTCBTC pair ended the session indecisively, offering no clear signal of strength or weakness against Bitcoin at the moment.
The analyst noted that for a sustained upside move in Litecoin, healthier and more constructive candles are needed on the LTCBTC chart. Without stronger signals from this pair, confidence in a breakout remains limited. Adding to the cautious tone, CryptoWzrd pointed out that a decline in Bitcoin dominance would be a critical factor in unlocking altcoin momentum, including for Litecoin.
From a technical standpoint, Litecoin is currently aiming for the $96 daily resistance level. CryptoWzrd explained that a successful push above this barrier could open the door for a stronger rally, potentially extending toward the $128 resistance zone. However, that scenario depends on supportive market conditions and renewed strength across altcoin charts.
On the downside, $80 stands out as the key daily support level that traders should monitor. A breakdown below this zone could trigger a deeper correction and delay any near-term bullish ambitions. Maintaining support above this level would be crucial in preserving the broader structure and keeping upward targets in play.
Looking ahead, CryptoWzrd emphasized his focus on the lower time frames to spot potential scalp opportunities. By analyzing intraday chart formations, he aims to capitalize on short-term price movements while the broader market context unfolds. Traders following LTC closely will want to keep an eye on these short-term setups for quick entries and exits amid ongoing volatility.
Intraday Volatility Signals Patience Over Action
In conclusion, CryptoWzrd noted that today’s intraday chart for Litecoin was marked by volatility and a bearish tone, making it a challenging environment for clean trade setups. He emphasized the importance of waiting for a more favorable trading location before entering any positions, as the current conditions lacked clear direction and structure.
According to the analyst, a move above the $90 intraday resistance would be a positive signal and could present a potential long opportunity. However, if the price gets rejected at that level, it may lead to further downside pressure. For now, CryptoWzrd remains patient, waiting for the market to establish a healthier setup before taking action.
Michael Saylor, a vocal Bitcoin advocate and the executive chairman of Bitcoin treasury company Strategy, has published a tweet about Bitcoin, featuring an old-school fighting computer game.
The screenshot he shared shows a made-up game similar to The Mortal Kombat or Sango Fighter, but the players are called Strategy and Metaplanet, represented by these companies’ chiefs – Michael Saylor vs. Simon Gerovich. Strategy’s HP metric totals 597,325, and Mateplanet’s is 13,350, respectively – the amounts of Bitcoin held by these BTC treasury companies.
Michael Saylor@saylorJul 05, 2025If you’re going to fight, fight for Bitcoin. pic.twitter.com/LP61sKZVeG
Saylor tweeted: “If you’re going to fight, fight for Bitcoin.” Earlier, this image was published by Metaplanet’s Gerovich, which is posted as a response to Saylor’s comment.
On that day, Saylor tweeted that Metaplanet should get to the second spot among Bitcoin treasury companies by the size of BTC holdings, “and then we fight,” Saylor jestingly stated. Gerovich published this image to illustrate a hypothetical event where Bitcoin bags will be used for fighting, not fists or other weapons.
Both Strategy and Metaplanet announced new Bitcoin purchases on Monday. Strategy bought 4,980 BTC worth more than half a billion dollars, while Metaplanet announced the accumulation of 1,005 BTC bought for roughly $108.1 million.
Over the past 24 hours, the bellwether cryptocurrency, Bitcoin, went down by less than 1%, falling from $108,925 to the $108,100 zone. On Thursday, BTC lost the $110,000 price level.
交易股票、货币、商品、期货、债券、基金等金融工具或加密货币属高风险行为,这些风险包括损失您的部分或全部投资金额,所以交易并非适合所有投资者。
做出任何财务决定时,应该进行自己的尽职调查,运用自己的判断力,并咨询合格的顾问。本网站的内容并非直接针对您,我们也未考虑您的财务状况或需求。本网站所含信息不一定是实时提供的,也不一定是准确的。本站提供的价格可能由做市商而非交易所提供。您做出的任何交易或其他财务决定均应完全由您负责,并且您不得依赖通过网站提供的任何信息。我们不对网站中的任何信息提供任何保证,并且对因使用网站中的任何信息而可能造成的任何交易损失不承担任何责任。
未经本站书面许可,禁止使用、存储、复制、展现、修改、传播或分发本网站所含数据。提供本网站所含数据的供应商及交易所保留其所有知识产权。