


Daily Technical Analysis: [18 MAY]
1. GBP/USD Analysis:
News Summary:
The selloff in U.K. assets was driven not only by external factors — including the lack of improvement in the Iran situation last week, which pushed oil prices sharply higher again and intensified market concerns over inflation, triggering a broad rise in global bond yields — but also by growing domestic political uncertainty in the United Kingdom. Investors are increasingly concerned that potential changes in fiscal policy under a successor to Prime Minister Keir Starmer could further complicate the country’s economic outlook. From a medium- to long-term perspective, the U.K.’s fiscal challenges and persistent inflation pressures may limit the upside potential for British assets.
Trend Analysis:
On the H4 chart, we can see GBP/USD continues to trend lower and remains below the 48 hours moving average. Meanwhile, the MACD double line and energy bars are gradually converging below the zero axis. The buy limit could be placed, stop loss is necessary.
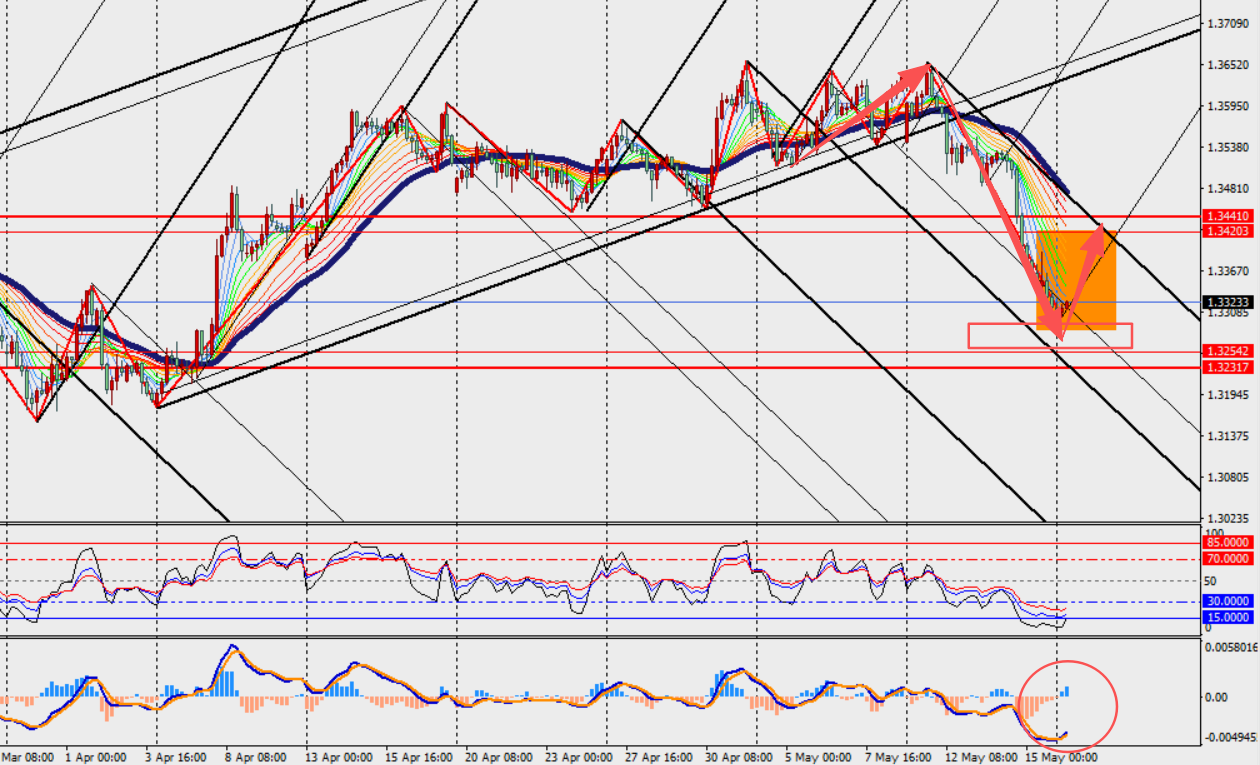
Today's Key Price Levels:
Key Support Levels: [1.3270]
Key Resistance Levels: [1.3440]
Pivot Points [1.3300]
2. Gold Analysis:
News Summary:
Gold prices plunged nearly 4%, briefly falling below the $4,500 level, as a stronger U.S. dollar, surging Treasury yields, and escalating tensions in the Middle East weighed heavily on the precious metals market. Rising oil prices have intensified inflation concerns, significantly boosting market expectations for further Federal Reserve rate hikes, which in turn pressured non-yielding gold. Wall Street institutions are generally bearish on gold’s near-term outlook, while retail investors remain relatively optimistic. This week’s key focus will be whether the ongoing Middle East conflict continues to drive inflation expectations higher.
Trend Analysis:
We can see gold on the H4 chart remains in a sustained pullback and continues to trade below the 48 hours moving average. However, the MACD double line and histogram bars have started to form a bullish crossover and expand below the zero axis. The buy limit could be set, stop loss is mandatory.
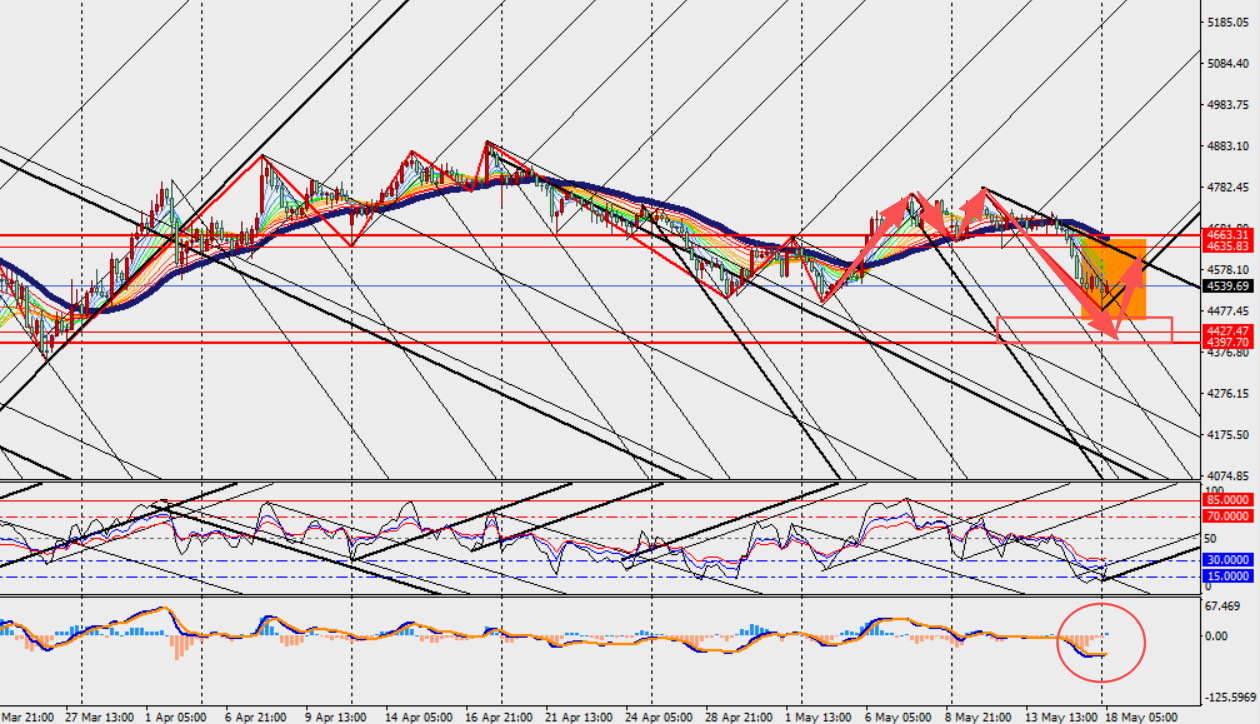
Today's Key Price Levels:
Key Support Levels: [4500]
Key Resistance Levels: [4640]
Pivot Points [4510]


Copyright © 2026 FastBull Ltd


风险提示
外汇交易具有很高的风险,可能并不适合所有投资者。杠杆可能会造成额外的损失风险。在决定参与外汇交易商之前,请仔细考虑您的投资目标、经验水平和风险承受能力。您可能会损失部分或全部初始投资,真诚的建议您,不要投资承受不起的风险交易。请经常提醒自己参与外汇交易的风险,如果有任何疑问,请咨询独立的财务或税务顾问。我们提供的任何数据和信息,均来自交易商和各国外汇监管机构的官方数据,仅出于提供信息的目的,不作为交易建议。另外,过去的表现并不预示未来的结果。
免责声明
本网站所含数据未必实时、准确。本网站的数据和价格未必由市场或交易所提供,而可能由做市商提供,所以价格可能并不准确且可能与实际市场价格行情存在差异。即该价格仅为指示性价格,反映行情走势,不宜为交易目的使用。对于您因交易行为或依赖本网站所含信息所导致的任何损失,本网站所含数据的提供商不承担责任。