


How to Use Stochastic Oscillator in Forex Trading

The stochastic oscillator, also known as stochastic indicator, is a very popular technical analysis tool, available on almost all trading platforms and used by many traders all over the world. However, the Stochastic Oscillator, like many other indicators of this type, tends to give false signals that need filtering. In this article, we will help you understand the indicator and discuss several trading strategies using the Stochastic and single out their advantages and drawbacks.
What Is Stochastic Oscillator
The stochastic oscillator is a momentum indicator that is widely used in forex trading to pinpoint potential trend reversals. It was developed by George C. Lane in the late 1950’s and can can help you to determine overbought or oversold of the currency pair. The idea behind the Stochastic is that in an uptrend each next timeframe tends to close near the previous highs, while in a downtrend, they close near the preceding lows.
The charted stochastic oscillator actually consists of two lines: the indicator itself is represented by %K, and a signal line reflecting the three-day simple moving average (SMA) of %K, which is called %D. The %K determines where the price closed in relation to a range of candlesticks.
For example, a reading above 80 implies that the current closing price is near the highest high of the range, and a reading below 20 puts the closing price near the lowest low of the range. The second line, %D, is estimated by smoothing %K. Simply put, it is the 3-period simple moving average of %K.
How to Use Stochastic Oscillator in Trading
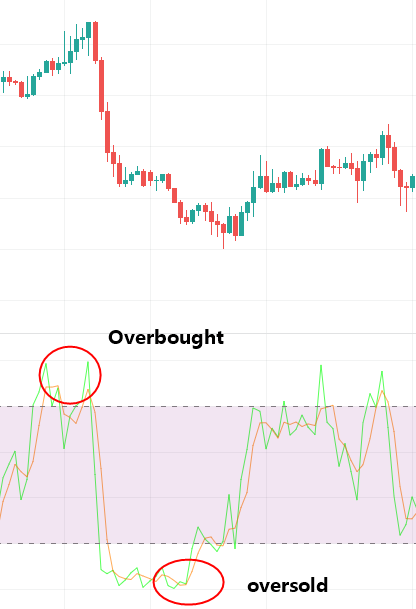
1. Generate overbought and oversold signals
Like other range-bound momentum oscillators, such as the relative strength index (RSI) and Williams %R, the stochastic oscillator is also useful for determining overbought or oversold conditions.
The Stochastic is scaled from 0 to 100. The area between 20% and 0% is the oversold area, while the zone between 80% and 100% is the overbought area. When the price reaches the oversold area, it means that it can fall no more, so a pullback or reversal will follow. When the price reaches the overbought area, it means that it can grow no more, so a pullback or reversal will follow.
2. Stochastic crossover
The stochastic crossover is another popular strategy used by traders. This occurs when the two lines cross in an overbought or oversold region.
When an increasing %K line crosses above the %D line in an oversold region, it is generating a buy signal. When a decreasing %K line crosses below the %D line in an overbought region, this is a sell signal.
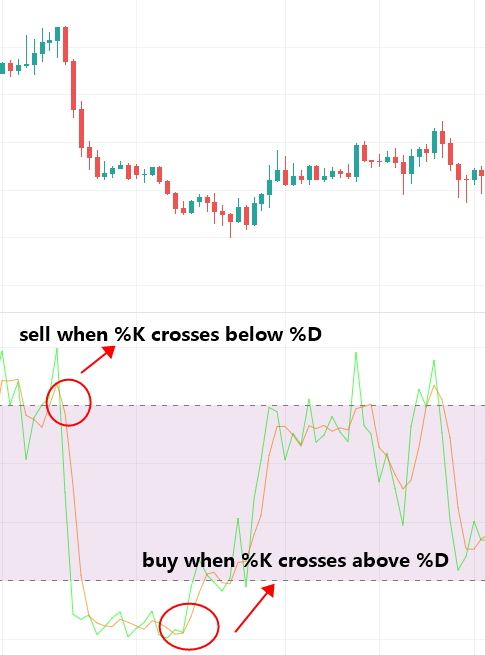
This is the simplest way of using the Stochastic indicator but its drawback is the abundance of false signals, especially when the price is following the trend while the signal is against it. Always keep in mind that the Stochastic is efficient in a flat and should be used alongside other market analysis instruments.
3. Stochastic divergence strategy
Another popular trading strategy using the stochastic indicator is a divergence strategy. In this strategy, traders will look to see if an instrument’s price is making new highs or lows, while the stochastic indicator isn’t. This can signal that the trend may be about to reverse.
A bullish divergence occurs when the price records a lower low, but the stochastic oscillator forms a higher low. This shows that there is less downward momentum and could indicate a bullish reversal. A bearish divergence forms when the market price reaches higher highs, but the stochastic oscillator forms a lower high – this indicates declining upward momentum and a bearish reversal.
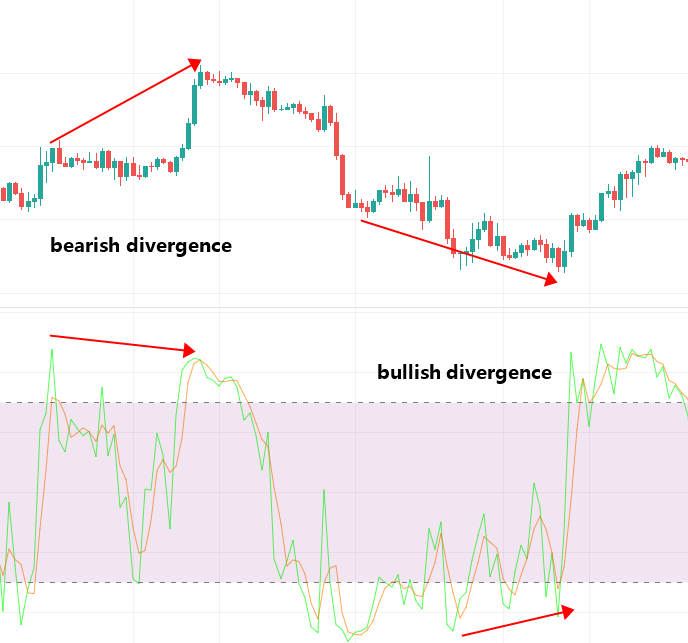
An important point in relation to the divergence strategy is that trades should not be made until divergence is confirmed by an actual turnaround in the price. An instrument’s price can continue to rise or fall for a long time, even while divergence is occurring.
Pros & Cons of the Stochastic Indicator
Traders ought to understand where the stochastic oscillator excels and where its short-comings lie, in order to get the most out of the indicator. In short, the advantages of the indicator including that it clears entry/exit signals, signals appear frequently (depending on the selected time setting), available on most charting packages and conceptually easy to understand.
However, stochastic measures the momentum, not the range of the price movement. This is a very important distinction. As one full stochastic oscillation from 20-band to 80-band may result in a $2 price move, the inverse oscillation back down from the 80-band to the 20-band may only reap a + $0.50 price move.
In addition, the Stochastic Indicator can produce false signals when used incorrectly and prices can remain overbought/oversold for long periods if trading against the trend. Therefore, stochastic like all indicators work best when used in combination with other indicators to generate a cumulative effect.
Conclusion
The Stochastic Oscillator is an efficient instrument, especially good for beginner traders in Forex. When used correctly, this indicator can help you better gauge price movements in both trending and range bound markets.
However, traders need to avoid blindly shorting at overbought levels in upward trending markets; and going long in down trending markets purely based on oversold conditions shown by the indicator. When combined with other indicators, the stochastic indicator can help a trader identify trend reversals, support and resistance levels, and potential entry and exit points.

Copyright © 2026 FastBull Ltd


Risk Warning
FX trading is of high risk and may not be suitable for all investors. Leverage will create additional risks and loss. Before trading, please carefully consider your investment objectives, experience level and risk tolerance. You may lose part or all of your initial investment; do not invest money that you cannot afford. Educate yourself about the risks associated with FX trading. If you have any questions, please consult an independent financial or tax advisor. Any data and information are provided "as is" and only for information purpose, not for trading or recommendations. Past performance does not predict future results.
Disclaimer
The data contained in this website may not be real-time and accurate. The data and prices on this site are not necessarily provided by the market or exchange, but may be provided by market makers, so prices may be inaccurate and differ from actual market prices. Namely, this price is indicative price only to reflect market trend, and is unfavorable for trading purpose. The provider of the data contained in the Website shall not be liable for any loss incurred by you as a result of your trading activities or reliance on the information contained in the Website.