


- GBPUSD
- XAUUSD
- XAGUSD
- WTI
- USDX


行情
分析
使用者
快訊
財經日曆
學習
數據
- 名稱
- 最新值
- 前值












將舊的外匯報價直接套用到資料空白期中,不會產生任何收益,也不會帶來新的市場觀察結果。兩條可複現的價格走勢表明,這種做法為何會提高或降低測得的波動率,以及為何成交價格本身無法支撐回測成交價。
外匯價格文件中的一段平坦區域可能表示報價未發生變化,也可能表示某個資料來源停止記錄。這兩種情況屬於不同的證據類型。將最後一個可用價格複製到空白行中,雖然可以使文件看起來連續,但並不能確定市場在缺口期間的報價。
填補數據缺口並不總是能降低測得的波動率。它可能掩蓋價格反轉,但也可能將多次漸進式波動合併成一次較大的記錄變化。實際問題在於,觀測結果是否支持所選的採樣間隔和執行假設,而不是最終的電子表格是否得出令人安心的數字。
假設一個 EURUSD 檔案旨在包含每分鐘邊界處的有效買價。由於資料擷取故障,導致兩個邊界缺失。前向填充會將最後記錄的買價分配給這兩個邊界。由此產生的收益序列中的零值是該分配的結果;它們並不表示買價保持不變。
另一種情況是,如果事件流能夠正常報告報價的變更,並且其完整訊息和報價規則表明報價仍然有效,則可以繼續保持該狀態。同樣價格的新記錄也可能產生真實的零回報。不要刪除所有零值,也不要假設沒有新訊息意味著系統不活躍或故障。
首先要明確來源記錄的內容:快照、變更、參考價格、可執行報價或交易。確保交易品種和買價、賣價或中間價的定義一致。在判定某個時間段缺失之前,請先核對其預期的時間邊界;檢查外匯K線的時間窗口和價格定義有助於區分窗口不匹配和真正的記錄缺失。
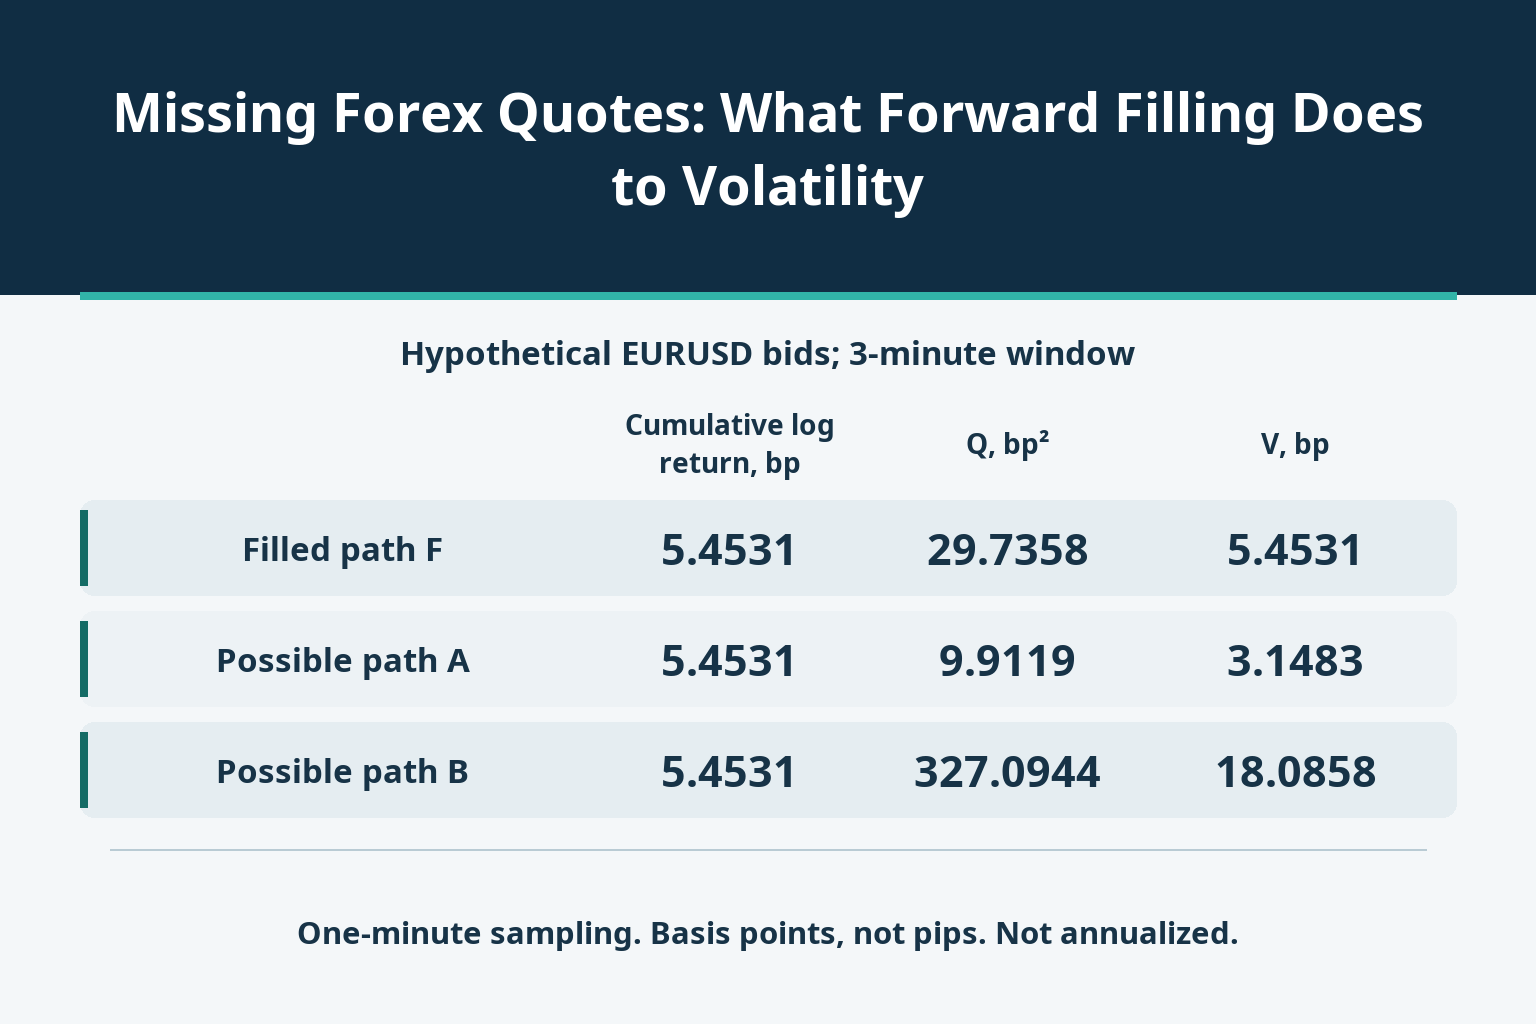
使用假設的歐元/美元報價,以美元/歐元為單位,選取一個UTC日期連續四個分鐘邊界點。僅存了12:00的1.1000和12:03的1.1006這兩個價格。 12:01和12:02的記錄遺失。表格顯示了已填入的序列F以及兩條可能的完整分鐘取樣路徑A和B,這兩條路徑與已儲存的端點一致。
| UTC時間 | 已儲存出價 | 填充路徑 F | 可能的路徑 A | 可能的路徑 B |
|---|---|---|---|---|
| 12:00 | 1.1000 | 1.1000 | 1.1000 | 1.1000 |
| 12:01 | 遺失的 | 1.1000 | 1.1002 | 1.1010 |
| 12:02 | 遺失的 | 1.1000 | 1.1004 | 1.0996 |
| 12:03 | 1.1006 | 1.1006 | 1.1006 | 1.1006 |
路徑 A 每分鐘上漲 2 點。路徑 B 分別上漲 10 點、下跌 14 點和上漲 10 點。路徑 F 則分別記錄 0 個點、0 個點和上漲 6 個點。此處,歐元兌美元匯率的一個點等於 1 歐元兌 0.0001 美元。這些變化有助於解讀價格走勢,但點數並非下文波動率計算中所使用的百分比收益基點。
A 和 B 都不是恢復的歷史數據,也不是連續的逐筆交易路徑。它們是特意建構的替代方案,旨在展現兩個已保存價格無法識別的訊息。它們的共同端點確定了整體價格變動,但並未揭示三個單獨的一分鐘價格變動。
For each one-minute interval define z_i = 10000 × ln(P_i/P_(i−1)), a log return measured in basis points. For this same three-minute window, calculate Q = Σz_i² and V = √Q. Q is the sampled realized-variance measure in squared basis points; V is its square root in basis points. Neither is annualized. This calculation does not subtract the mean or divide by the number of returns, so it is not the usual sample standard deviation.
| Three-minute path | One-minute log returns, bp | Cumulative log return, bp | Q, bp² | V, bp |
|---|---|---|---|---|
| Filled F | 0; 0; 5.4531 | 5.4531 | 29.7358 | 5.4531 |
| Possible A | 1.8180; 1.8177; 1.8174 | 5.4531 | 9.9119 | 3.1483 |
| Possible B | 9.0868; −12.7238; 9.0901 | 5.4531 | 327.0944 | 18.0858 |
F produces Q = 29.7358, compared with 9.9119 for the gradual path A: filling has made the measured square sum roughly three times as large. Against the reversing path B, whose Q is 327.0944, the same filled series substantially understates it. Since the square root is increasing, the direction of the comparison is the same for V. There is no universal rule that the inserted zeros must lower the whole-window result.
The arithmetic explains why. When several missing log returns are replaced by zeros and one catch-up return, their squared contribution becomes (Σz_i)² rather than Σz_i². The difference is 2Σ_(ij)z_i z_j. Moves in the same direction reinforce one another when combined; opposing moves can cancel. In all three examples, the cumulative log return remains 10000 × ln(1.1006/1.1000) = 5.4531 basis points.
These are comparisons on a specified one-minute grid over three minutes, not claims about the true continuous-time volatility or tomorrow’s risk. A and B are not confidence limits or the highest and lowest possible histories. More unobserved paths remain possible, and assigning equal probabilities to these two examples would add another unsupported assumption.
The same gap can contaminate a trading test. Suppose the valid 12:00 quote is bid 1.1000 and ask 1.1002. A signal to buy 10000 euros arrives at 12:01 without using future information, but its execution quote is missing. The next saved valid quote, at 12:03, is bid 1.1006 and ask 1.1008. For this illustration there are no separate commissions, financing charges or slippage.
A test that simply treats the copied 1.1002 ask as an available entry at 12:01, then exits at the 12:03 bid, reports 10000 × (1.1006−1.1002) = $4 gross profit. The arithmetic is correct; the missing evidence is whether that entry was available at the signal time and for the required quantity. The filled row cannot supply it.
For contrast, explicitly change the model: the signal remains valid until the next saved quote, entry occurs at the 12:03 ask of 1.1008, and the position is immediately closed at the bid of 1.1006. That model produces a $2 gross loss. This is an intentionally different execution rule, not a reconstruction of the actual trade or a lower bound on its result. Both calculations already include the bid/ask difference; subtracting an estimated spread again would double-count it.
A stale timestamp alone does not prove that the old quote had expired, just as copying it does not prove it remained executable. Without a valid execution record or a predefined alternative execution rule, the trade remains unresolved—not a zero-profit observation. Cancelling or delaying a signal also changes the strategy; if it affects later positions, cash or entries, replay those consequences rather than choosing the favorable treatment afterward.
If the two empty rows are deleted, the return from 12:00 to 12:03 is still a three-minute return. It can be correctly reported with that duration, but must not be relabelled as a one-minute observation and mixed into an equal-frequency calculation. Under a strict rule requiring genuine endpoint observations exactly one minute apart, none of the three one-minute returns in this example is available. The answer is missing information, not zero.
Four populated price rows also do not mean four independent observations. Two rows here contain copied values. Conversely, counting only nonzero returns is not a valid count of independent evidence: genuine quotes can repeat and successive returns can be dependent. Report original records, inserted values, gap lengths and coverage separately from statistical sample-size claims.
Filling backward from the next observation, or drawing an interpolated path using that future endpoint, can place information into a historical signal before it was available. Such a curve may be acceptable as a labelled retrospective illustration, but not as an unnoticed live-trading input. Carrying only past information avoids that particular timing error; it still does not make the old price current or executable.
Nor is deleting every incomplete period a neutral cure. If recording failures cluster in difficult market conditions, a complete-record subset can answer a different question from the intended full-period test. Keep the excluded coverage visible and examine how sensitive the conclusion is to the affected periods instead of silently discarding them.
Preserve the raw file. For every sampled value, retain the grid time, original quote time, source identifier, price side and a flag identifying inserted values; keep receipt time when available. The age of the last genuine quote must remain visible. Replacing its timestamp with the new row’s time disguises an old observation as a fresh one.
檢查資料來源是否正常,訊息是否亂序或重複到達,以及是否捕獲了報價撤回或狀態變更。將已知的非交易視窗與資料採集器故障區別對待。匹配同一交易品種和價格定義內的觀測結果;分別傳遞舊的買價和新的賣價並不會自動產生一致的可執行報價。
在評估效能之前,請先設定允許的引用時長限制並測試其效果。例如,限制為一行已填入的資料並不一定意味著限制為一分鐘(在不規則網格上),而且沒有一個固定的時長限制能夠適用於所有資料來源。務必將計時、資料品質和執行檢查分開進行:通過其中一項檢查並不意味著透過其他檢查。
最後,要展示哪些收益和交易依賴替代,在明確標註的時間內比較合理的處理方法,並保留未解決的案例。如果聲稱的波動率水準或策略優勢在缺乏支持的缺口處理方法下發生顯著變化,則歷史數據尚未證實該結論。更平滑的圖表和更多的小數位數無法彌補缺失的觀測值。

728 RM B 7/F GEE LOK IND BLDG NO 34 HUNG TO RD KWUN TONG KLN HONG KONG


交易股票、貨幣、商品、期貨、債券、基金等金融工具或加密貨幣屬高風險行為,這些風險包括損失您的部分或全部投資金額,所以交易並非適合所有投資者。
做出任何財務決定時,應該進行自己的盡職調查,運用自己的判斷力,並諮詢合格的顧問。本網站的內容並非直接針對您,我們也未考慮您的財務狀況或需求。本網站所含資訊不一定是即時提供的,也不一定是準確的。本站提供的價格可能由造市商而非交易所提供。您做出的任何交易或其他財務決定均應完全由您負責,並且您不得依賴通過網站提供的任何資訊。我們不對網站中的任何資訊提供任何保證,並且對因使用網站中的任何資訊而可能造成的任何交易損失不承擔任何責任。
未經本站書面許可,禁止使用、儲存、複製、展現、修改、傳播或分發本網站所含數據。提供本網站所含數據的供應商及交易所保留其所有知識產權。


