


- XAUUSD
- XAGUSD
- WTI
- USDX


ตลาด
การวิเคราะห์
ผู้ใช้
24x7
ปฏิทินเศรษฐกิจ
แหล่งเรียนรู้
ข้อมูล
- ชื่อ
- ค่าล่าสุด
- ครั้งก่อน









 ปฏิทินเศรษฐกิจ




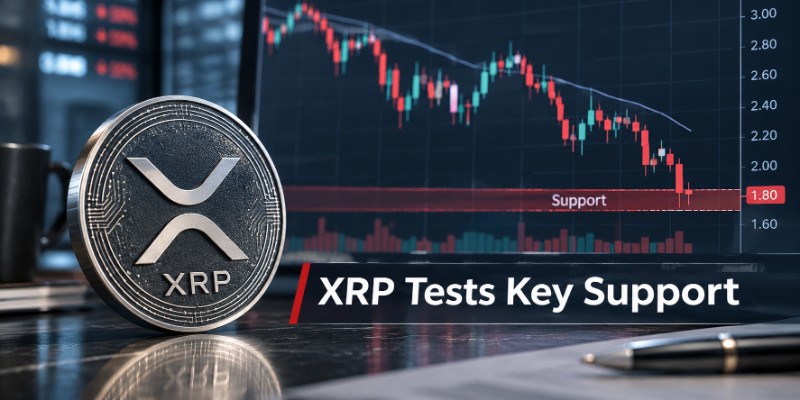
XRP อาจเผชิญกับแนวโน้มขาลง เนื่องจากความอ่อนแอทางเทคนิคทำให้แนวรับสำคัญตกอยู่ในความเสี่ยง ศึกษาถึงสัญญาณขาลง ระดับราคาสำคัญ และปัจจัยที่อาจพลิกกลับแนวโน้มได้
XRP กำลังเผชิญกับแรงกดดันขาลงอีกครั้ง เนื่องจากโมเมนตัมที่อ่อนตัวลงและโครงสร้างทางเทคนิคที่เปราะบางทำให้ระดับแนวรับที่สำคัญตกอยู่ในความเสี่ยง นักลงทุนกำลังจับตาดูว่าผู้ซื้อจะสามารถปกป้องโซนแนวรับล่าสุดได้หรือไม่ หรือว่าการขายที่ต่อเนื่องจะเปิดประตูสู่การปรับฐานที่ลึกกว่าเดิม
สารบัญ
พฤติกรรมราคาของ XRP ในช่วงที่ผ่านมาทำให้เกิดความกังวลเกี่ยวกับแนวโน้มระยะสั้น แทนที่จะฟื้นตัวอย่างยั่งยืน สกุลเงินดิจิทัลนี้กลับดิ้นรนที่จะกลับมามีโมเมนตัมขาขึ้น ทำให้ราคามีความเสี่ยงต่อแรงขายเพิ่มเติม ความอ่อนแอครั้งนี้มีความสำคัญเพราะ XRP กำลังเข้าใกล้ระดับที่ผู้ซื้อเคยพยายามปกป้องตลาดมาก่อน
บทวิเคราะห์ทางเทคนิครายวันของ COINOTAG สำหรับวันที่ 6 พฤศจิกายน 2026ใช้ราคา 1.1826 ดอลลาร์เป็นราคาอ้างอิง และระบุแนวรับทันทีที่ 1.1766 ดอลลาร์ และแนวต้านที่ 1.2226 ดอลลาร์ การวิเคราะห์แสดงให้เห็นถึงแนวโน้มขาลงที่แข็งแกร่ง โดยราคาอยู่ต่ำกว่าค่าเฉลี่ยเคลื่อนที่ทั้งแปดที่ตรวจสอบ ข้อมูลเหล่านี้แสดงถึงภาพรวมรายวันเฉพาะเจาะจง ไม่ใช่ชุดระดับราคาถาวร
การลดลงนี้สะท้อนให้เห็นมากกว่าแค่การปรับตัวลงชั่วคราวภายในวันเดียว XRP ประสบปัญหาในการรักษาระดับการเคลื่อนไหวขึ้น ในขณะที่ตัวชี้วัดทางเทคนิคบ่งชี้ว่าผู้ขายยังคงได้เปรียบในกรอบเวลาที่สั้นกว่า เมื่อสินทรัพย์ไม่สามารถฟื้นตัวซ้ำแล้วซ้ำเล่าหลังจากลดลง ผู้เข้าร่วมตลาดอาจไม่เต็มใจที่จะซื้อการดีดตัวขึ้นชั่วคราว โดยเฉพาะอย่างยิ่งเมื่อความเชื่อมั่นของตลาดโดยรวมไม่แน่นอน
ค่าเฉลี่ยเคลื่อนที่ช่วยให้นักลงทุนแยกแยะความผันผวนระยะสั้นออกจากแนวโน้มทิศทางในวงกว้างได้ เมื่อสินทรัพย์ซื้อขายต่ำกว่าค่าเฉลี่ยที่สำคัญหลายตัว ค่าเฉลี่ยเหล่านั้นอาจกลายเป็นแนวต้านในระหว่างการพยายามฟื้นตัว ตำแหน่งของ XRP ที่อยู่ต่ำกว่าค่าเฉลี่ยที่ติดตามอยู่ บ่งชี้ว่าผู้ซื้ออาจต้องการมากกว่าการดีดตัวขึ้นเพียงเล็กน้อยเพื่อสร้างการกลับตัวที่น่าเชื่อถือ
อย่างไรก็ตาม ความอ่อนแอทางเทคนิคไม่ได้หมายความว่าการปรับตัวลงอีกครั้งเป็นสิ่งที่หลีกเลี่ยงไม่ได้ ความต้องการอาจกลับมาอยู่ใกล้แนวรับและช่วยให้ตลาดมีเสถียรภาพ คำถามสำคัญคือผู้ซื้อจะสามารถเปลี่ยนเสถียรภาพให้เป็นการฟื้นตัวที่ยั่งยืนได้หรือไม่
ตัวชี้วัดทางเทคนิคหลายตัวส่งผลให้มุมมองต่อ XRP อยู่ในภาวะระมัดระวัง ตัวชี้วัดที่ถูกจับตามองมากที่สุด ได้แก่ ดัชนีความแข็งแกร่งสัมพัทธ์ (RSI) ค่าเฉลี่ยเคลื่อนที่ และตัวชี้วัดโมเมนตัม เช่น MACD (Moving Average Convergence Divergence)
The RSI measures the speed and magnitude of recent price movements. It generally ranges from zero to 100, with readings below 30 commonly interpreted as oversold and readings above 70 as overbought. COINOTAG's November 6 assessment placed XRP's daily RSI at approximately 33.3, while its four-hour RSI stood near 28.0. The shorter timeframe therefore showed more pronounced selling pressure.
A four-hour RSI below 30 can attract buyers looking for a technical rebound. Nevertheless, an oversold reading does not prove that a decline has ended. During a persistent downtrend, an asset can remain oversold as sellers continue to dominate trading activity.
The MACD offers another way to evaluate whether bearish momentum is strengthening or weakening. When the MACD line remains below its signal line and both sit in negative territory, traders generally interpret the configuration as evidence of downward momentum. The November 6 daily snapshot showed a negative MACD reading and a negative histogram, consistent with a bearish momentum signal.
The broader concern is that any potential rebound has not yet been supported by convincing evidence of a trend reversal. Even if selling pressure begins to ease, buyers will need to push the price higher and maintain those gains to change the technical picture. Moving averages add another challenge: XRP needs to recover important short-term averages before traders can confidently argue that its downward structure is improving.
The $1.18 area has become an important near-term reference point for XRP traders. It sits close to the technical support identified at $1.1766, making this zone worth monitoring as the market attempts to stabilize.
A successful defense could give buyers an opportunity to slow the decline and establish a short-term trading range. However, repeated tests of the same support can weaken confidence in its ability to hold, particularly when buying interest remains limited.
The next technical support levels in the November 6 snapshot were around $1.1382 and $1.0497. These are potential areas to monitor if selling pressure intensifies, not guaranteed price targets. Their relevance may change as new daily candles form and market conditions evolve.
The distinction between an intraday move below support and a confirmed breakdown is important. A temporary dip may reflect short-term volatility or stop-loss activity. A sustained daily close below $1.1766 would provide stronger evidence that sellers have gained additional control.
Traders may therefore focus on daily closing prices, trading volume and the market's response to recovery attempts. A breakdown accompanied by expanding selling volume would generally carry more bearish significance than a brief move below support followed by a rapid recovery.
If XRP cannot defend the $1.18 region, attention may shift toward lower support areas. Such a move would reinforce the existing bearish structure and potentially encourage additional selling from short-term traders.
The first challenge for buyers would be to prevent the market from establishing a sustained position below nearby support. If that effort fails, the next technical areas around $1.14 and $1.05 could become increasingly relevant.
A breakdown could also affect market psychology. Traders who previously viewed the decline as a temporary correction may reconsider their positions if XRP continues making lower lows. This could increase selling pressure, especially among participants using leverage or following short-term technical signals.
Nevertheless, a bearish scenario would become less convincing if XRP quickly recovered the broken support area. Such a move could indicate that the breakdown was a temporary liquidity event rather than the beginning of another extended downward movement. Confirmation matters more than a single price print.
Despite the negative short-term structure, XRP's downside outlook is not irreversible. A meaningful recovery would require buyers to demonstrate that selling pressure is fading and that demand can support higher prices.
The first positive signal would be a sustained move above immediate resistance near $1.2226. A daily close above this level could indicate that buyers are beginning to regain control. The next areas to watch would be $1.2546 and $1.291, where additional technical resistance could limit a recovery.
A stronger bullish signal would emerge if XRP reclaimed these levels with increasing trading volume. Rising prices accompanied by stronger participation would provide better evidence of genuine demand than a low-volume rebound.
There is also an important distinction between short-term and longer-term indicators. COINOTAG's November 6 analysis showed a strong bearish bias on both four-hour and daily charts, while the weekly outlook retained a bullish bias, with weekly RSI near 42.5. This divergence suggests that near-term weakness does not necessarily invalidate the broader recovery structure.
However, the weekly outlook would need confirmation from improving price action. Without that confirmation, short-term bearish momentum could continue to dominate trading decisions.
XRP does not trade independently of the wider cryptocurrency market. Bitcoin's direction, overall risk appetite and liquidity conditions can influence demand for major altcoins.
When Bitcoin experiences significant selling pressure, investors may reduce exposure to other cryptocurrencies, including XRP. This can make it more difficult for XRP to recover even when its own technical indicators begin showing signs of stabilization.
The broader market environment also matters because institutional and retail investors often adjust cryptocurrency exposure according to macroeconomic expectations. Changes in interest-rate expectations, inflation concerns and geopolitical uncertainty can affect demand for risk-sensitive assets.
Derivatives activity is another factor. High leverage can amplify price movements when markets approach important technical levels. If XRP falls below support while leveraged traders are heavily positioned, forced liquidations could add to selling pressure.
Conversely, declining open interest combined with stabilizing prices could indicate that excessive speculative positioning is being reduced. Such a development would not guarantee a recovery, but it could help create more stable conditions for buyers.
Traders should therefore consider XRP's technical structure alongside Bitcoin's performance, broader market liquidity and derivatives positioning rather than relying on a single indicator.
The coming trading sessions could help determine whether XRP is entering another downward leg or attempting to establish a temporary bottom. Several signals deserve particular attention:
These indicators are most useful when they point in the same direction. For example, a move above resistance supported by stronger spot-market volume and improving momentum would provide a more convincing bullish signal than an isolated price spike.
XRP's immediate technical outlook remains cautious as weakening momentum and nearby support create an unfavorable short-term trading environment. If buyers fail to defend the current price structure, the cryptocurrency could face additional downside pressure, with lower support areas becoming increasingly important.
Nevertheless, the possibility of a rebound should not be dismissed. Oversold conditions, improving weekly momentum and a recovery above immediate resistance could change the market's direction.
ในขณะนี้ ประเด็นสำคัญอยู่ที่ว่าผู้ซื้อจะสามารถสร้างแนวรับที่ยั่งยืนได้หรือไม่ แทนที่จะแค่ดีดตัวขึ้นชั่วคราว จนกว่า XRP จะแสดงให้เห็นถึงความต้องการที่แข็งแกร่งขึ้นและกลับไปสู่ระดับทางเทคนิคที่สำคัญ ความเสี่ยงที่จะเกิดการลดลงเพิ่มเติมยังคงมีอยู่
นักลงทุนควรติดตามความเคลื่อนไหวของราคา ปริมาณการซื้อขาย และสภาวะโดยรวมของสกุลเงินดิจิทัล ก่อนที่จะสรุปเกี่ยวกับแนวโน้มสำคัญครั้งต่อไป ระดับแนวรับทางเทคนิคเป็นจุดอ้างอิงที่มีประโยชน์ แต่ไม่ใช่การรับประกันว่าจะไม่มีการขาดทุนเพิ่มเติม

728 RM B 7/F GEE LOK IND BLDG NO 34 HUNG TO RD KWUN TONG KLN HONG KONG


ความเสี่ยงของการสูญเสียในการซื้อขายสินทรัพย์ทางการเงิน เช่น หุ้น FX สินค้าโภคภัณฑ์ ฟิวเจอร์ส พันธบัตร ETFs หรือเงินดิจิทัลอาจมีมาก คุณอาจสูญเสียเงินทุนทั้งหมดที่คุณฝากไว้กับโบรกเกอร์ของคุณ ดังนั้น คุณควรพิจารณาอย่างรอบคอบว่าการซื้อขายดังกล่าวเหมาะสมกับคุณหรือไม่ในสถานการณ์และทรัพยากรทางการเงินของคุณ
ไม่ควรตัดสินใจลงทุนโดยไม่ได้ดำเนินการตรวจสอบสถานะอย่างละเอียดถี่ถ้วนด้วยตัวเองหรือปรึกษากับที่ปรึกษาทางการเงินของคุณ เนื้อหาเว็บของเราอาจไม่เหมาะกับคุณเนื่องจากเราไม่ทราบเงื่อนไขทางการเงินและความต้องการในการลงทุนของคุณ ข้อมูลทางการเงินของเราอาจมีความล่าช้าหรือมีความไม่ถูกต้อง ดังนั้นคุณควรรับผิดชอบอย่างเต็มที่ต่อการตัดสินใจซื้อขายและการลงทุนของคุณ บริษัทจะไม่รับผิดชอบต่อการสูญเสียเงินทุนของคุณ
หากไม่ได้รับอนุญาตจากเว็บไซต์ คุณจะไม่สามารถคัดลอกกราฟิก ข้อความ หรือเครื่องหมายการค้าของเว็บไซต์ได้ สิทธิ์ในทรัพย์สินทางปัญญาในเนื้อหาหรือข้อมูลที่รวมอยู่ในเว็บไซต์นี้เป็นของผู้ให้บริการและผู้ค้าแลกเปลี่ยน
ไม่ได้ล็อกอิน
เข้าสู่ระบบเพื่อเข้าถึงฟังก์ชั่นเพิ่มเติม


เข้าสู่ระบบ
ลงทะเบียน