• การซื้อขาย
  • ตลาด
  • คัดลอก
  • การแข่งขัน
  • 24x7
  • ปฏิทิน
  • Q&A
  • แชท
ตัวกรอง
สินทรัพย์
ล่าสุด
ราคาขาย
ราคาซื้อ
สูงสุด
ต่ำสุด
เปลี่ยน
% เปลี่ยน
สเปรด
แหล่งที่มา
SPX
S&P 500 Index
7580.07
7580.07
7580.07
7637.48
7527.56
-140.32
-1.82%
--
--
DJI
Dow Jones Industrial Average
51770.31
51770.31
51770.31
52383.90
51563.76
-572.25
-1.09%
--
--
IXIC
NASDAQ Composite Index
25436.99
25436.99
25436.99
25673.00
25177.33
-747.73
-2.86%
--
--
USDX
ดัชนีดอลลาร์สหรัฐ
101.807
101.807
101.887
101.913
101.400
+0.104
+ 0.10%
--
--
EURUSD
ยูโร/ดอลลาร์สหรัฐ
1.11561
1.11561
1.11616
1.12144
1.11353
-0.00230
-0.21%
--
--
GBPUSD
ปอนด์สเตอร์ลิง/ดอลลาร์สหรัฐ
1.33860
1.33860
1.33926
1.34334
1.33702
+0.00095
+ 0.07%
--
--
XAUUSD
Gold / US Dollar
3875.25
3875.25
3875.25
4026.26
3869.98
-145.70
-3.62%
--
--
WTI
Light Sweet Crude Oil
102.072
102.072
102.102
104.014
101.471
+0.099
+ 0.10%
--
--

บัญชีชุมชน

บัญชีสัญญาณ (อัน)
--
บัญชีกำไร (อัน)
--
บัญชีขาดทุน (อัน)
--
ดูเพิ่มเติม

มาเป็นผู้ให้สัญญาณ

ขายสัญญาณและรับรายได้

ดูเพิ่มเติม

คู่มือการคัดลอกการซื้อขาย

เริ่มต้นง่ายๆ

ดูเพิ่มเติม

สัญญาณ VIP

ทั้งหมด

ผลตอบแทนที่ดีที่สุด
  • ผลตอบแทนที่ดีที่สุด
  • กำไร/ขาดทุนที่ดีที่สุด
  • MDD ที่ดีที่สุด
1 สัปดาห์ที่ผ่านมา
  • 1 สัปดาห์ที่ผ่านมา
  • 1 เดือนที่ผ่านมา
  • 1 ปีที่ผ่านมา

ทั้งหมด

  • ทั้งหมด
  • แนะนำ
  • หุ้น
  • สกุลเงินดิจิทัล
  • ธนาคารกลาง
  • อัปเดตทรัมป์
  • ข่าวเด่น
ดูข่าวเด่นเท่านั้น
แชร์

การที่ทรัมป์เสนอให้โบลโซนาโรลี้ภัยในสหรัฐฯ ได้ทำให้ความตึงเครียดระหว่างสหรัฐฯ และบราซิลเพิ่มสูงขึ้น ส่งผลให้รูบิโอและรัฐมนตรีต่างประเทศของบราซิลตกลงที่จะพบกันอีกครั้ง

แชร์

ลาฟรอฟ: ปูตินยินดีที่จะพบกับเซเลนสกี โดยมีเงื่อนไขว่าเซเลนสกีต้องเดินทางมายังมอสโก

แชร์

ญี่ปุ่น สหรัฐอเมริกา และเกาหลีใต้ ได้ลงนามในบันทึกความเข้าใจว่าด้วยความร่วมมือในแถบอาร์กติกและแปซิฟิก และจะจัดตั้งคณะทำงานเพื่อส่งเสริมความร่วมมือทางทะเลและเศรษฐกิจ

แชร์

นายกเทศมนตรีเมืองเคียฟกล่าวว่า: ระบบประปาของเมืองหยุดชะงักลงหลังจากการโจมตีทางอากาศของรัสเซีย

แชร์

สำนักงานสถิติแห่งชาติของจีน: ดัชนีผู้จัดการฝ่ายจัดซื้อ (PMI) สำหรับภาคการผลิตเทคโนโลยีขั้นสูงและภาคการผลิตอุปกรณ์ในเดือนตุลาคมอยู่ที่ 51.3% และ 50.6% ตามลำดับ

แชร์

ราคาน้ำมันดิบเบรนท์ลดลงต่ำกว่า 113 ดอลลาร์ในการซื้อขายในตลาดมืด ลดลงมากกว่า 0.7% ในวันเดียวกัน

แชร์

สำนักงานสถิติแห่งชาติของจีน: ดัชนีกิจกรรมทางธุรกิจนอกภาคการผลิตอยู่ที่ 49.7% ในเดือนตุลาคม

แชร์

ราคาก๊าซธรรมชาติล่วงหน้าของสหรัฐฯ ร่วงลงต่ำกว่า 2.90 ดอลลาร์ในตลาดมืด ลดลง 0.7% ในวันเดียวกัน

แชร์

สำนักงานสถิติแห่งชาติของจีนรายงานว่า ดัชนีผู้จัดการฝ่ายจัดซื้อภาคการผลิต (PMI) อยู่ที่ 49.3% ในเดือนตุลาคม ลดลง 0.8 จุดเปอร์เซ็นต์จากเดือนก่อนหน้า บ่งชี้ว่ากิจกรรมการผลิตลดลงเล็กน้อย เมื่อพิจารณาตามขนาดของวิสาหกิจ ดัชนี PMI สำหรับวิสาหกิจขนาดใหญ่ อยู่ที่ 50.2% ลดลง 0.4 จุดเปอร์เซ็นต์จากเดือนก่อนหน้า แต่ยังคงสูงกว่าระดับวิกฤต ส่วนดัชนี PMI สำหรับวิสาหกิจขนาดกลางและขนาดเล็ก อยู่ที่ 48.4% และ 47.5% ตามลำดับ ลดลง 1.3 และ 1.4 จุดเปอร์เซ็นต์จากเดือนก่อนหน้า และต่ำกว่าระดับวิกฤต

แชร์

สำนักงานสถิติแห่งชาติของจีน: ดัชนีผู้จัดการฝ่ายจัดซื้อภาคการผลิต (PMI) อยู่ที่ 49.3% ในเดือนตุลาคม

แชร์

นายกรัฐมนตรีโปแลนด์ถูกกล่าวหาว่าก่อรัฐประหารต่อศาลรัฐธรรมนูญ

แชร์

เซอร์เกย์ ลาฟรอฟ รัฐมนตรีต่างประเทศรัสเซีย กล่าวว่า การเข้าร่วมกลุ่ม G20 ของโปแลนด์จะไม่เป็นประโยชน์ต่อกลุ่ม และมอสโกเชื่อว่ากลุ่มนี้ไม่จำเป็นต้องเพิ่มเสียงจากยุโรปอีกประเทศหนึ่ง

แชร์

ผู้พิพากษาศาลสหรัฐฯ ตัดสินว่ากระทรวงยุติธรรมถูกห้ามไม่ให้ข่มขู่เจ้าหน้าที่จัดการเลือกตั้ง

แชร์

รัฐบาลทรัมป์มีแผนจะส่งตัวผู้อพยพชาวอัฟกันบางส่วนกลับไปยังประเทศอัฟกานิสถาน

แชร์

ทรัมป์: แฟนนี เมย์ และเฟรดดี แมค จะลงทุน 40 พันล้านดอลลาร์ในธุรกิจปล่อยสินเชื่อจำนองในฟลอริดา

แชร์

ทรัมป์: เราได้สร้างพรมแดนที่ปลอดภัยที่สุดในประวัติศาสตร์อเมริกา ในช่วง 17 เดือนที่ผ่านมา ไม่มีผู้อพยพผิดกฎหมายแม้แต่คนเดียวได้รับอนุญาตให้เข้ามาในสหรัฐอเมริกา เราประสบความสำเร็จในการลดอาชญากรรมรุนแรงลงมากที่สุดเป็นประวัติการณ์ และอัตราการฆาตกรรมลดลงสู่ระดับต่ำสุดนับตั้งแต่ปี 1900 หรือในรอบ 125 ปี

แชร์

ทรัมป์: จัดสรรเงินทุนจากรัฐบาลกลางจำนวน 40 ล้านดอลลาร์สำหรับโครงการฝึกงาน

แชร์

ในรัฐฟลอริดา ทรัมป์ประกาศว่าบริษัทจอห์นสัน แอนด์ จอห์นสัน จะลงทุน 1 พันล้านดอลลาร์เพื่อสร้างศูนย์กระจายสินค้าขนาดใหญ่ในเมืองแจ็กสันวิลล์ บริษัทบลู ออริจิน จะลงทุน 600 ล้านดอลลาร์เพื่อขยายฐานการผลิตจรวดที่ท่าอวกาศเคปคานาเวรัล และบริษัทวิลเลียมส์ อินเตอร์เนชั่นแนล จะลงทุนอีก 1 พันล้านดอลลาร์เพื่อผลิตเครื่องยนต์อากาศยานในเคาน์ตีโอคาลา รัฐฟลอริดา

แชร์

ซีอีโอของกลุ่มสายการบินอะแลสกาแอร์ไลน์กล่าวว่า ราคาน้ำมันเชื้อเพลิงและความท้าทายทางภูมิรัฐศาสตร์ได้สร้างแรงกดดันทางการเงินอย่างมากต่อธุรกิจ

แชร์

สายการบินอลาสก้าแอร์ไลน์จะเลิกจ้างพนักงานชั่วคราวประมาณ 200 คน โดยการเลิกจ้างนี้จะไม่ส่งผลกระทบต่อตำแหน่งงานระดับปฏิบัติการที่ไม่ใช่ผู้บริหาร

เวลา
ค่าจริง
คาดการณ์
ครั้งก่อน
ผลกระทบ
ตุรกี ดัชนีความเชื่อมั่นเศรษฐกิจ (ต.ค.)

ค:--

ค: --

ค: --

XAUUSD
  • XAUUSD
  • XAGUSD
  • WTI
  • USDX
สหราชอาณาจักร ดัชนีราคาบ้าน Nationwide MoM (ต.ค.)

ค:--

ค: --

ค: --
GBPUSD
  • GBPUSD
  • XAUUSD
  • XAGUSD
  • WTI
  • USDX
สหราชอาณาจักร ดัชนีราคาบ้าน Nationwide YoY (ต.ค.)

ค:--

ค: --

ค: --

GBPUSD
  • GBPUSD
  • XAUUSD
  • XAGUSD
  • WTI
  • USDX
ฝรั่งเศส PPI MoM (ก.ย.)

ค:--

ค: --

ค: --

EURUSD
  • EURUSD
  • XAUUSD
  • XAGUSD
  • WTI
  • USDX
เยอรมนี อัตราการว่างงาน (SA) (ต.ค.)

ค:--

ค: --

ค: --

EURUSD
  • EURUSD
  • XAUUSD
  • XAGUSD
  • WTI
  • USDX
เยอรมนี GDP (เบื้องต้น) YoY (ปรับวันทำงาน) (ไตรมาส 3)

ค:--

ค: --

ค: --

EURUSD
  • EURUSD
  • XAUUSD
  • XAGUSD
  • WTI
  • USDX
เยอรมนี GDP Prelim YoY (Not SA) (ไตรมาส 3)

ค:--

ค: --

ค: --

EURUSD
  • EURUSD
  • XAUUSD
  • XAGUSD
  • WTI
  • USDX
เยอรมนี GDP Prelim QoQ (SA) (ไตรมาส 3)

ค:--

ค: --

ค: --

EURUSD
  • EURUSD
  • XAUUSD
  • XAGUSD
  • WTI
  • USDX
อิตาลี GDP Prelim YoY (SA) (ไตรมาส 3)

ค:--

ค: --

ค: --

EURUSD
  • EURUSD
  • XAUUSD
  • XAGUSD
  • WTI
  • USDX
ยูโรโซน GDP Prelim QoQ (SA) (ไตรมาส 3)

ค:--

ค: --

ค: --

EURUSD
  • EURUSD
  • XAUUSD
  • XAGUSD
  • WTI
  • USDX
อิตาลี HICP Prelim YoY (ต.ค.)

ค:--

ค: --

ค: --

EURUSD
  • EURUSD
  • XAUUSD
  • XAGUSD
  • WTI
  • USDX
ยูโรโซน อัตราการว่างงาน (ก.ย.)

ค:--

ค: --

ค: --
EURUSD
  • EURUSD
  • XAUUSD
  • XAGUSD
  • WTI
  • USDX
ยูโรโซน GDP Prelim YoY (SA) (ไตรมาส 3)

ค:--

ค: --

ค: --

EURUSD
  • EURUSD
  • XAUUSD
  • XAGUSD
  • WTI
  • USDX
อิตาลี ค่าจ้างรายชั่วโมงเฉลี่ย MoM (ก.ย.)

ค:--

ค: --

ค: --

EURUSD
  • EURUSD
  • XAUUSD
  • XAGUSD
  • WTI
  • USDX
บราซิล อัตราการว่างงาน (ก.ย.)

ค:--

ค: --

ค: --

XAUUSD
  • XAUUSD
  • XAGUSD
  • WTI
  • USDX
แอฟริกาใต้ ดุลการค้า (ก.ย.)

ค:--

ค: --

ค: --

XAUUSD
  • XAUUSD
  • XAGUSD
  • WTI
  • USDX
สหรัฐอเมริกา ดัชนีต้นทุนด้านแรงงาน QoQ (ไตรมาส 3)

ค:--

ค: --

ค: --

XAUUSD
  • XAUUSD
  • XAGUSD
  • WTI
  • USDX
แคนาดา GDP YoY (ส.ค.)

ค:--

ค: --

ค: --

WTI
  • WTI
  • XAUUSD
  • XAGUSD
  • USDX
แคนาดา GDP MoM(SA) (ส.ค.)

ค:--

ค: --

ค: --

WTI
  • WTI
  • XAUUSD
  • XAGUSD
  • USDX
เยอรมนี HICP Prelim MoM (ต.ค.)

ค:--

ค: --

ค: --

EURUSD
  • EURUSD
  • XAUUSD
  • XAGUSD
  • WTI
  • USDX
เยอรมนี HICP Prelim YoY (ต.ค.)

ค:--

ค: --

ค: --

EURUSD
  • EURUSD
  • XAUUSD
  • XAGUSD
  • WTI
  • USDX
เยอรมนี CPI Final MoM (ต.ค.)

ค:--

ค: --

ค: --

EURUSD
  • EURUSD
  • XAUUSD
  • XAGUSD
  • WTI
  • USDX
เยอรมนี GDP Final QoQ (SA) (ต.ค.)

ค:--

ค: --

ค: --

สหรัฐอเมริกา PMI Chicago (ต.ค.)

ค:--

ค: --

ค: --

USDX
  • USDX
  • XAUUSD
  • XAGUSD
  • WTI
แคนาดา ยอดดุลงบประมาณของรัฐบาลกลาง (ส.ค.)

ค:--

ค: --

ค: --

USDCAD
  • USDCAD
  • XAUUSD
  • XAGUSD
  • WTI
  • USDX
สหรัฐอเมริกา ปริมาณเครื่องเจาะทั้งหมดรายสัปดาห์

ค:--

ค: --

ค: --

WTI
  • WTI
  • XAUUSD
  • XAGUSD
  • USDX
สหรัฐอเมริกา ปริมาณเครื่องเจาะน้ำมันทั้งหมดรายสัปดาห์

ค:--

ค: --

ค: --

WTI
  • WTI
  • XAUUSD
  • XAGUSD
  • USDX
จีนแผ่นดินใหญ่ PMI นอกภาคการผลิต NBS (ต.ค.)

ค:--

ค: --

ค: --

XAUUSD
  • XAUUSD
  • XAGUSD
  • WTI
  • USDX
จีนแผ่นดินใหญ่ PMI ภาคการผลิต NBS (ต.ค.)

ค:--

ค: --

ค: --

XAUUSD
  • XAUUSD
  • XAGUSD
  • WTI
  • USDX
จีนแผ่นดินใหญ่ PMI คอมโพสิต (ต.ค.)

ค:--

ค: --

ค: --

XAUUSD
  • XAUUSD
  • XAGUSD
  • WTI
  • USDX
เกาหลีใต้ ดุลการค้าเบื้องต้น (ต.ค.)

--

ค: --

ค: --
อินโดนีเซีย PMI อุตสาหกรรมการผลิต IHS Markit (ต.ค.)

--

ค: --

ค: --

ออสเตรเลีย ใบอนุญาตก่อสร้าง YoY (SA) (ก.ย.)

--

ค: --

ค: --

ออสเตรเลีย ใบอนุญาตก่อสร้าง MoM (SA) (ก.ย.)

--

ค: --

ค: --

ออสเตรเลีย ใบอนุญาตก่อสร้างภาคเอกชน MoM (SA) (ก.ย.)

--

ค: --

ค: --

ญี่ปุ่น PMI อุตสาหกรรมการผลิตสุดท้าย (ต.ค.)

--

ค: --

ค: --

เกาหลีใต้ PMI อุตสาหกรรมการผลิต IHS Markit (SA) (ต.ค.)

--

ค: --

ค: --

จีนแผ่นดินใหญ่ PMI อุตสาหกรรมการก่อสร้าง Caixin (ต.ค.)

--

ค: --

ค: --

อินโดนีเซีย อัตราเงินเฟ้อ YoY (ต.ค.)

--

ค: --

ค: --

อินโดนีเซีย ดุลการค้า (ก.ย.)

--

ค: --

ค: --

อินโดนีเซีย อัตราเงินเฟ้อหลัก YoY (ต.ค.)

--

ค: --

ค: --

อินเดีย ดัชนี PMI ภาคการผลิต HSBC ขั้นสุดท้าย (ต.ค.)

--

ค: --

ค: --

ออสเตรเลีย ราคาสินค้าโภคภัณฑ์ YoY (ต.ค.)

--

ค: --

ค: --

รัสเซีย PMI อุตสาหกรรมการผลิต IHS Markit (ต.ค.)

--

ค: --

ค: --

เยอรมนี ดัชนียอดค้าปลีกที่จริง MoM (ก.ย.)

--

ค: --

ค: --

ตุรกี PMI อุตสาหกรรมการผลิต (ต.ค.)

--

ค: --

ค: --

อิตาลี PMI อุตสาหกรรมการผลิต (SA) (ต.ค.)

--

ค: --

ค: --

แอฟริกาใต้ PMI อุตสาหกรรมการผลิต (ต.ค.)

--

ค: --

ค: --

ยูโรโซน PMI อุตสาหกรรมการผลิตสุดท้าย (ต.ค.)

--

ค: --

ค: --

สหราชอาณาจักร PMI อุตสาหกรรมการผลิตเบื้องต้น (ต.ค.)

--

ค: --

ค: --

แคนาดา ดัชนีความเชื่อมั่นเศรษฐกิจแห่งชาติ

--

ค: --

ค: --

แคนาดา PMI อุตสาหกรรมการผลิต (SA) (ต.ค.)

--

ค: --

ค: --

สหรัฐอเมริกา PMI อุตสาหกรรมการผลิตสุดท้าย IHS Markit (ต.ค.)

--

ค: --

ค: --

สหรัฐอเมริกา ดัชนีสินค้าคงคลัง ISM (ต.ค.)

--

ค: --

ค: --

สหรัฐอเมริกา ค่าใช้จ่ายอุตสาหกรรมการก่อสร้าง MoM (ก.ย.)

--

ค: --

ค: --

สหรัฐอเมริกา ดัชนีเอาต์พุต ISM (ต.ค.)

--

ค: --

ค: --

สหรัฐอเมริกา ดัชนีการจ้างงานภาคการผลิต ISM (ต.ค.)

--

ค: --

ค: --

สหรัฐอเมริกา PMI อุตสาหกรรมการผลิต ISM (ต.ค.)

--

ค: --

ค: --

Q&A กับผู้เชี่ยวชาญ
    • ทั้งหมด
    • ห้องสนทนา
    • กลุ่ม
    • เพื่อน
    Skylark flag
    5948210
    adolesencia
    @Visitor5948210hello visitor 👋 how are you doing today hope you are good welcome
    2460732 flag
    If any positive news about war comes before Monday market open is there a chance this can go back to 4000 levels, i am on long from 4000 levels and now. My account is 53% one more drop and my account is wiped. I can put some money if any chance of recovery.Any valuable suggestions.?
    Skylark flag
    suvam giri
    @EuroTraderits going to rain here
    @suvam girihello mate how are you doing today hope you are good welcome
    Trade With Jabo flag
    2460732
    If any positive news about war comes before Monday market open is there a chance this can go back to 4000 levels, i am on long from 4000 levels and now. My account is 53% one more drop and my account is wiped. I can put some money if any chance of recovery.Any valuable suggestions.?
    @Visitor2460732yes i shall help u sir
    Trade With Jabo flag
    IF Anyone need any help in trading send me friend reguest i shall help you
    Đinh Kiên flag
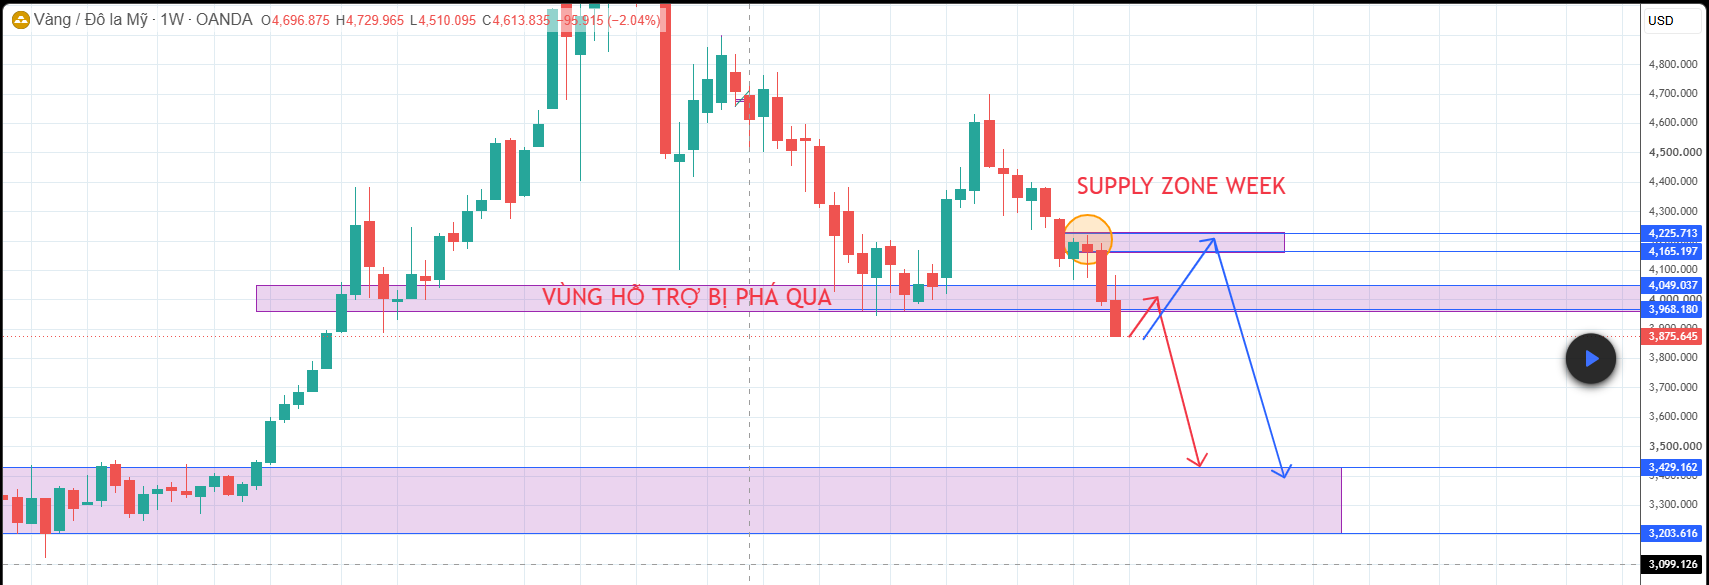
    2. Kịch bản VÀNG trong những tuần tiếp theo - Kịch bản 1 – Tiếp tục giảm trực tiếp: Ngay trong tuần tới, VÀNG có thể tiếp tục chịu áp lực bán và giảm thẳng về các vùng giá thấp hơn, mà không xuất hiện nhịp hồi đáng kể. - Kịch bản 2 – Hồi về vùng kháng cự gần: VÀNG có thể xuất hiện một nhịp hồi lên vùng 3.968 – 4.050. Đây là vùng hỗ trợ cũ đã bị phá vỡ và có khả năng chuyển thành kháng cự. Nếu giá phản ứng tại vùng này, VÀNG có thể tiếp tục quay đầu giảm. - Kịch bản 3 – Hồi sâu về Supply Zone: Trong trường hợp lực hồi mạnh hơn, VÀNG có thể tiếp tục tăng lên SUPPLY ZONE trên khung WEEK, vùng 4.165 – 4.225. Đây là vùng có thể xuất hiện lực bán trở lại. Nếu giá phản ứng và hình thành tín hiệu đảo chiều, xu hướng chính vẫn có thể tiếp tục là giảm. 3. Kết luận - Hiện tại, xu hướng trên khung WEEK vẫn đang nghiêng về phía giảm. Vì vậy, ưu tiên trong vài tuần tới là theo dõi các nhịp hồi lên vùng kháng cự/Supply Zone để tìm tín hiệu tiếp diễn xu hướng giảm, thay vì kỳ vọng VÀNG đảo chiều tăng ngay. - Vùng 3.968 – 4.050 là vùng cần theo dõi trước; nếu giá hồi sâu hơn, chú ý tiếp 4.165 – 4.225. Mục tiêu giảm phía dưới có thể hướng tới 3.200 – 3.400.
    Đinh Kiên flag
    Trade With Jabo flag
    IF Anyone need any help in trading send me friend reguest i shall help you
    Skylark flag
    2460732
    If any positive news about war comes before Monday market open is there a chance this can go back to 4000 levels, i am on long from 4000 levels and now. My account is 53% one more drop and my account is wiped. I can put some money if any chance of recovery.Any valuable suggestions.?
    Bro, I understand the pressure 53% that's heavy. About 4000 again — *nobody can guarantee it before Monday.* Yes, gold is very sensitive to war news. If there's a de-escalation / ceasefire headline over the weekend, we can see a sharp gap DOWN, not up. Gold pumps on fear. Positive war news (peace) usually dumps Gold. So if you're long from 4000, positive news is actually AGAINST your long. Negative war news / escalation would be what pushes Gold back up towards 4000. @Visitor2460732
    Skylark flag
    2460732
    If any positive news about war comes before Monday market open is there a chance this can go back to 4000 levels, i am on long from 4000 levels and now. My account is 53% one more drop and my account is wiped. I can put some money if any chance of recovery.Any valuable suggestions.?
    @Visitor2460732Don't add money to a losing trade just to avoid a margin call.* That's how accounts get fully wiped. Adding money doesn't change the chart, it just makes the loss bigger if it goes lower. Pros call it throwing good money after bad.
    Skylark flag
    2460732
    If any positive news about war comes before Monday market open is there a chance this can go back to 4000 levels, i am on long from 4000 levels and now. My account is 53% one more drop and my account is wiped. I can put some money if any chance of recovery.Any valuable suggestions.?
    @Visitor2460732What is your plan?* If it opens and drops another 1-2%, you said you're wiped. Is it worth risking more capital you can't afford to lose on hope? What most would do in your spot: - Cut the lot size / close half to save the account from liquidation and live to trade another day - Set a hard stop loss where you accept the loss, don't let broker liquidate you - Don't trade the weekend gap — Monday open can be wild with slippage
    Skylark flag
    2460732
    If any positive news about war comes before Monday market open is there a chance this can go back to 4000 levels, i am on long from 4000 levels and now. My account is 53% one more drop and my account is wiped. I can put some money if any chance of recovery.Any valuable suggestions.?
    Not financial advice — just risk management. If you're stressed, step away from the chart for a bit and talk to someone you trust. What was your original stop loss for this trade? @Visitor2460732
    "Trade With Jabo" ยกเลิกข้อความ
    Trade With Jabo flag
    2460732
    If any positive news about war comes before Monday market open is there a chance this can go back to 4000 levels, i am on long from 4000 levels and now. My account is 53% one more drop and my account is wiped. I can put some money if any chance of recovery.Any valuable suggestions.?
    @Visitor2460732@Visitor2460732if u want i will help you sir i shall handle your account i shall change your loss into huge profit only i need your trust big loss recovery soon
    "Trade With Jabo" ยกเลิกข้อความ
    5920320 flag
    Skylark
    Not financial advice — just risk management. If you're stressed, step away from the chart for a bit and talk to someone you trust. What was your original stop loss for this trade? @Visitor2460732
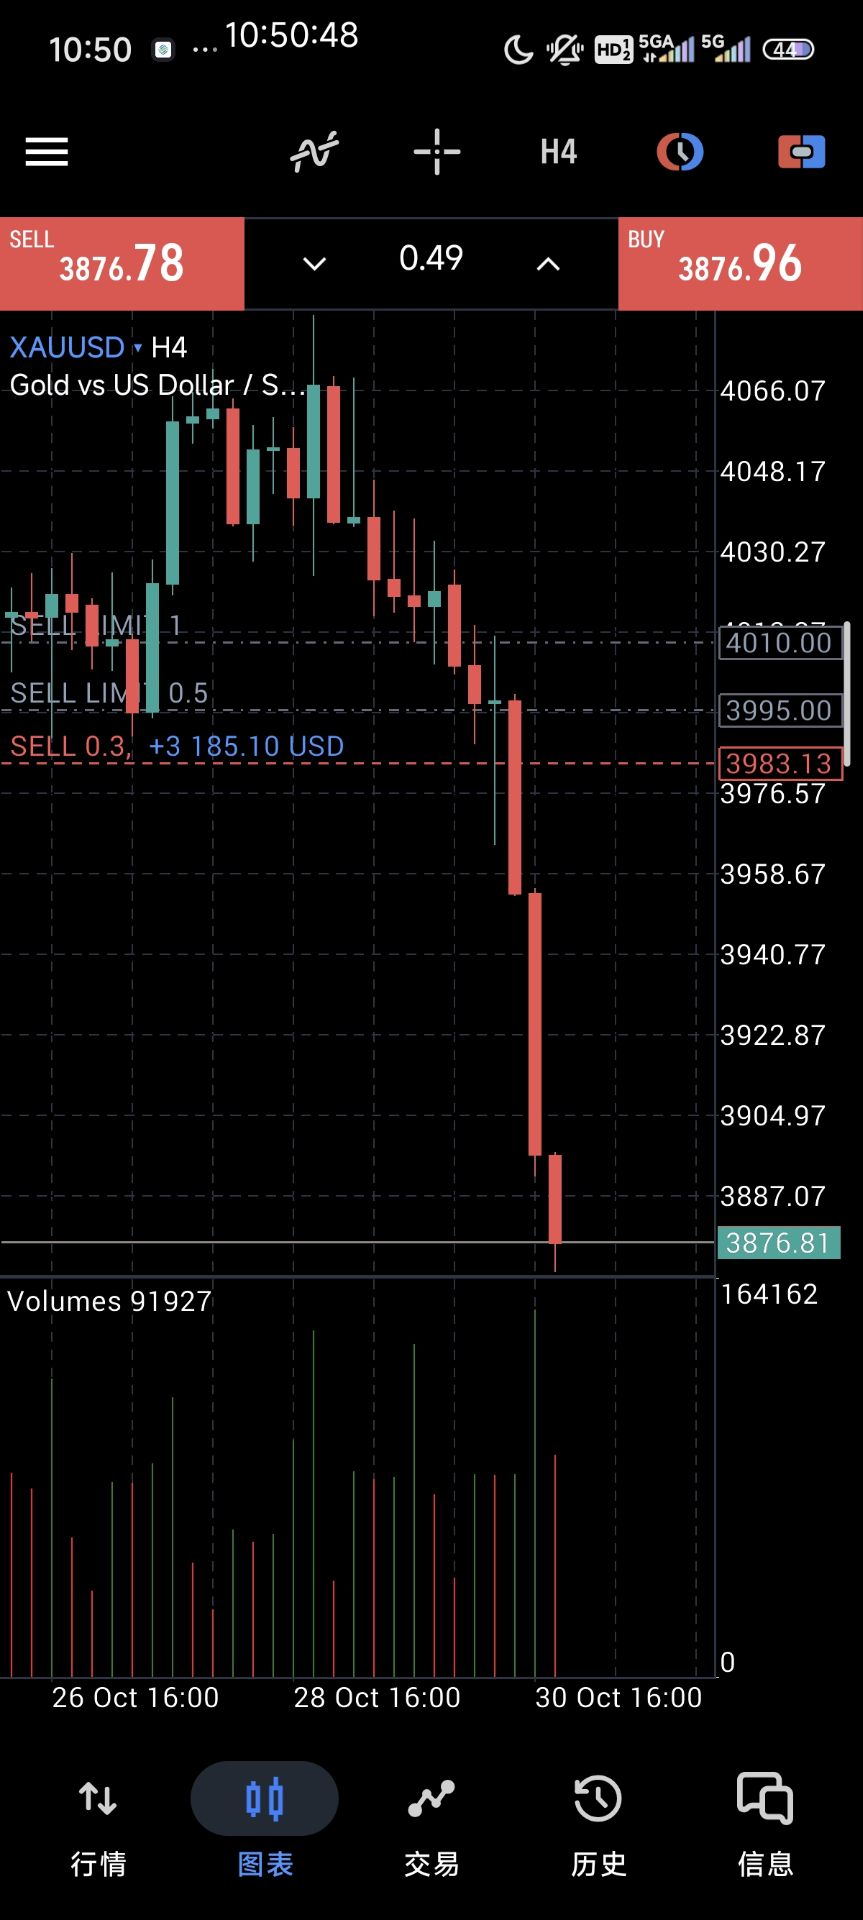
    @Skylark I did not have a stop loss for this trade, could not cut my fingers on time now I guess its time when the throat gets cut due to bad risk management. I get always caught in these big swings down, Down 9850.00 in this trade.
    fulltimetrader flag
    fulltimetrader flag
    5920320
    @Skylark I did not have a stop loss for this trade, could not cut my fingers on time now I guess its time when the throat gets cut due to bad risk management. I get always caught in these big swings down, Down 9850.00 in this trade.
    @游客5920320中国资管
    fulltimetrader flag
    fulltimetrader flag
    5920320
    @Skylark I did not have a stop loss for this trade, could not cut my fingers on time now I guess its time when the throat gets cut due to bad risk management. I get always caught in these big swings down, Down 9850.00 in this trade.
    @游客5920320翻译聊天记录,你就知道了
    พิมพ์ที่นี่...
    เพิ่มชื่อสินทรัพย์หรือรหัส

      ไม่มีข้อมูลที่ตรงกัน

      ทั้งหมด
      แนะนำ
      หุ้น
      สกุลเงินดิจิทัล
      ธนาคารกลาง
      อัปเดตทรัมป์
      ข่าวเด่น
      • ทั้งหมด
      • สงครามรัสเซีย–ยูเครน
      • โฟกัสตะวันออกกลาง
      • ทั้งหมด
      • สงครามรัสเซีย–ยูเครน
      • โฟกัสตะวันออกกลาง
      ค้นหา
      ผลิตภัณฑ์

      กราฟ ฟรีตลอดไป

      แชท Q&A กับผู้เชี่ยวชาญ
      ตัวกรอง ปฏิทินเศรษฐกิจ ข้อมูล เครื่องมือ
      สมาชิก ฟีเจอร์
      ศูนย์ข้อมูล แนวโน้มของตลาด ข้อมูลสถาบัน อัตราดอกเบี้ยของธนาคารกลาง เศรษฐกิจมหภาค

      แนวโน้มของตลาด

      ความเชื่อมั่น สมุดคำสั่งซื้อขาย ความสัมพันธ์ในตลาดฟอเร็กซ์

      ตัวชี้วัดยอดนิยม

      กราฟ ฟรีตลอดไป
      ตลาด

      ข่าวสาร

      24x7 การวิเคราะห์ แหล่งเรียนรู้

      ทัศนคติล่าสุด

      อัปเดตล่าสุด

      สัญญาณ

      คัดลอก อันดับ สัญญาณล่าสุด มาเป็นผู้ให้สัญญาณ การจัดอันดับ AI
      การแข่งขัน
      Brokers

      ภาพรวม โบรกเกอร์ เรตติ้ง อันดับ หน่วยงานควบคุม ข่าวสาร การเรียกร้อง
      รายชื่อโบรกเกอร์ การเปรียบเทียบโบรกเกอร์ฟอเร็กซ์ การเปรียบเทียบสเปรดสด โบรกเกอร์โกง
      Q&A ร้องเรียน วิดีโอแจ้งเตือนการหลอกลวง เคล็ดลับการตรวจจับการหลอกลวง
      เพิ่มเติม

      สำหรับธุรกิจ
      กิจกรรม
      รับสมัครงาน เกี่ยวกับเรา การลงโฆษณา ศูนย์ช่วยเหลือ

      ไวท์เลเบล

      Broker API

      Data API

      ปลั๊กอินเว็บไซต์

      โครงการพันธมิตร

      รางวัล การประเมินสถาบัน IB Seminar กิจกรรม Salon นิทรรศการ
      เวียดนาม ประเทศไทย สิงคโปร์ ดูไบ
      Fans Party เซสชั่นการแบ่งปันการลงทุน
      การประชุมสุดยอด FastBull นิทรรศการ BrokersView
      การค้นหาเมื่อเร็วๆนี้
        คำศัพท์ที่ยอดนิยม
          ตลาด
          การวิเคราะห์
          ผู้ใช้
          24x7
          ปฏิทินเศรษฐกิจ
          แหล่งเรียนรู้
          ข้อมูล
          • ชื่อ
          • ค่าล่าสุด
          • ครั้งก่อน

          ดูผลการค้นหาทั้งหมด

          ไม่มีข้อมูล

          สแกน ดาวน์โหลด

          Faster Charts, Chat Faster!

          ดาวน์โหลด
          • English
          • Español
          • العربية
          • Bahasa Indonesia
          • Bahasa Melayu
          • Tiếng Việt
          • ภาษาไทย
          • Français
          • Italiano
          • Türkçe
          • Русский язык
          • 简中
          • 繁中
          เปิดบัญชี
          ค้นหา
          ผลิตภัณฑ์
          กราฟ ฟรีตลอดไป
          ตลาด
          ข่าวสาร
          สัญญาณ

          คัดลอก อันดับ สัญญาณล่าสุด มาเป็นผู้ให้สัญญาณ การจัดอันดับ AI
          การแข่งขัน
          Brokers

          ภาพรวม โบรกเกอร์ เรตติ้ง อันดับ หน่วยงานควบคุม ข่าวสาร การเรียกร้อง
          รายชื่อโบรกเกอร์ การเปรียบเทียบโบรกเกอร์ฟอเร็กซ์ การเปรียบเทียบสเปรดสด โบรกเกอร์โกง
          Q&A ร้องเรียน วิดีโอแจ้งเตือนการหลอกลวง เคล็ดลับการตรวจจับการหลอกลวง
          เพิ่มเติม

          สำหรับธุรกิจ
          กิจกรรม
          รับสมัครงาน เกี่ยวกับเรา การลงโฆษณา ศูนย์ช่วยเหลือ

          ไวท์เลเบล

          Broker API

          Data API

          ปลั๊กอินเว็บไซต์

          โครงการพันธมิตร

          รางวัล การประเมินสถาบัน IB Seminar กิจกรรม Salon นิทรรศการ
          เวียดนาม ประเทศไทย สิงคโปร์ ดูไบ
          Fans Party เซสชั่นการแบ่งปันการลงทุน
          การประชุมสุดยอด FastBull นิทรรศการ BrokersView

          10 หุ้นปันผลที่ดีที่สุดปี 2026: หุ้นเด่นสำหรับรายได้และการเติบโต

          จ้านเฉิน
          สรุป:

          ค้นพบ 10 หุ้นปันผลที่ดีที่สุดสำหรับปี 2026 รวมถึงหุ้นที่มีผลตอบแทนสูงและหุ้นที่มีศักยภาพในการเติบโตของปันผล เปรียบเทียบผลตอบแทน ความเสี่ยง และศักยภาพในการสร้างรายได้ในระยะยาว

          การค้นหาหุ้นปันผลที่ดีที่สุดในปี 2026 หมายถึงการมองข้ามอัตราผลตอบแทนสูงสุดเพียงอย่างเดียว การจ่ายเงินปันผลจำนวนมากนั้นไม่มีความหมายอะไรหากบริษัทไม่สามารถรักษาระดับการจ่ายเงินปันผลนั้นไว้ได้ หรือราคาหุ้นยังคงลดลงเรื่อยๆ ตั้งแต่แบรนด์สินค้าอุปโภคบริโภคที่มีชื่อเสียงไปจนถึงบริษัทพลังงานและกองทุนอสังหาริมทรัพย์ หุ้นหลายตัวเสนอวิธีการสร้างรายได้จากเงินปันผลที่แตกต่างกัน นี่คือ 10 หุ้นที่น่าจับตามอง
          10 หุ้นปันผลที่ดีที่สุดปี 2026: หุ้นเด่นสำหรับรายได้และการเติบโต_1

          สารบัญ

          • 1. 10 หุ้นปันผลที่ดีที่สุดที่ควรซื้อในปี 2026
          • 2. หุ้นปันผลสูงที่ดีที่สุด เทียบกับ หุ้นปันผลเติบโต
          • 3. วิธีเลือกหุ้นปันผลที่ดีที่สุดในปี 2026
          • 4. คุณจะได้รับผลตอบแทนเท่าใดจากหุ้นปันผล?
          • 5. หุ้นปันผลยังเป็นการลงทุนที่ดีในปี 2026 หรือไม่?
          • 6. หุ้นปันผลตัวไหนดีที่สุดสำหรับปี 2026?

          10 หุ้นปันผลที่ดีที่สุดที่ควรซื้อในปี 2026

          บริษัทที่มีศักยภาพในการจ่ายเงินปันผลสูงที่สุด จะต้องมีกระแสเงินสดที่เชื่อถือได้ หนี้สินที่จัดการได้ และประวัติการจ่ายเงินปันผลที่ดีแก่ผู้ถือหุ้น บางบริษัทอาจให้ผลตอบแทนระยะสั้นที่สูงกว่า ในขณะที่บางบริษัทเน้นการเพิ่มการจ่ายเงินปันผลในระยะยาว

          ภาพรวมหุ้นปันผลที่ดีที่สุดประจำปี 2026

          บริษัทติ๊กเกอร์ภาคส่วนรายละเอียดเงินปันผล
          จอห์นสัน จอห์นสันเจเอ็นเจการดูแลสุขภาพการเติบโตของเงินปันผลในระยะยาว
          พรอคเตอร์ แกมเบิลพีจีสินค้าอุปโภคบริโภคพื้นฐานรายได้เพื่อการป้องกัน
          โคคา-โคล่าWHOเครื่องดื่มการเติบโตของเงินปันผลที่สม่ำเสมอ
          เป๊ปซี่โคเป๊ปซี่อาหารและเครื่องดื่มหุ้นผู้บริโภคที่มีผลตอบแทนสูงกว่า
          รายได้จากอสังหาริมทรัพย์เดอะอสังหาริมทรัพย์เงินปันผลรายเดือน
          เชฟรอนซีวีเอ็กซ์พลังงานความเสี่ยงด้านรายได้และสินค้าโภคภัณฑ์
          เอ็กซอน โมบิลดิบพลังงานการเติบโตของเงินปันผลและกระแสเงินสด
          แอบบีวีเอบีบีวีการดูแลสุขภาพรายได้จากยา
          แมคโดนัลด์เอ็มซีดีร้านอาหารการเติบโตของเงินปันผล
          เน็กซ์เอรา เอนเนอร์จีนีสาธารณูปโภครายได้และการเติบโตในระยะยาว

          หุ้นเหล่านี้เป็นเพียงตัวเลือกสำหรับการวิจัย ไม่ใช่การจัดอันดับตามผลตอบแทนที่คาดหวัง อัตราผลตอบแทนจากเงินปันผลเปลี่ยนแปลงไปตามราคาหุ้น ดังนั้นนักลงทุนควรตรวจสอบอัตราผลตอบแทนปัจจุบันก่อนตัดสินใจซื้อ

          1. Johnson Johnson (JNJ) – ดีที่สุดสำหรับความเสถียรในระยะยาว

          จอห์นสันยังคงเป็นชื่อที่โดดเด่นในด้านการลงทุนในหุ้นปันผล ธุรกิจยาและเทคโนโลยีทางการแพทย์ของบริษัทช่วยให้เข้าถึงตลาดด้านการดูแลสุขภาพซึ่งพึ่งพาวัฏจักรการใช้จ่ายของผู้บริโภคน้อยกว่า

          บริษัทประกาศจ่ายเงินปันผลรายไตรมาสที่ 1.34 ดอลลาร์ต่อหุ้นในเดือนตุลาคม 2026 ซึ่งเทียบเท่ากับ 5.36 ดอลลาร์ต่อหุ้นต่อปีหากคงอัตรานี้ไว้ ประวัติการเพิ่มเงินปันผลอย่างต่อเนื่องทำให้บริษัทนี้เป็นที่น่าสนใจสำหรับนักลงทุนที่ให้ความสำคัญกับความสม่ำเสมอ

          ความเสี่ยงหลักๆ ได้แก่ การหมดอายุของสิทธิบัตร การแข่งขันในอุตสาหกรรมยา และความรับผิดทางกฎหมาย ความต้องการด้านการดูแลสุขภาพอาจยังคงแข็งแกร่ง แต่ยอดขายยาแต่ละชนิดอาจเปลี่ยนแปลงได้อย่างรวดเร็ว

          เหมาะสำหรับ:นักลงทุนที่ต้องการลงทุนในธุรกิจด้านการดูแลสุขภาพที่มีความมั่นคง และต้องการการเติบโตของเงินปันผลในระยะยาว

          2. Procter Gamble (PG) – หุ้นปันผลที่ดีที่สุดสำหรับการลงทุนแบบเน้นความมั่นคง

          บริษัท Procter Gamble เป็นเจ้าของแบรนด์สินค้าในครัวเรือนหลากหลายประเภท ตั้งแต่ผลิตภัณฑ์ซักผ้า ผลิตภัณฑ์ดูแลส่วนบุคคล ผลิตภัณฑ์ดูแลความงาม ไปจนถึงสินค้าใช้ในชีวิตประจำวันอื่นๆ

          ผู้บริโภคยังคงซื้อสินค้าจำเป็นแม้ว่าการเติบโตทางเศรษฐกิจจะชะลอตัวลง ซึ่งทำให้ PG มีรูปแบบธุรกิจที่ค่อนข้างมั่นคง

          ประวัติการเติบโตของเงินปันผลที่ยาวนานหลายทศวรรษสะท้อนให้เห็นถึงความแข็งแกร่งของแบรนด์และเครือข่ายการจัดจำหน่ายของบริษัท

          อย่างไรก็ตาม นักลงทุนควรจับตาดูมูลค่าของบริษัท บริษัทที่น่าเชื่อถืออาจให้ผลตอบแทนที่น่าผิดหวังได้หากซื้อในราคาที่สูงเกินไป

          Best for: Conservative investors who value business stability over maximum yield.

          3. Coca-Cola (KO) – Best for Consistent Dividend Growth

          Coca-Cola has built its business around globally recognized beverage brands and an extensive distribution network.

          Its recurring sales, pricing power, and asset-light bottling arrangements in many markets support cash generation.

          For dividend investors, the attraction is not necessarily a particularly high starting yield. It is the company's ability to maintain and gradually increase shareholder distributions.

          Risks include changing consumer preferences, currency fluctuations, and pressure from health-conscious purchasing trends.

          Best for: Long-term investors seeking predictable income growth.

          4. PepsiCo (PEP) – Best Consumer Stock for Higher Income

          PepsiCo offers exposure to both beverages and packaged foods, including brands such as Pepsi, Gatorade, Lay's, and Doritos.

          This diversification helps distinguish it from beverage-focused competitors.

          In July 2026, PepsiCo confirmed a quarterly dividend of $1.48 per share, representing an annualized rate of $5.92. The company also reported its 54th consecutive annual dividend increase.

          PepsiCo's yield has been relatively attractive among established consumer staples companies, although investors must consider slowing volume growth, input costs, and debt.

          Best for: Income-focused investors who want exposure to established consumer brands.

          5. Realty Income (O) – Best Monthly Dividend Stock

          Realty Income stands out because it distributes dividends monthly rather than quarterly.

          The real estate investment trust (REIT) owns a diversified portfolio of commercial properties leased to tenants under long-term agreements.

          Its rental income supports regular distributions, making the stock appealing to investors who prefer frequent payments.

          However, Realty Income is sensitive to borrowing costs and property valuations. Higher interest rates can make acquisitions more expensive and reduce the appeal of REIT shares relative to bonds.

          Tenant financial health also matters.

          Best for: Investors seeking monthly dividend income and real estate exposure.

          6. Chevron (CVX) – Best Energy Dividend Stock

          Chevron provides exposure to oil and natural gas production, refining, and related energy operations.

          Its integrated business model can help cushion fluctuations across different parts of the energy market.

          Dividend investors may appreciate Chevron's established payout record and potential to generate substantial cash flow when commodity markets are favorable.

          The drawback is unavoidable: oil and gas prices are volatile. Falling energy prices can reduce profits and limit dividend growth.

          Best for: Investors comfortable with commodity cycles who want energy-sector income.

          7. Exxon Mobil (XOM) – Best for Energy Cash Flow

          Exxon Mobil is another major energy company with a long dividend history.

          Its operations span oil production, natural gas, refining, chemicals, and other energy activities.

          Scale, diversified operations, and disciplined capital spending can support shareholder distributions through changing market conditions.

          Still, Exxon is not immune to weak commodity prices, expensive development projects, or regulatory pressure.

          Investors comparing Exxon and Chevron should examine free cash flow, capital expenditure commitments, and dividend coverage rather than choosing solely by yield.

          Best for: Long-term investors seeking energy exposure with an established dividend record.

          8. AbbVie (ABBV) – Best Pharmaceutical Dividend Stock

          AbbVie offers an income opportunity within the pharmaceutical industry.

          Its portfolio includes immunology, oncology, neuroscience, and other therapeutic areas.

          The company has worked to reduce reliance on Humira as newer medicines, including Skyrizi and Rinvoq, contribute more to its business.

          Future dividend growth depends partly on whether these products can offset competition and support continued earnings expansion.

          Drug pricing pressure, regulatory decisions, and research setbacks remain important risks.

          Best for: Investors seeking pharmaceutical exposure with income potential.

          9. McDonald's (MCD) – Best Dividend Stock for Global Brand Strength

          McDonald's operates one of the world's largest restaurant systems.

          Its heavily franchised model generates revenue from royalties, rent, and franchise-related payments, reducing its direct exposure to some restaurant operating costs.

          That structure helps support cash generation and long-term dividend payments.

          However, consumer spending pressure, rising operating costs for franchisees, and competition can affect sales.

          The stock's valuation also matters because investors often pay a premium for its established brand.

          Best for: Investors seeking dividend growth from a global consumer business.

          10. NextEra Energy (NEE) – Best for Utility Dividend Growth

          NextEra Energy combines regulated utility operations with a significant energy infrastructure and renewables business.

          Its regulated utility activities provide a relatively stable earnings foundation, while investments in electricity generation and infrastructure offer growth opportunities.

          That combination can appeal to investors who want more than a traditional high-yield utility.

          The trade-off is substantial capital spending. Financing costs, regulatory decisions, and project execution can influence future dividend growth.

          Best for: Investors seeking a combination of utility income and long-term growth.

          Best High-Yield Dividend Stocks vs. Dividend Growth Stocks

          Not every dividend investor wants the same thing.

          Someone relying on investment income today may prefer a higher starting yield. A younger investor reinvesting dividends may benefit more from companies that consistently increase payouts.

          Investment GoalStocks to ResearchMain Consideration
          Higher current incomeRealty Income, PepsiCoYield sustainability
          Dividend growthPG, Coca-Cola, McDonald'sValuation and growth
          Defensive incomeJohnson Johnson, PGEarnings stability
          Energy incomeChevron, Exxon MobilCommodity volatility
          Growth plus dividendsNextEra Energy, AbbVieCapital needs and execution

          A high yield is not automatically a bargain. Sometimes it rises because investors expect the company's financial position to deteriorate.

          For context, the SP 500 Dividend Aristocrats Index tracks companies that have increased dividends for at least 25 consecutive years. That history is useful when screening for established dividend payers, although it does not guarantee future payments.

          How to Choose the Best Dividend Stocks in 2026

          Dividend Yield and Payout Ratio

          Dividend yield shows how much annual income a stock pays relative to its current price.

          Dividend Yield = Annual Dividend per Share ÷ Stock Price × 100

          For example, a stock trading at $100 with a $4 annual dividend has a 4% yield.

          The payout ratio indicates how much of a company's earnings are distributed as dividends. An unusually high ratio may suggest limited room for future increases, although acceptable levels differ by industry.

          For REITs, funds from operations and adjusted funds from operations are generally more informative than ordinary earnings alone.

          Free Cash Flow and Debt

          Dividends ultimately require cash.

          Companies with consistent free cash flow, manageable debt, and reasonable capital spending obligations are generally better positioned to maintain distributions.

          A long dividend history is encouraging, but investors should still review the latest financial statements.

          Dividend Growth and Valuation

          A stock yielding 2.5% with strong dividend growth may eventually generate more income than a stock yielding 5% with no increases.

          But growth alone does not justify any purchase price.

          Investors should compare earnings multiples, cash flow, debt, and business prospects before buying.

          How Much Can You Earn From Dividend Stocks?

          Dividend income depends on the amount invested and the portfolio's average yield.

          The following examples assume a constant yield, no dividend reinvestment, and no taxes.

          Investment3% Yield4% Yield5% Yield
          $5,000$150$200$250
          $10,000$300$400$500
          $25,000$750$1,000$1,250
          $50,000$1,500$2,000$2,500
          $100,000$3,000$4,000$5,000

          These are hypothetical annual amounts, not forecasts. Actual dividends can increase, decrease, or stop entirely.

          Dividend reinvestment can increase the number of shares owned over time, potentially strengthening future income. However, it also increases exposure to the underlying stocks.

          Are Dividend Stocks a Good Investment in 2026?

          Dividend stocks can be attractive in 2026, particularly for investors seeking income without depending entirely on share-price appreciation.

          However, their relative appeal depends partly on interest rates and bond yields.

          เมื่อพันธบัตรรัฐบาลให้ผลตอบแทนที่แข่งขันได้ นักลงทุนอาจเรียกร้องผลตอบแทนที่สูงขึ้นจากหุ้นปันผลเพื่อชดเชยความเสี่ยงด้านส่วนของผู้ถือหุ้น ซึ่งอาจส่งผลให้ราคาหุ้นลดลง โดยเฉพาะอย่างยิ่งในกลุ่มสาธารณูปโภคและกองทุนอสังหาริมทรัพย์ (REITs)

          ในทางกลับกัน ต้นทุนทางการเงินที่ต่ำลงอาจเป็นประโยชน์ต่อภาคส่วนที่มุ่งเน้นรายได้บางกลุ่ม

          นักลงทุนควรจำไว้ด้วยว่าเงินปันผลเป็นเพียงส่วนประกอบหนึ่งของผลตอบแทนรวมเท่านั้น

          หุ้นที่มีผลตอบแทน 6% หากมูลค่าลดลง 15% ก็ยังคงส่งผลให้ผลตอบแทนโดยรวมติดลบได้

          การกระจายความเสี่ยงเป็นสิ่งสำคัญ การมุ่งเน้นเฉพาะกองทุนอสังหาริมทรัพย์ที่ให้ผลตอบแทนสูง บริษัทสาธารณูปโภค หรือบริษัทพลังงาน จะสร้างความเสี่ยงเฉพาะด้านขึ้นมา

          หุ้นปันผลตัวไหนดีที่สุดสำหรับปี 2026?

          ทางเลือกที่ดีที่สุดขึ้นอยู่กับว่าสิ่งที่คุณให้ความสำคัญคือรายได้ในทันที การเติบโตของเงินปันผล หรือทั้งสองอย่างรวมกัน

          เพื่อความสม่ำเสมอในระยะยาว บริษัท Johnson Johnson, Procter Gamble และ Coca-Cola ยังคงเป็นตัวเลือกที่น่าสนใจสำหรับการวิจัย ส่วน PepsiCo และ Realty Income อาจดึงดูดนักลงทุนที่ต้องการผลตอบแทนในปัจจุบันที่สูงกว่า ขณะที่ Chevron และ Exxon Mobil นำเสนอการลงทุนในภาคพลังงานที่น่าสนใจ

          บริษัท AbbVie, McDonald's และ NextEra Energy นำเสนอรูปแบบการเติบโตทางธุรกิจและการจ่ายเงินปันผลให้แก่ผู้ถือหุ้นที่แตกต่างกันออกไป

          แทนที่จะไล่ตามอัตราผลตอบแทนเงินปันผลที่สูงที่สุด ควรเน้นไปที่บริษัทที่สามารถสร้างกระแสเงินสดได้เพียงพอต่อการจ่ายเงินปันผลอย่างต่อเนื่อง

          สรุปแล้วหุ้นปันผลที่ดีที่สุดสำหรับปี 2026 ไม่จำเป็นต้องเป็นหุ้นที่จ่ายปันผลมากที่สุดในปัจจุบัน แต่เป็นหุ้นที่สามารถจ่ายปันผลได้อย่างต่อเนื่องพร้อมทั้งรักษาความมั่นคงทางการเงินในระยะยาวได้

          บทความนี้มีวัตถุประสงค์เพื่อให้ข้อมูลเท่านั้นและไม่ใช่คำแนะนำด้านการลงทุน ราคาหุ้น ผลตอบแทน และสถานะทางการเงินของบริษัทอาจเปลี่ยนแปลงได้

          คำเตือนความเสี่ยงและข้อจำกัดความรับผิดชอบในการลงทุน
          ตลาดมีความเสี่ยง การลงทุนจำเป็นต้องระมัดระวัง เนื้อหาของบทความนี้มีไว้สำหรับอ้างอิงเท่านั้น และไม่ได้ถือเป็นคำแนะนำในการลงทุนส่วนบุคคล และไม่ได้คำนึงถึงเป้าหมายการลงทุนพิเศษ สถานะทางการเงินหรืออื่นๆของบุคคล ลงทุนตามนั้น ต้องรับผิดชอบความเสี่ยงของคุณเอง
          รายการโปรด
          แชร์
          FastBull
          ลิขสิทธิ์ © 2026 FastBull Ltd

          728 RM B 7/F GEE LOK IND BLDG NO 34 HUNG TO RD KWUN TONG KLN HONG KONG

          TelegramInstagramTwitterfacebooklinkedin
          App Store Google Play Android Windows
          ผลิตภัณฑ์
          กราฟ

          แชท

          Q&A กับผู้เชี่ยวชาญ
          ตัวกรอง
          ปฏิทินเศรษฐกิจ
          ข้อมูล
          เครื่องมือ
          สมาชิก
          ฟีเจอร์
          ฟังก์ชั่น
          ตลาด
          ธุรกรรมคัดลอก
          สัญญาณล่าสุด
          การแข่งขัน
          24x7
          การวิเคราะห์
          แหล่งเรียนรู้
          บริษัท
          รับสมัครงาน
          เกี่ยวกับเรา
          ติดต่อเรา
          การลงโฆษณา
          ดาวน์โหลด FastBull
          ศูนย์ช่วยเหลือ
          ข้อเสนอแนะ
          ข้อตกลงผู้ใช้
          นโยบายความเป็นส่วนตัว
          นโยบายความเป็นส่วนตัว
          สำหรับธุรกิจ

          ไวท์เลเบล

          Broker API

          Data API

          ปลั๊กอินเว็บไซต์

          เครื่องมือออกแบบโปสเตอร์

          โครงการพันธมิตร

          การเปิดเผยความเสี่ยง

          ความเสี่ยงของการสูญเสียในการซื้อขายสินทรัพย์ทางการเงิน เช่น หุ้น FX สินค้าโภคภัณฑ์ ฟิวเจอร์ส พันธบัตร ETFs หรือเงินดิจิทัลอาจมีมาก คุณอาจสูญเสียเงินทุนทั้งหมดที่คุณฝากไว้กับโบรกเกอร์ของคุณ ดังนั้น คุณควรพิจารณาอย่างรอบคอบว่าการซื้อขายดังกล่าวเหมาะสมกับคุณหรือไม่ในสถานการณ์และทรัพยากรทางการเงินของคุณ

          ไม่ควรตัดสินใจลงทุนโดยไม่ได้ดำเนินการตรวจสอบสถานะอย่างละเอียดถี่ถ้วนด้วยตัวเองหรือปรึกษากับที่ปรึกษาทางการเงินของคุณ เนื้อหาเว็บของเราอาจไม่เหมาะกับคุณเนื่องจากเราไม่ทราบเงื่อนไขทางการเงินและความต้องการในการลงทุนของคุณ ข้อมูลทางการเงินของเราอาจมีความล่าช้าหรือมีความไม่ถูกต้อง ดังนั้นคุณควรรับผิดชอบอย่างเต็มที่ต่อการตัดสินใจซื้อขายและการลงทุนของคุณ บริษัทจะไม่รับผิดชอบต่อการสูญเสียเงินทุนของคุณ

          หากไม่ได้รับอนุญาตจากเว็บไซต์ คุณจะไม่สามารถคัดลอกกราฟิก ข้อความ หรือเครื่องหมายการค้าของเว็บไซต์ได้ สิทธิ์ในทรัพย์สินทางปัญญาในเนื้อหาหรือข้อมูลที่รวมอยู่ในเว็บไซต์นี้เป็นของผู้ให้บริการและผู้ค้าแลกเปลี่ยน

          ไม่ได้ล็อกอิน

          เข้าสู่ระบบเพื่อเข้าถึงฟังก์ชั่นเพิ่มเติม

          เชื่อมต่อโบรกเกอร์
          มาเป็นผู้ให้สัญญาณ
          ศูนย์ช่วยเหลือ
          บริการลูกค้า
          โหมดมืด
          สีขึ้นและลง

          เข้าสู่ระบบ

          ลงทะเบียน

          แถบข้าง
          เลย์เอาท์
          เต็มหน้าจอ
          ตั้งค่าเริ่มต้นเป็นกราฟ
          หน้ากราฟจะเปิดขึ้นตามค่าเริ่มต้นเมื่อคุณเข้า fastbull.com