


Daily Technical Analysis: [29 MAY]
1. AUD/USD Analysis:
News Summary:
Australia’s Consumer Price Index (CPI) rose 0.4% month-over-month in April, while the annual inflation rate eased to 4.2% from 4.6%, coming in below market expectations of 0.6% monthly growth and 4.4% annual inflation. The trimmed mean CPI, the Reserve Bank of Australia’s preferred measure of underlying inflation, increased 0.3% on the month, in line with expectations. However, its annual rate accelerated to 3.4%, the highest level since late 2024, remaining above the Reserve Bank of Australia’s target range of 2% to 3%. With Australia’s unemployment rate having risen sharply in March, markets increasingly expect the RBA to pause its interest-rate hiking cycle despite persistent underlying inflation pressures. The softer headline inflation reading has eased concerns about further immediate policy tightening, although elevated core inflation suggests policymakers are likely to remain cautious.
Trend Analysis:
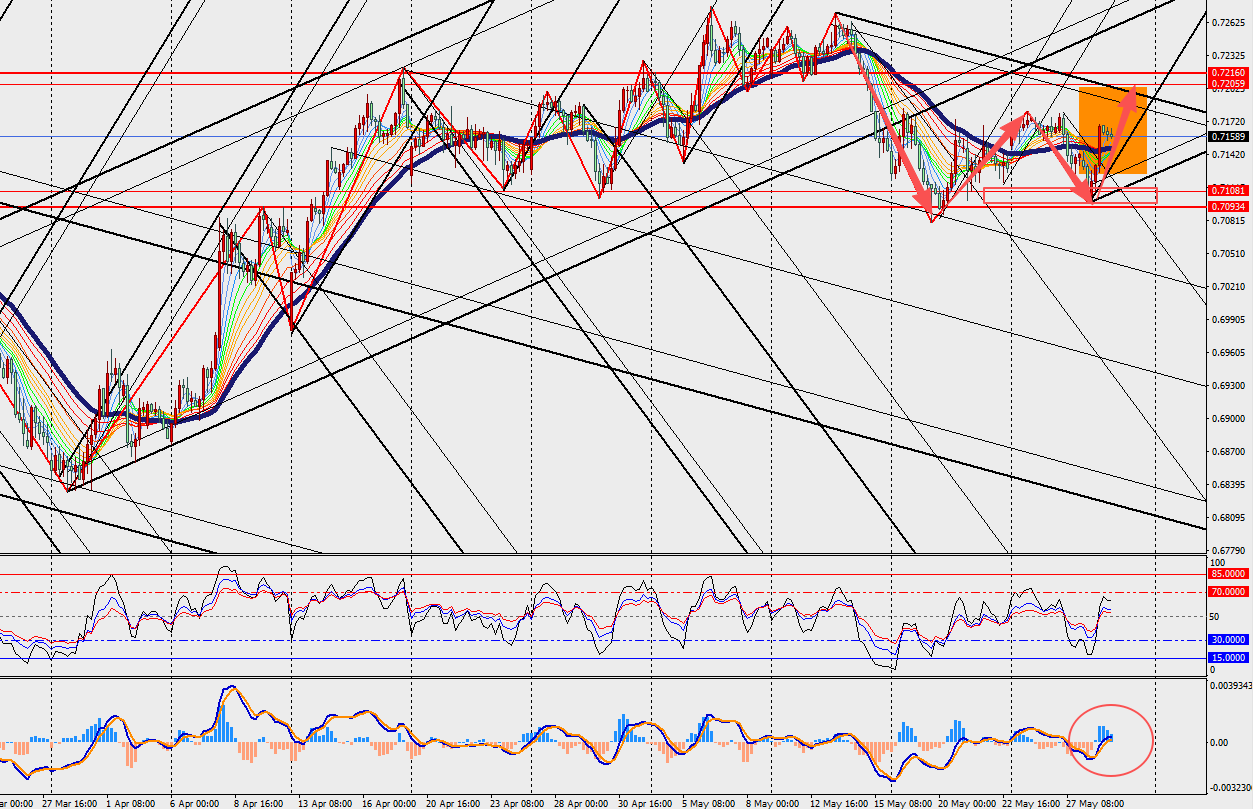
We can see AUD/USD has staged a strong rebound on the H4 chart and is currently trading above the 48 hours moving average. Meanwhile, both the MACD double lines and histogram bars are contracting near the zero line. The buy limit could be set, stop loss is necessary.
Today's Key Price Levels:
Key Support Levels: [0.7100]
Key Resistance Levels: [0.7220]
Pivot Points [0.7130]
2.Crude Oil Analysis:
News Summary:
Exxon Mobil warned on Thursday that global crude oil inventories could fall to historically low levels in the coming weeks, potentially triggering a sharp surge in oil prices and eventually dampening demand. According to the company, stockpiles are expected to decline to extremely tight levels, although there remains debate over whether this threshold will be reached in two weeks or three. Once inventories approach that critical point, oil prices could rise rapidly due to tightening supply conditions. However, Exxon noted that as crude prices climb to sufficiently high levels, demand destruction is likely to emerge, helping to restore balance to the market. Higher energy costs typically weigh on consumption and industrial activity, reducing demand growth and easing pressure on supplies over time.
Trend Analysis:
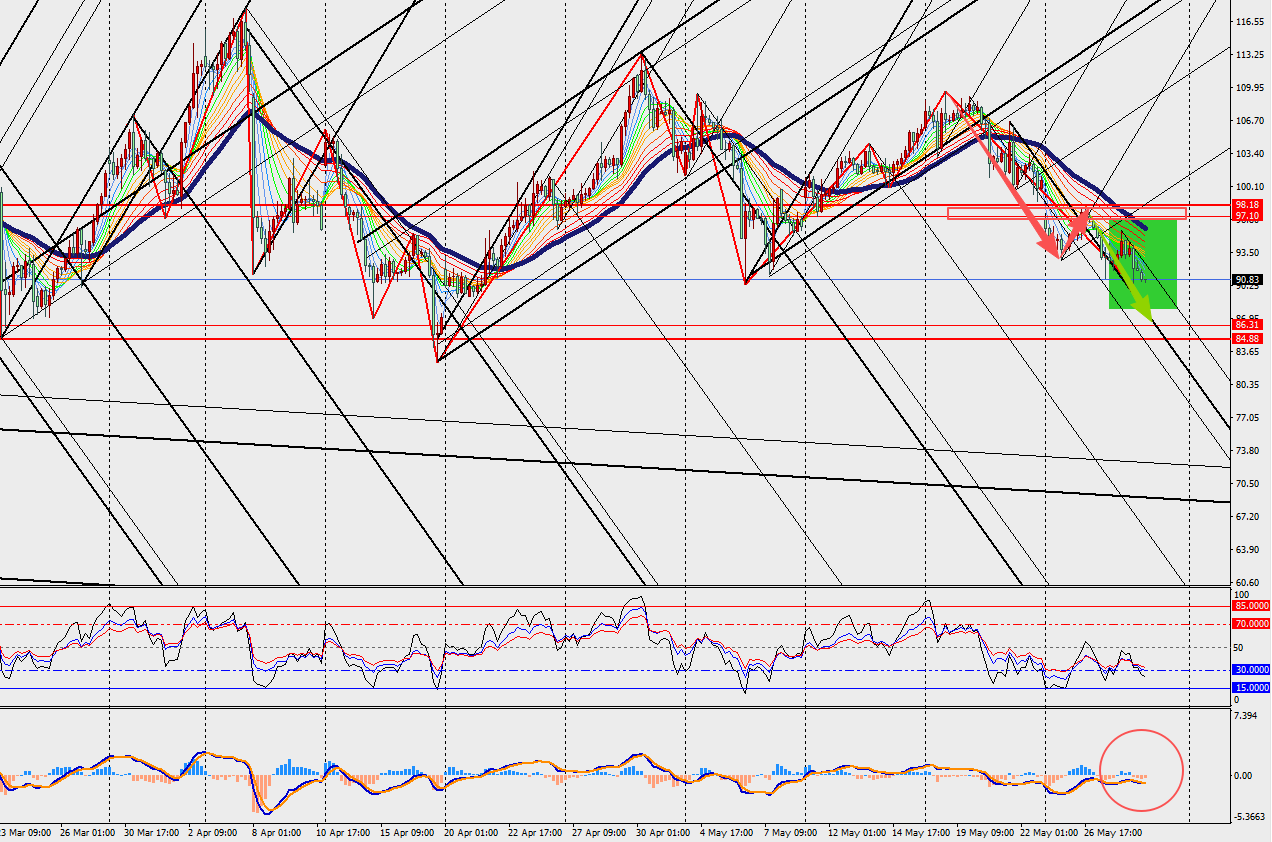
On the H4 chart, we can see crude oil has pulled back again and continues to trade below the 48 hours moving average. In addition, the MACD double lines and energy bars are expanding below the zero axis. The sell limit could be placed, stop loss is mandatory.
Today's Key Price Levels:
Key Support Levels: [85.00]
Key Resistance Levels: [97.00]
Pivot Points [94.00]







著作権 © 2026 FastBull Ltd


リスク警告
FX取引はリスクが高く、すべての投資家に適しているわけではありません。レバレッジを利用するとさらなるリスクと損失が生じます。取引する前に、投資目的、経験レベル、リスク許容度を慎重に検討してください。初期投資の一部または全部を失う可能性があります。余裕のないお金は投資しないでください。FX取引に伴うリスクについてよく理解してください。ご質問がある場合は、独立した財務または税務アドバイザーにご相談ください。あらゆるデータと情報は「現状のまま」提供され、情報提供のみを目的としており、取引や推奨のために提供されるものではありません。過去のパフォーマンスは将来の結果を予測するものではありません。
免責事項
このウェブサイトに含まれるデータはリアルタイムかつ正確ではない可能性があります。このサイトのデータと価格は必ずしも市場や取引所から提供されているわけではなく、マーケットメーカーによって提供されている場合があるため、価格は不正確であり、実際の市場価格とは異なる場合があります。つまり、この価格は市場動向を反映するための参考価格であり、取引目的には不利です。ウェブサイトに含まれるデータの提供者は、お客様の取引活動またはウェブサイトに含まれる情報への依存の結果として被った損失に対して責任を負いません。