


- EURUSD
- XAUUSD
- XAGUSD
- WTI
- USDX


行情
分析
用户
快讯
财经日历
学习
数据
- 名称
- 最新值
- 前值









 @Sanjeev Ku





Key takeaways:
Bitcoin price rose 1.5% to over $115,000, with onchain indicators suggesting market momentum is picking up.
BTC must hold above $115,000 to secure the recovery, with resistance at $116,000-$121,000.
Bitcoin price was up on Friday, rising 1.5% over the past 24 hours to trade above $115,000. Several technical and onchain indicators suggest the BTC market is “advancing on firmer footing” to higher levels, according to Glassnode.
Bitcoin derivatives “set the tone” for BTC price
Bitcoin’s ability to stage a sustained recovery has been curtailed by weak spot demand and softening ETF inflows.
“Attention now shifts to derivatives markets, which often set the tone when spot flows weaken,” Glassnode wrote in its latest Week Onchain report.
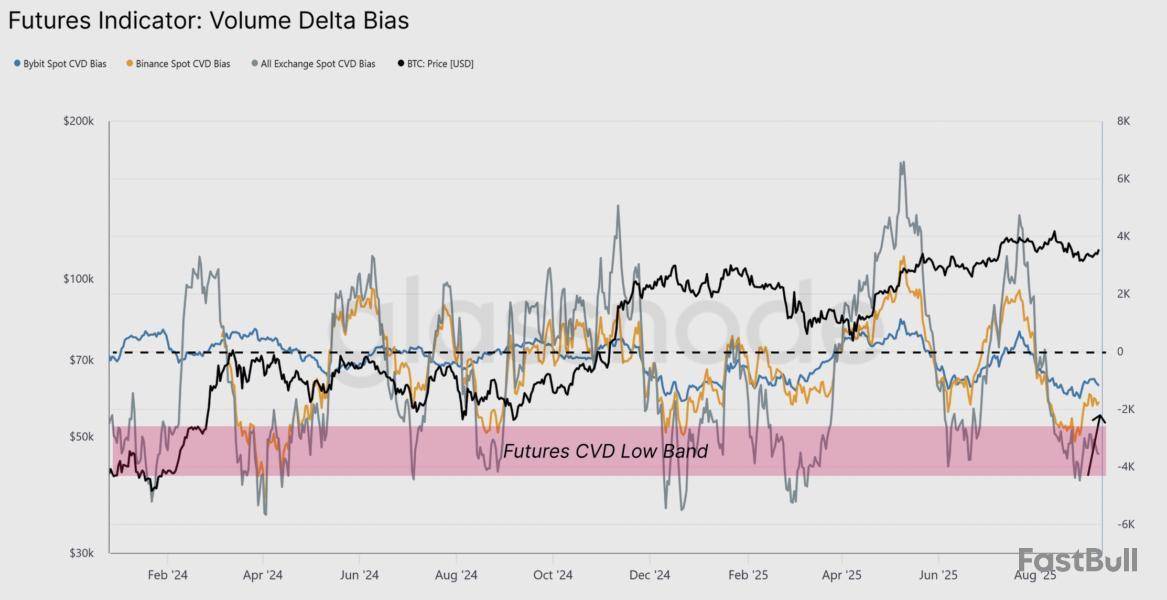
The chart below shows that Bitcoin’s volume delta bias, measuring the imbalance between buying and selling pressure, recovered during the rebound from $108,000, signaling seller exhaustion across exchanges like Binance and Bybit.
This suggests that futures traders “helped absorb recent sell pressure,” said the market intelligence firm, adding:
Meanwhile, options open interest (OI) reached $54.6 billion, an all-time high, up 26% from $43 billion on Sept. 1. This reflects growing investor interest in the derivatives market, which can positively affect BTC price.
Note that when options OI reached its previous record high in mid-August, it was accompanied by Bitcoin's rise to new all-time highs above $124,500.
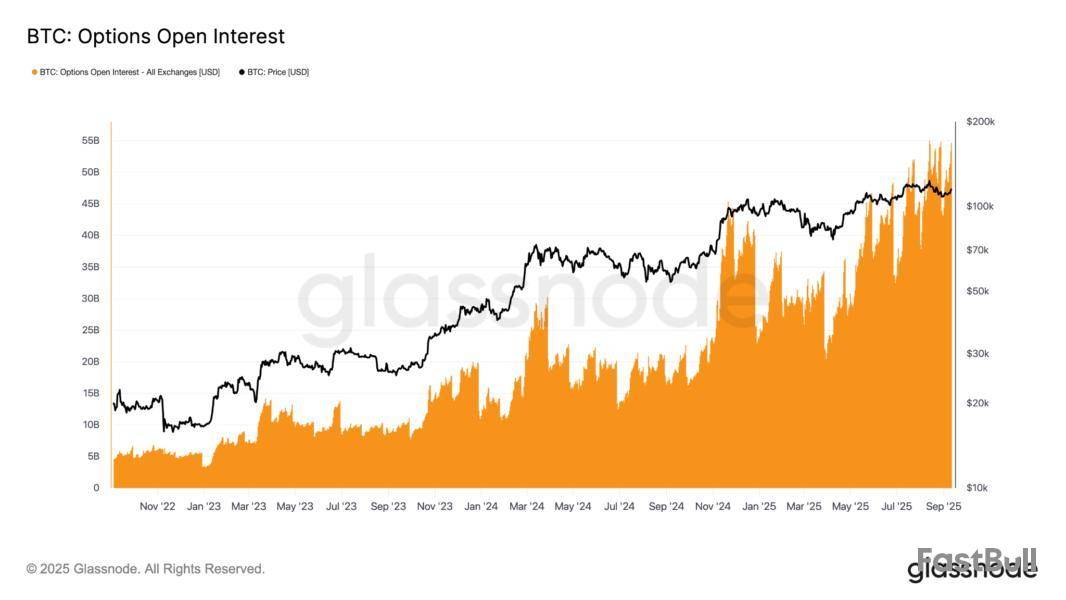
Additional options OI data shows a clear bias toward calls over puts, “highlighting a market that leans bullish while still managing downside risk,” Glassnode said, adding:
As Cointelegraph reported, Bitcoin’s $4.3 billion options expiry on Friday favors bullish bets, and could open the door for BTC rally to $120,000 as long as the price stays above $113,000.
Key Bitcoin price levels to watch next
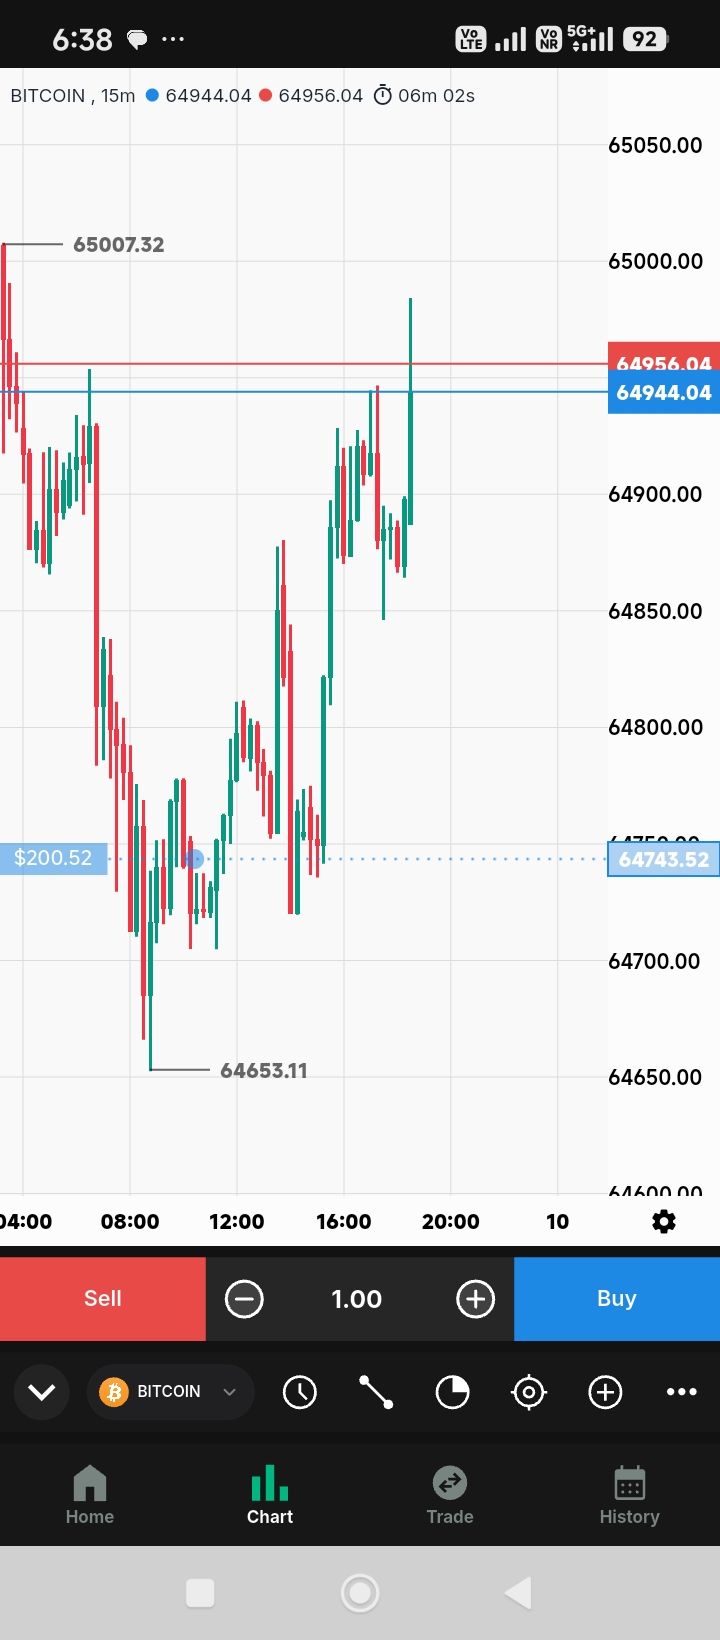
Data from Cointelegraph Markets Pro and TradingView shows Bitcoin price trading at $115,400 after running into resistance around $116,000. The pair must hold above $115,000 for a sustained recovery.
There is a major supply zone stretching from $116,000 to $121,000, which Bitcoin will have to overcome to continue its uptrend toward all-time highs.
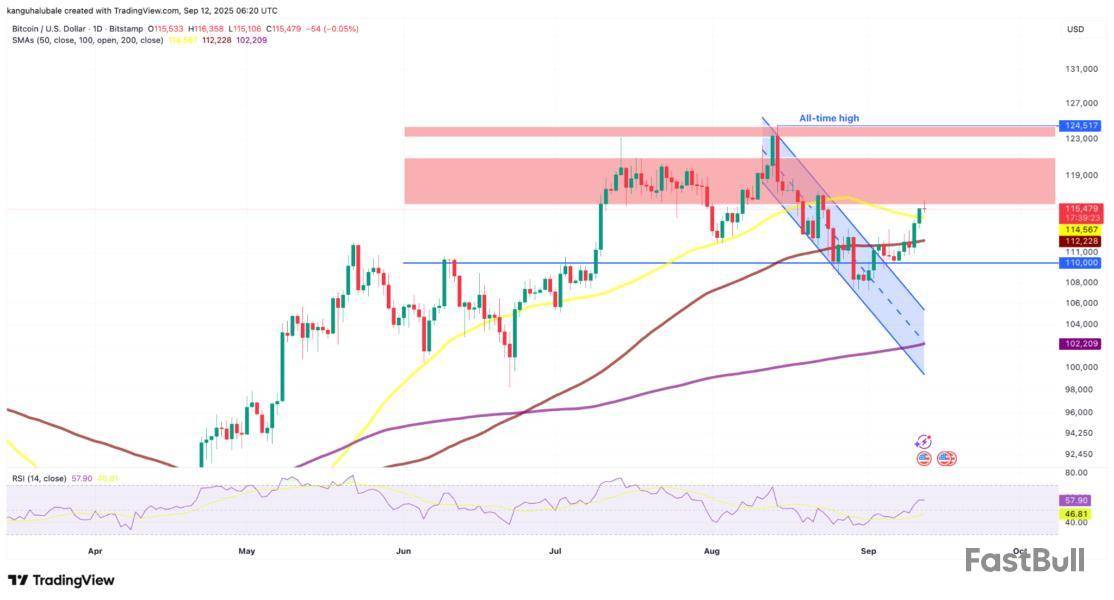
Conversely, the bears will attempt to defend the $116,000 level and push the price back down. A key area of interest lies between $114,500, where the 50-day simple moving average (SMA) currently sits, and $112,200, embraced by the 100-day SMA.
Another area of importance stretches from the local low at $107,200 (reached on Sept. 1) to the $110,000 psychological level.
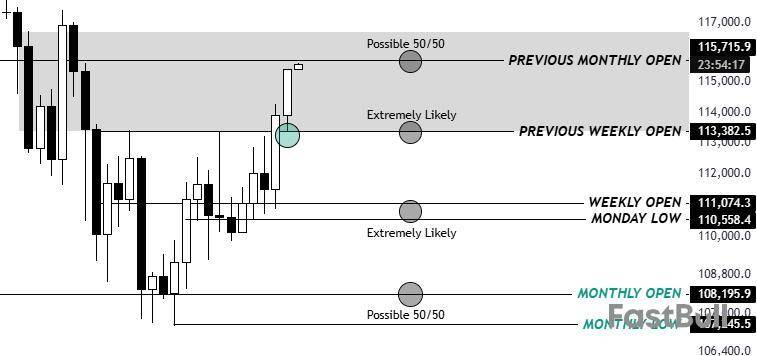
Bitcoin is “now pushing to the previous monthly open,” said pseudonymous trader KillaXBT in an analysis on X, referring to the August open around $115,700.
The liquidation heatmap shows the liquidity clusters between $116,400 and $117,000, per data from CoinGlass.
If broken, this level could spark a liquidation squeeze, forcing short sellers to close positions and driving prices toward $120,000.
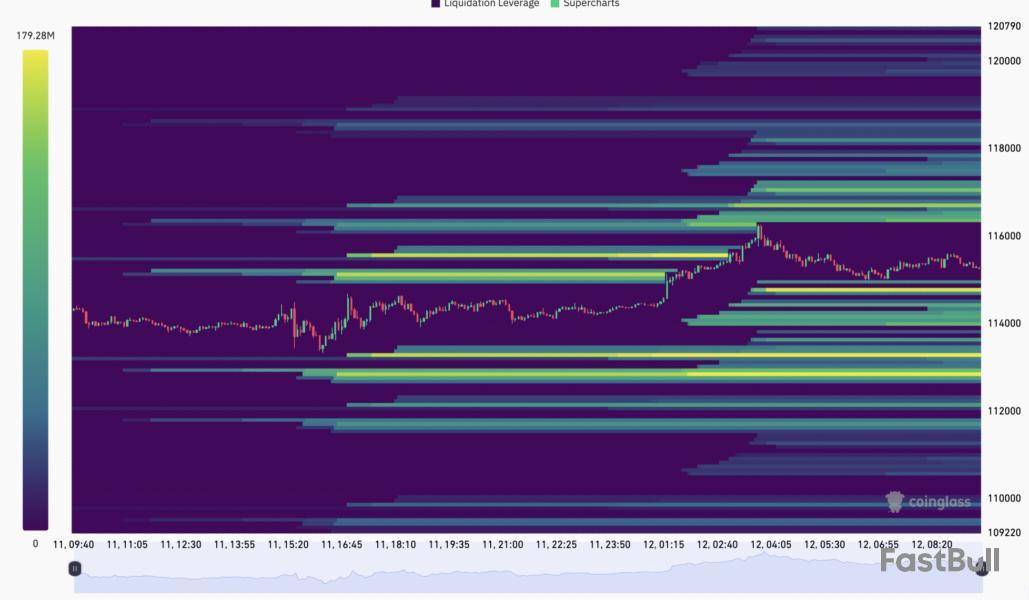
On the downside, heavy bid orders are sitting around $114,700, with the next major cluster sitting between $113,500 down to $112,000.
This article does not contain investment advice or recommendations. Every investment and trading move involves risk, and readers should conduct their own research when making a decision.

728 RM B 7/F GEE LOK IND BLDG NO 34 HUNG TO RD KWUN TONG KLN HONG KONG





交易股票、货币、商品、期货、债券、基金等金融工具或加密货币属高风险行为,这些风险包括损失您的部分或全部投资金额,所以交易并非适合所有投资者。
做出任何财务决定时,应该进行自己的尽职调查,运用自己的判断力,并咨询合格的顾问。本网站的内容并非直接针对您,我们也未考虑您的财务状况或需求。本网站所含信息不一定是实时提供的,也不一定是准确的。本站提供的价格可能由做市商而非交易所提供。您做出的任何交易或其他财务决定均应完全由您负责,并且您不得依赖通过网站提供的任何信息。我们不对网站中的任何信息提供任何保证,并且对因使用网站中的任何信息而可能造成的任何交易损失不承担任何责任。
未经本站书面许可,禁止使用、存储、复制、展现、修改、传播或分发本网站所含数据。提供本网站所含数据的供应商及交易所保留其所有知识产权。


