


- XAUUSD
- XAGUSD
- WTI


行情
分析
用户
快讯
财经日历
学习
数据
- 名称
- 最新值
- 前值




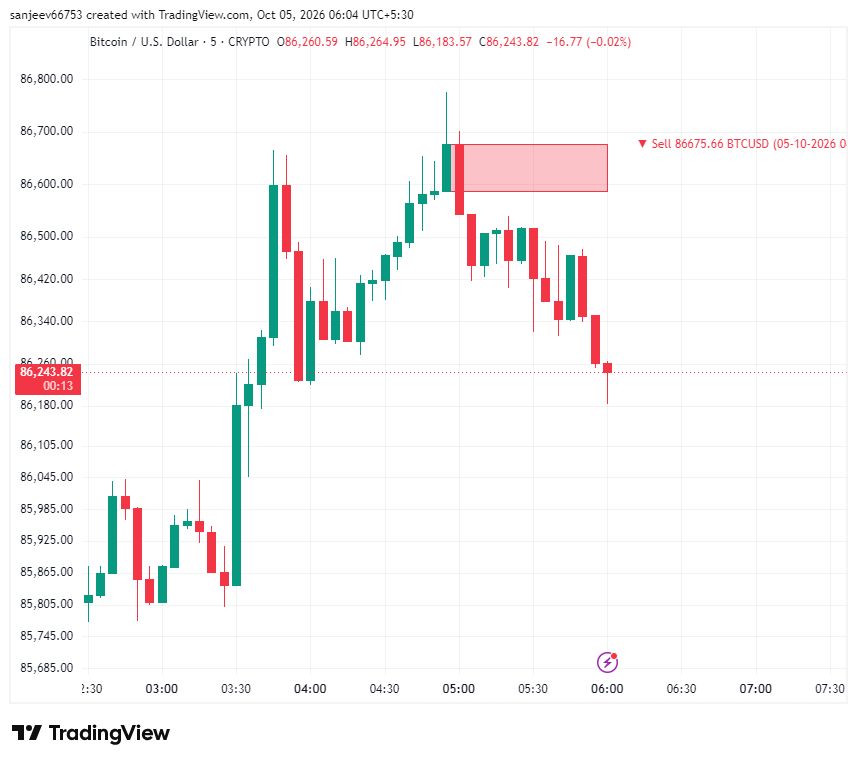

Over the past trading week, Bitcoin (BTC) failed to make any significant price breakout, experiencing rejections at the $86,000 price region. While the market suffered no major price pullback, the high level of sideways price movement indicates a strong investor uncertainty.
Interestingly, popular market analyst with X username Daan Crypto has provided an insightful technical analysis on the BTC market, highlighting the present barriers that are restricting an upward price movement.
Bitcoin Multiple Barriers: 200-Day EMA, 200-Day MA, And Diagonal Trendline In Focus
Since hitting a new all-time high in late January, Bitcoin has slipped into heavy correction, losing over 22% of its market price. The majority of the price loss has been linked to international trade tariff crises, which have forced investors to seek relief in less risky assets.
However, a pause in new tariffs and an onset in global negotiations soon accompanied a price rebound seen in early April. Albeit, Bitcoin is now struggling to break out of the $84,000-$86,000, forming a tight consolidation range.
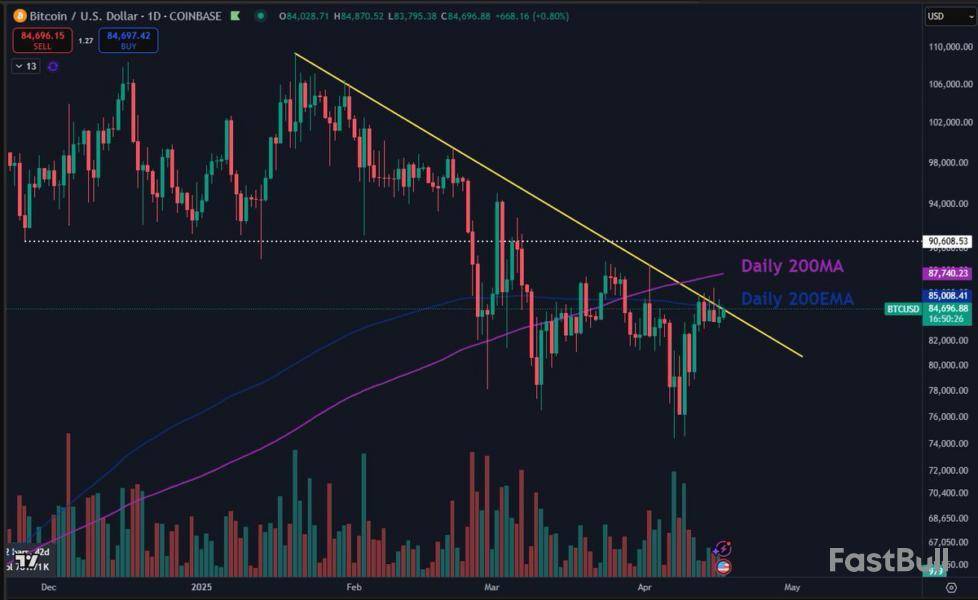
In performing a technical analysis on the current BTC market, Daan Crypto has identified the three resistance factors that have been active in the specified price zone.
The first price opposition is a diagonal downtrend line formed by Bitcoin’s consistent lower lows and lower highs amidst the price correction in the past three months. To establish any intent of a trend reversal, Bitcoin bulls must force a convincing price breakout above this long-standing diagonal resistance.
Other critical indicators are the 200-day Exponential Moving Average (EMA) and 200-day Simple Moving Average (MA), both of which provide an average of the past 200 days’ prices, with the EMA giving more weight to recent prices.
The 200-day EMA is important in spotting medium-to-long-term trend changes as it reacts faster to any price change than the 200-day MA, which is a classic long-term indicator. However, Bitcoin must move above both indicators to break out of its consolidation and perhaps experience a full price recovery.
Bitcoin Ultimate Resistance At $90,000-$91,000
Despite Bitcoin’s struggles in the $84,000-$86,000 price zone, Daan Crypto has warned that the asset’s ultimate test of a price reversal is at the $90,000-$91,000 price range, which served as a key support in the earlier phase of the bull cycle.
A successful reclaim of this range would place Bitcoin back into the bullish trading zone, signaling a potential resumption of the broader bull market. At press time, BTC continues to trade at $84,868 following a 0.13% gain in the past day. Meanwhile, the daily trading volume is down by 42.34% and valued at $12.52 billion.

728 RM B 7/F GEE LOK IND BLDG NO 34 HUNG TO RD KWUN TONG KLN HONG KONG





交易股票、货币、商品、期货、债券、基金等金融工具或加密货币属高风险行为,这些风险包括损失您的部分或全部投资金额,所以交易并非适合所有投资者。
做出任何财务决定时,应该进行自己的尽职调查,运用自己的判断力,并咨询合格的顾问。本网站的内容并非直接针对您,我们也未考虑您的财务状况或需求。本网站所含信息不一定是实时提供的,也不一定是准确的。本站提供的价格可能由做市商而非交易所提供。您做出的任何交易或其他财务决定均应完全由您负责,并且您不得依赖通过网站提供的任何信息。我们不对网站中的任何信息提供任何保证,并且对因使用网站中的任何信息而可能造成的任何交易损失不承担任何责任。
未经本站书面许可,禁止使用、存储、复制、展现、修改、传播或分发本网站所含数据。提供本网站所含数据的供应商及交易所保留其所有知识产权。


