


- GBPUSD
- XAUUSD
- XAGUSD
- WTI
- USDX


 看起来像是类似的角色
行情
分析
用户
快讯
财经日历
学习
数据
- 名称
- 最新值
- 前值










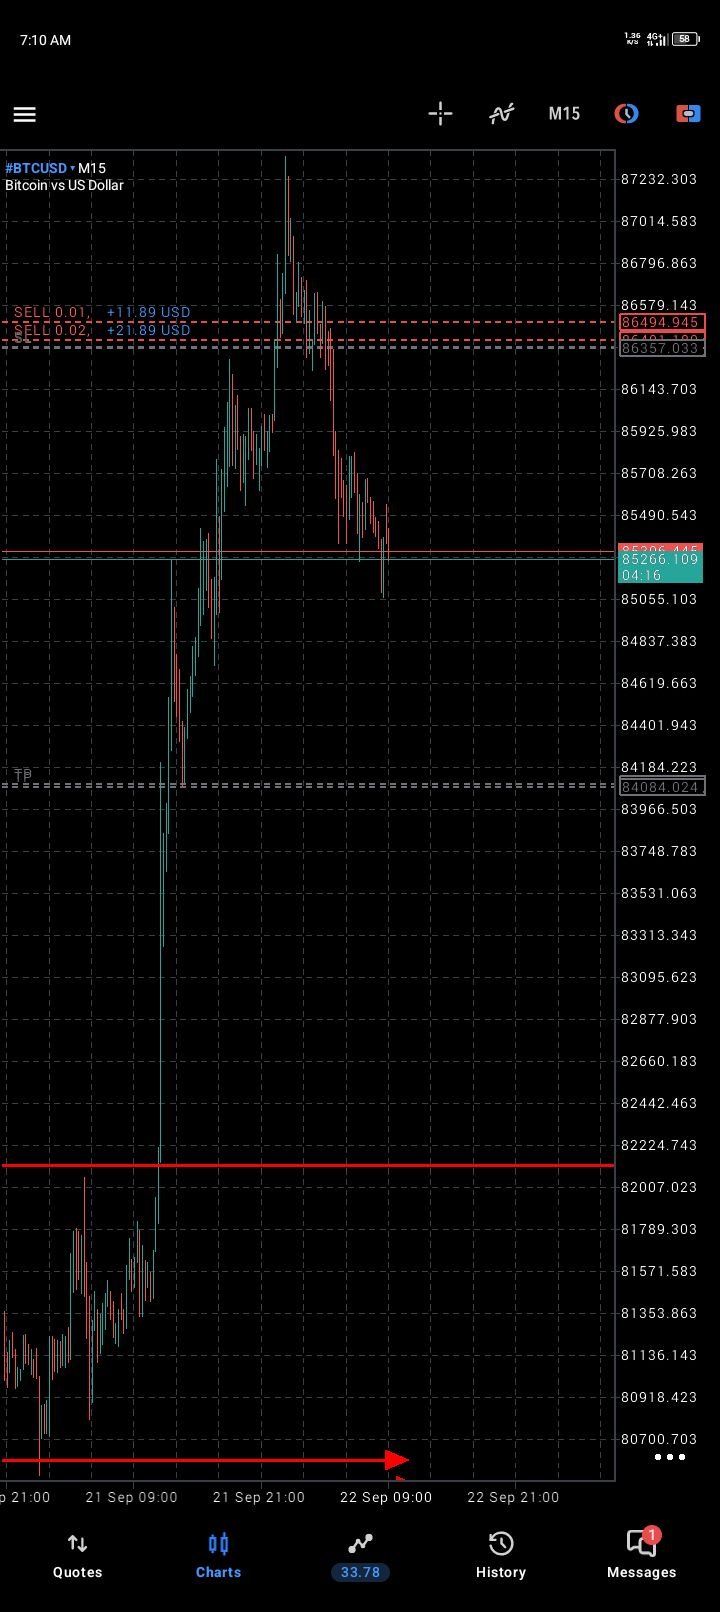



As the market matures and the broader economic landscape shifts, Bitcoin has once again found itself at a thrilling crossroads, with the entire crypto market watching closely as momentum builds on both sides of the chart. This moment of market volatility is a profound inflection point, where the interplay of rising institutional adoption and changing global macroeconomic conditions is converging.
Historical Breakout Zones Align With Price Structure
Bitcoin is currently sitting at a thrilling crossroads. In an X post, an analyst known as CryptoCrewU has stated that BTC is witnessing the strongest bearish divergence in years, paired with a rare 2-week close below the 21-period Simple Moving Average (SMA) of this bull run.
Furthermore, the Relative Strength Index (RSI) is currently dipping into levels reminiscent of past pivotal moments in 2015, 2018, the COVID-19 pandemic, and the 2022 bottoms. Meanwhile, the Stoch RSI has yet to cross upwards, hinting at the full extent of the potential move ahead.
While fear is at its peak in the market right now, history shows that buying during these market lows has consistently led to significant profits over the past 5 years. “Let data guide you, not emotions,” CryptoCrewU noted.
Trader_XO highlighted that since 2015, one pattern has remained remarkably consistent in Bitcoin’s cycle. Historically, whenever breaks below the 50-week Moving Average (MA), it has often signaled a deeper move toward the 200-week MA, or even the 300-week MA. Meanwhile, BTC tends to treat the 200-week MA as a major cycle support area.
The price has only dipped below the 300-week MA once in history, and anything trading below the 200-week MA has been relatively short-lived, aligning with the best part of the cycle lows. According to Trader_XO, if the price were to revisit those lower moving average levels, and the broader market context aligns, that area would be viewed as a high-probability buying opportunity, unless this time the move is different.
Market Structure Shows Early Signs Of Strength Returning
Bitcoin is finally showing signs of strength again. A Full-time crypto teacher, Sykodelic, has pointed out that for the first time since the drop from $116,000, the price has broken above its previous low-time-frame (LTF) range, with a strong push above the 50 SMA.
Since the $116,000 rejection, every time BTC attempts to move into an upper range, it gets rejected and makes new lows. This time, BTC has finally pushed higher. Currently, this is simply an LTF action, but these subtle shifts are exactly what to watch out for when it comes to understanding the nature of trend reversals.
A daily close above $87,000 will confirm the breakout of the trend. Sykodelic concluded that moving higher after a drop like that is intricate, and it can take time. Therefore, observe the signs and move accordingly to see how the daily close goes.

728 RM B 7/F GEE LOK IND BLDG NO 34 HUNG TO RD KWUN TONG KLN HONG KONG





交易股票、货币、商品、期货、债券、基金等金融工具或加密货币属高风险行为,这些风险包括损失您的部分或全部投资金额,所以交易并非适合所有投资者。
做出任何财务决定时,应该进行自己的尽职调查,运用自己的判断力,并咨询合格的顾问。本网站的内容并非直接针对您,我们也未考虑您的财务状况或需求。本网站所含信息不一定是实时提供的,也不一定是准确的。本站提供的价格可能由做市商而非交易所提供。您做出的任何交易或其他财务决定均应完全由您负责,并且您不得依赖通过网站提供的任何信息。我们不对网站中的任何信息提供任何保证,并且对因使用网站中的任何信息而可能造成的任何交易损失不承担任何责任。
未经本站书面许可,禁止使用、存储、复制、展现、修改、传播或分发本网站所含数据。提供本网站所含数据的供应商及交易所保留其所有知识产权。


