


- USDJPY
- XAUUSD
- XAGUSD
- WTI


行情
分析
用户
快讯
财经日历
学习
数据
- 名称
- 最新值
- 前值









As Bitcoin (BTC) edges closer to the psychologically significant $100,000 milestone, several technical and on-chain indicators suggest that a major breakout could be on the horizon. One such metric – Bitcoin’s Apparent Demand – has shown a strong rebound, signalling renewed interest and sustained accumulation in the market.
Bitcoin Sees Sharp Rebound In Apparent Demand
According to a recent CryptoQuant Quicktake post, contributor IT Tech pointed to a significant rise in BTC’s Apparent Demand. Most notably, this key indicator has returned to positive territory after spending several consecutive weeks in the red.
For the uninitiated, Bitcoin’s Apparent Demand (30-day sum) measures the cumulative net demand for BTC over the past 30 days by tracking wallet accumulation and exchange outflows. A sharp increase in this metric suggests strong, sustained buying pressure, which can indicate bullish sentiment and potential for a price rally.
The following chart illustrates this rebound in BTC’s Apparent Demand, which essentially reflects net changes in one-year inactive supply adjusted by daily block rewards – a metric designed to better represent organic demand growth.
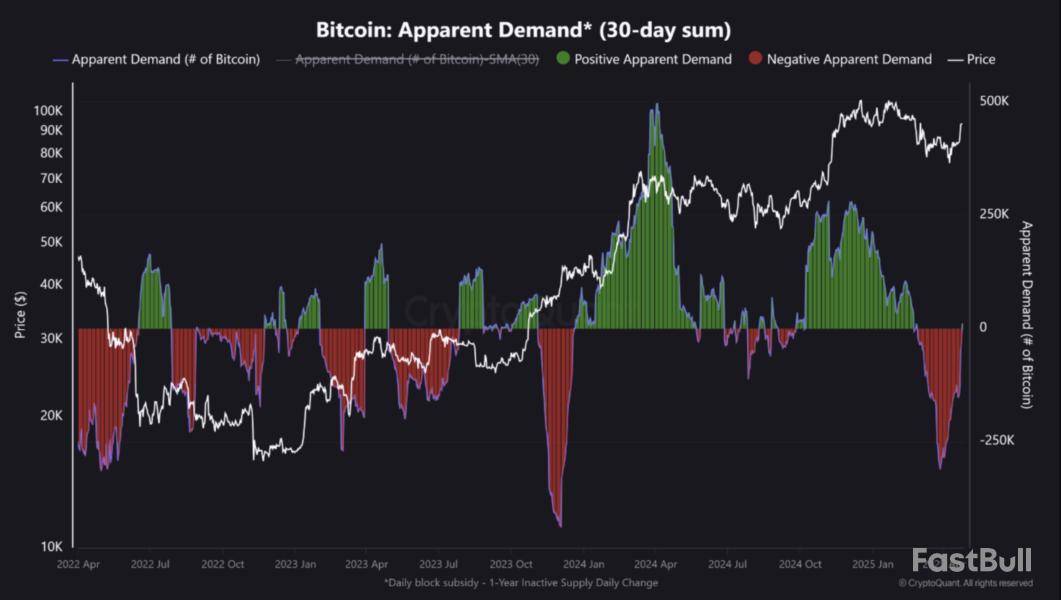
Previously, this metric had fallen deeply into negative territory – dipping below -200,000 (highlighted in red) – suggesting waning demand. However, its recent reversal into positive territory signals that long-dormant capital is flowing back into the market. As noted in the post:
The demand pivot is closely aligned with the recent price rebound above $87K, implying this recovery is underpinned by real on-chain behavior rather than purely speculative flows.
This marks the first positive Apparent Demand reading since February and aligns with rising inflows into spot Bitcoin exchange-traded funds (ETFs), as well as growing accumulation by long-term holders.
Data from SoSoValue shows that US-based spot BTC ETFs have recorded five consecutive days of net positive inflows, totalling more than $2.5 billion. The cumulative net inflow into spot BTC ETFs now stands at an impressive $38.05 billion.
Is A BTC Rally In Sight?
IT Tech noted that past reversals in Apparent Demand have historically preceded either significant rallies or periods of strong price support. If the current trend continues, BTC may have the momentum needed to challenge the $90,000 level in the near term.
However, analysts caution that Bitcoin must hold its current support around $91,500 to maintain upward momentum. This level is particularly important because it is close to the realized price of short-term BTC holders, according to CryptoQuant contributor Crazzyblockk.
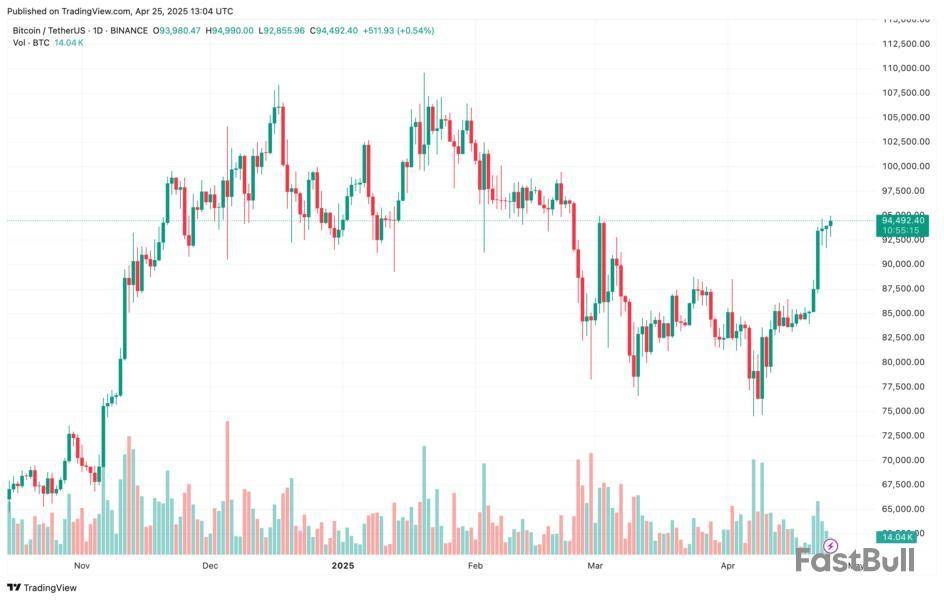
Further adding to this outlook, prominent crypto analyst Rekt Capital emphasized that Bitcoin needs to secure a weekly close above $93,500 and reclaim it as support in order to establish a clear path to $100,000. At press time, BTC trades at $94,492, up 2% in the last 24 hours.

728 RM B 7/F GEE LOK IND BLDG NO 34 HUNG TO RD KWUN TONG KLN HONG KONG


交易股票、货币、商品、期货、债券、基金等金融工具或加密货币属高风险行为,这些风险包括损失您的部分或全部投资金额,所以交易并非适合所有投资者。
做出任何财务决定时,应该进行自己的尽职调查,运用自己的判断力,并咨询合格的顾问。本网站的内容并非直接针对您,我们也未考虑您的财务状况或需求。本网站所含信息不一定是实时提供的,也不一定是准确的。本站提供的价格可能由做市商而非交易所提供。您做出的任何交易或其他财务决定均应完全由您负责,并且您不得依赖通过网站提供的任何信息。我们不对网站中的任何信息提供任何保证,并且对因使用网站中的任何信息而可能造成的任何交易损失不承担任何责任。
未经本站书面许可,禁止使用、存储、复制、展现、修改、传播或分发本网站所含数据。提供本网站所含数据的供应商及交易所保留其所有知识产权。


