


- USDX
- XAUUSD
- XAGUSD
- WTI


行情
分析
使用者
快訊
財經日曆
學習
數據
- 名稱
- 最新值
- 前值










Key takeaways:
XRP has slipped nearly 20% in 45 days, consolidating within a descending triangle near the $2.70 support.
Onchain and futures data show leverage reset and early signs of accumulation, reducing liquidation risks.
The confluence of a fair value gap, Fibonacci retracement lines, and fractal pattern points to a potential 60% to 85% rebound into Q4.
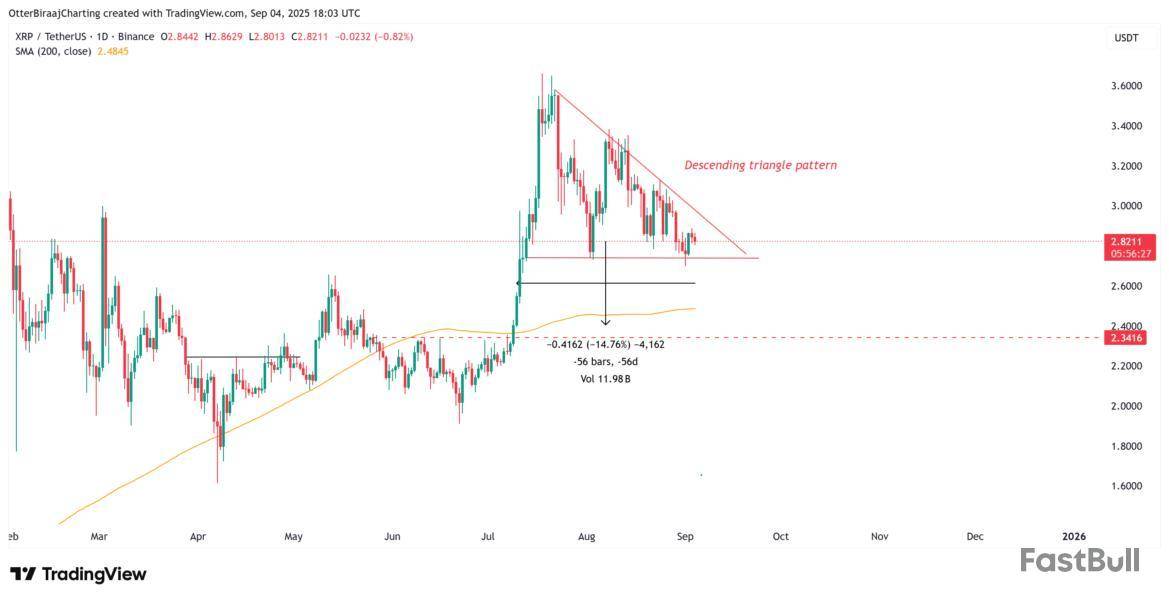
XRP (XRP) price fell by nearly 20% over the past 45 days, continuing a correction that has pushed the price back toward a key support. On the daily chart, XRP is consolidating within a descending triangle pattern, raising the risk of another move below support at $2.70.
XRP futures data underscores the cooling market. The open interest has dropped from $11 billion to $7.5 billion during the same period, reflecting reduced speculative exposure.
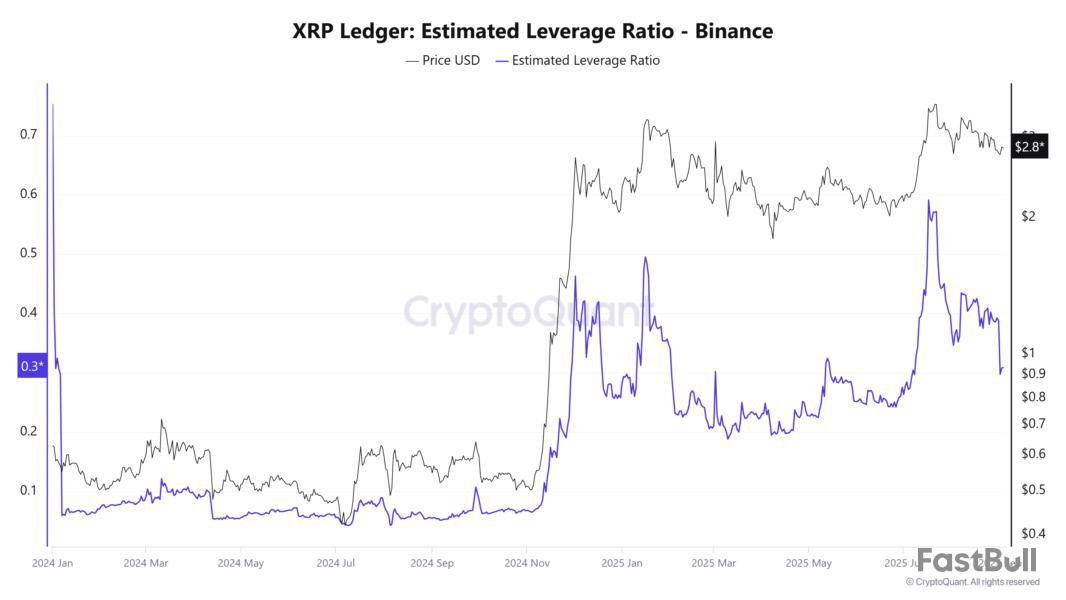
However, one positive development is that the token’s estimated leverage ratio on Binance has reset to its yearly average. The ratio of open interest relative to exchange reserves signals that traders are no longer overextended on high leverage. This reduces the likelihood of cascading liquidations and supports price stability during corrections.
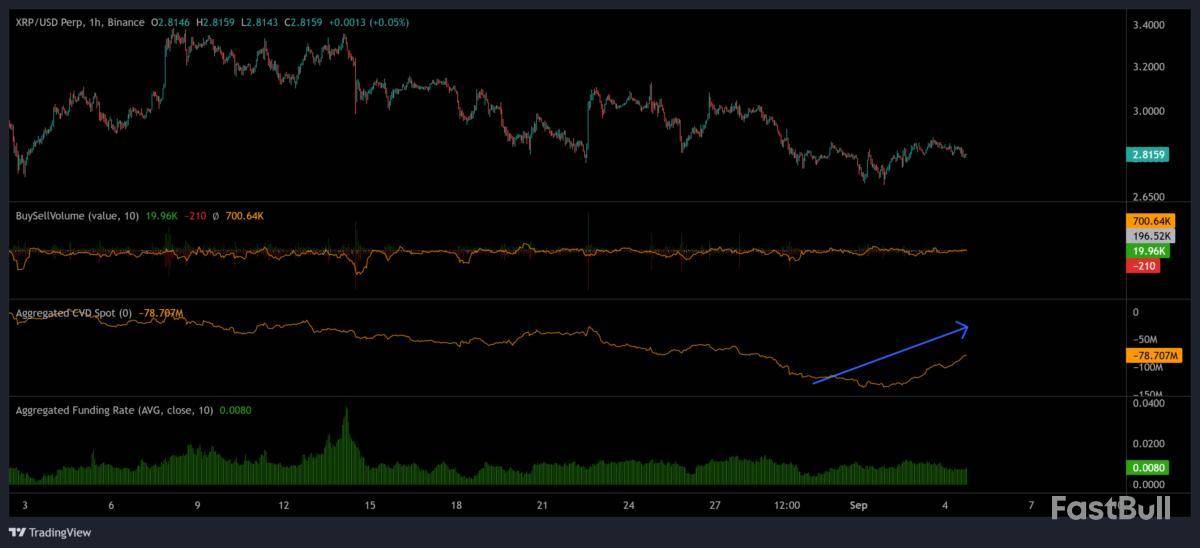
Onchain indicators also point to early signs of reversal. Net taker volume has moved closer to neutral, supported by an uptick in aggregated spot cumulative volume delta (CVD), which tracks whether buyers or sellers dominate. The shift suggests holders may already be in accumulation mode.
Futures positioning adds to the picture. Aggregated futures CVD has steadily declined, while funding rates have normalized to quarterly levels, indicating that crowded positions have been cleared.
Related: Betting on XRP’s 2017-style gains could be extremely risky in 2025
XRP price bottom could be near
On the daily chart, XRP continues to trade within a descending triangle, with price repeatedly testing support near $2.70. A daily/weekly fair value gap between $2.35 and $2.65 emerges as the key zone to watch. A push below $2.70 could drive XRP into this range, where a reaction is likely.
The significance of this gap is reinforced by Fibonacci retracement levels, with the 0.5 to 0.618 range aligning closely with the $2.35 to $2.65 zone. Historically, such a confluence has strengthened the probability of price stabilization and a rebound.
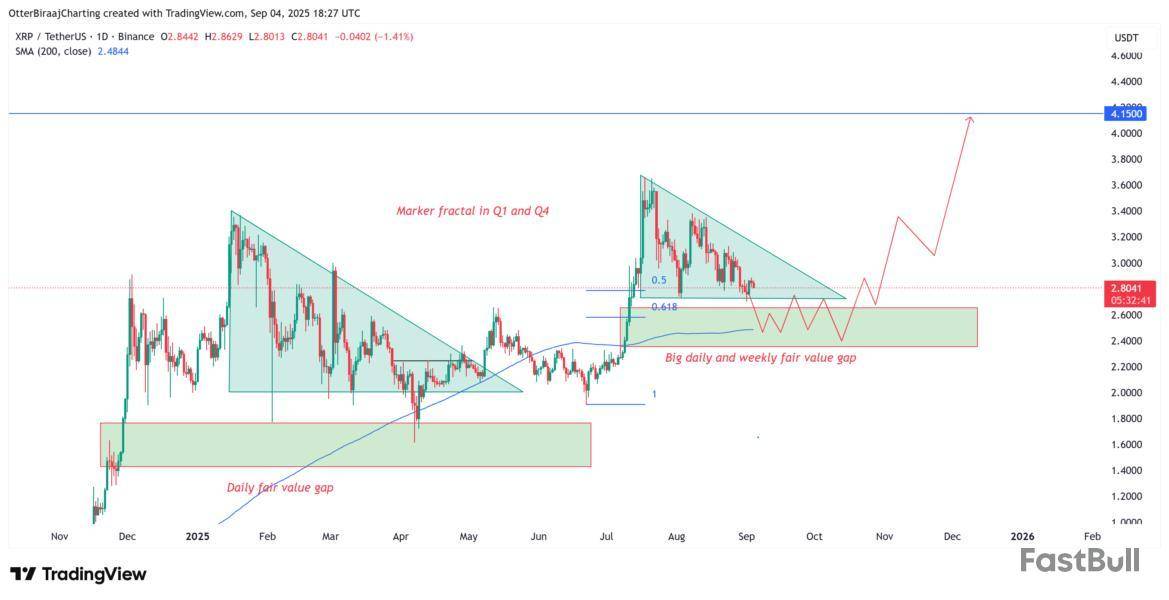
Adding weight to this outlook, Cointelegraph noted that XRP’s market structure resembles a Q1 fractal pattern, which preceded a sharp breakout. If the pattern plays out again, XRP could see gains of 60% to 85% in Q4.
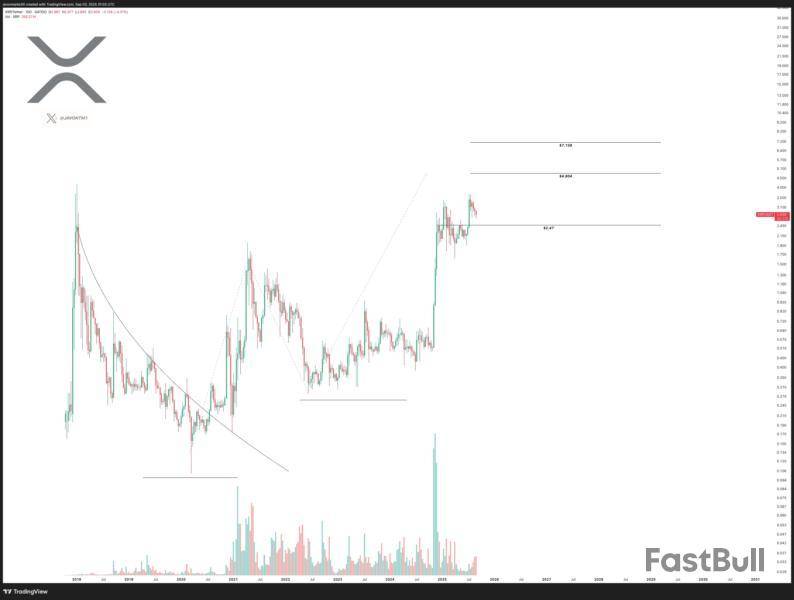
Crypto trader Javon Marks highlights a similar bullish bias, noting that “at the current state of the market, not much has changed with $XRP's target at $4.80 as its prices continue to hold above a key $2.47 level.”
Marks added that “as long as this level holds, prices may only be prepping for another +66% upside.”
Related: Rare Binance Bitcoin bottom signal fires: Will bulls or bears benefit?
This article does not contain investment advice or recommendations. Every investment and trading move involves risk, and readers should conduct their own research when making a decision.

728 RM B 7/F GEE LOK IND BLDG NO 34 HUNG TO RD KWUN TONG KLN HONG KONG





交易股票、貨幣、商品、期貨、債券、基金等金融工具或加密貨幣屬高風險行為,這些風險包括損失您的部分或全部投資金額,所以交易並非適合所有投資者。
做出任何財務決定時,應該進行自己的盡職調查,運用自己的判斷力,並諮詢合格的顧問。本網站的內容並非直接針對您,我們也未考慮您的財務狀況或需求。本網站所含資訊不一定是即時提供的,也不一定是準確的。本站提供的價格可能由造市商而非交易所提供。您做出的任何交易或其他財務決定均應完全由您負責,並且您不得依賴通過網站提供的任何資訊。我們不對網站中的任何資訊提供任何保證,並且對因使用網站中的任何資訊而可能造成的任何交易損失不承擔任何責任。
未經本站書面許可,禁止使用、儲存、複製、展現、修改、傳播或分發本網站所含數據。提供本網站所含數據的供應商及交易所保留其所有知識產權。


