


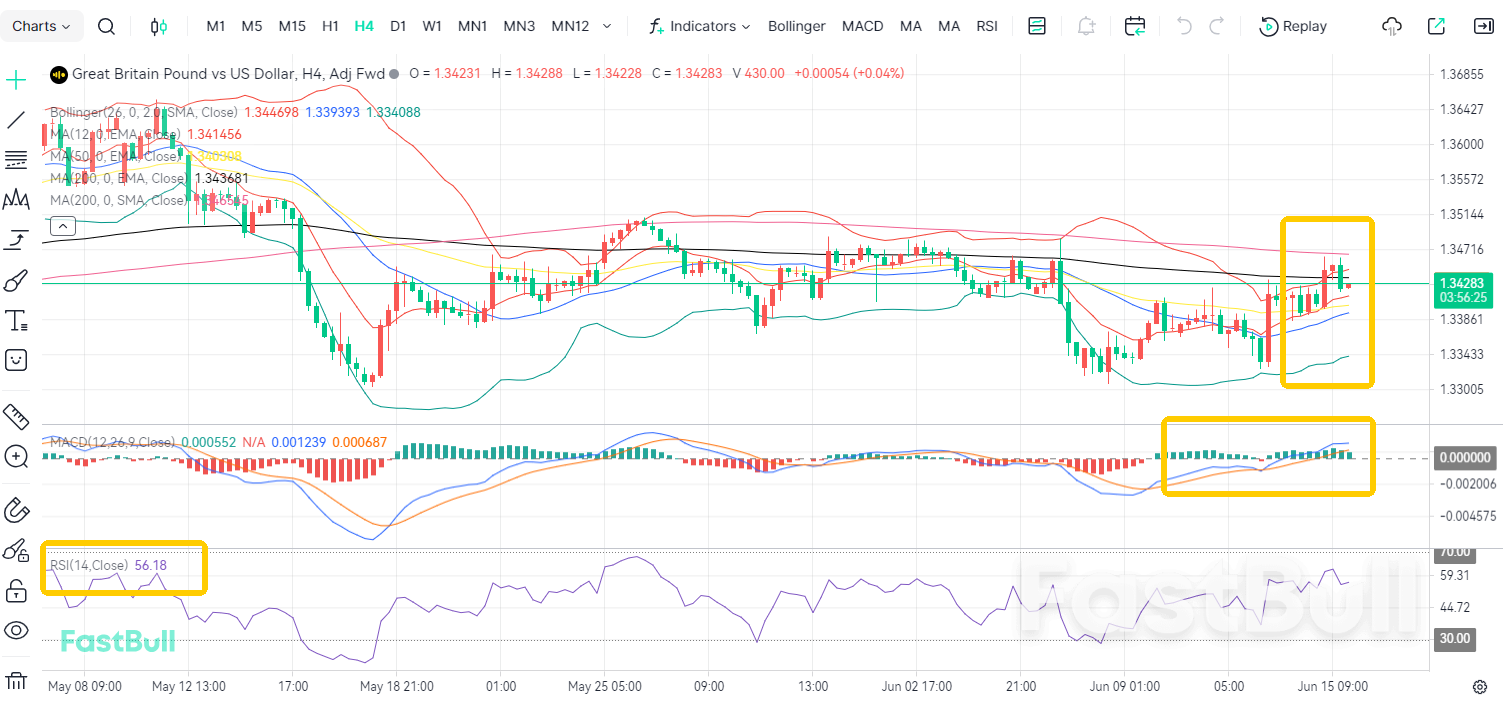
- GBPUSD
- XAUUSD
- XAGUSD
- WTI
- USDX


行情
分析
使用者
快訊
財經日曆
學習
數據
- 名稱
- 最新值
- 前值


By Derek Horstmeyer
Many investors follow the strategy of dollar-cost averaging to invest money in the stock market. But does it always deliver the most bang for the buck?
With dollar-cost averaging, an investor buys a fixed dollar amount of a position at regular time intervals — say, on the first of each month — because it allows you to buy more shares when the market is low and fewer when it is high. Over time, the strategy should lower your average cost per share, if purchases correspond to market cycles.
However, after testing how effective the strategy is, my research assistants Eray Tulun and Lilia Benrabia and I find that while dollar-cost averaging does well on an annualized basis versus a fixed-share strategy — where an investor buys a fixed number of shares or percent of stock at regular intervals — that isn't always the case. Specifically: Dollar-cost averaging overall outperforms a fixed-share strategy by 0.4 percentage point a year over the long run, but the dollar-cost strategy underperforms during down markets compared with a fixed-share strategy.
A million simulations
To study the issue, we set up a trading simulation to mimic the S&P 500 over the past half-century and ran one million simulations for each strategy using historical market performance as parameters in our simulations.
For our dollar-cost averaging strategy, we set up a portfolio where each year the investor allocated $100 to buying shares in the S&P 500. So, if the S&P 500 was priced at $100, then the investor bought one share in the stock index or two shares if it was priced at $50. (It should be noted that changing the time frame to a month in the above scenario yielded the same qualitative results.)
For our fixed-share strategy, we set up a portfolio where each year the investor would buy a fixed number of shares (or fixed percentage of their portfolio) of the S&P 500. But since the price is variable, some years you wouldn't be able to buy as many shares as you used to if the price of the S&P 500 had gone up and there would be cash left over if the price of the S&P 500 had gone down. We assumed the idle cash would be held in an interest-bearing account with a 5% rate of return.
Across all simulations, dollar-cost averaging outperforms the fixed-share strategy by about 0.40 percentage point on an annualized basis. Averaged over all market conditions over a 20-year horizon, we find that dollar-cost averaging delivers 6.93% in annualized returns while the fixed-share strategy delivers 6.53% a year in returns.
Up vs. down
But we also found that while the dollar-cost averaging strategy does well in up markets, it lags behind the fixed-share strategy in down markets.
For a market that goes up over a period of two-plus years, we found that the dollar-cost averaging strategy yielded a return of 23.57% a year while the fixed-share strategy returned 16.04% a year. That is a difference of 7.53 percentage points a year.
However, during a period where the market is lower over a period of two-plus years, we found that the dollar-cost averaging strategy yielded 4.39% a year while the fixed-share strategy yielded 6.03% a year. This is a difference of negative 1.64 percentage points a year for dollar-cost averaging versus fixed-share purchasing.
Finally, we tested what impact market volatility has on dollar-cost averaging versus fixed-share purchasing. To implement this, we tested our strategies over a 20-year horizon assuming volatility of 10% and volatility of 35%. Again the results favor the dollar-cost averaging strategy, with it showing a slight outperformance during a period of 10% volatility and doing much better during the high-volatility scenario.
Bottom line: Over the long run it is best to employ a dollar-cost averaging strategy, but adopting a fixed-share strategy could be worthwhile during an extended downturn.
Derek Horstmeyer is a professor of finance at Costello College of Business, George Mason University, in Fairfax, Va. He can be reached at reports@wsj.com.
728 RM B 7/F GEE LOK IND BLDG NO 34 HUNG TO RD KWUN TONG KLN HONG KONG


交易股票、貨幣、商品、期貨、債券、基金等金融工具或加密貨幣屬高風險行為,這些風險包括損失您的部分或全部投資金額,所以交易並非適合所有投資者。
做出任何財務決定時,應該進行自己的盡職調查,運用自己的判斷力,並諮詢合格的顧問。本網站的內容並非直接針對您,我們也未考慮您的財務狀況或需求。本網站所含資訊不一定是即時提供的,也不一定是準確的。本站提供的價格可能由造市商而非交易所提供。您做出的任何交易或其他財務決定均應完全由您負責,並且您不得依賴通過網站提供的任何資訊。我們不對網站中的任何資訊提供任何保證,並且對因使用網站中的任何資訊而可能造成的任何交易損失不承擔任何責任。
未經本站書面許可,禁止使用、儲存、複製、展現、修改、傳播或分發本網站所含數據。提供本網站所含數據的供應商及交易所保留其所有知識產權。


