- WTI
- XAUUSD
- XAGUSD
- USDX


行情
分析
使用者
快訊
財經日曆
學習
數據
- 名稱
- 最新值
- 前值









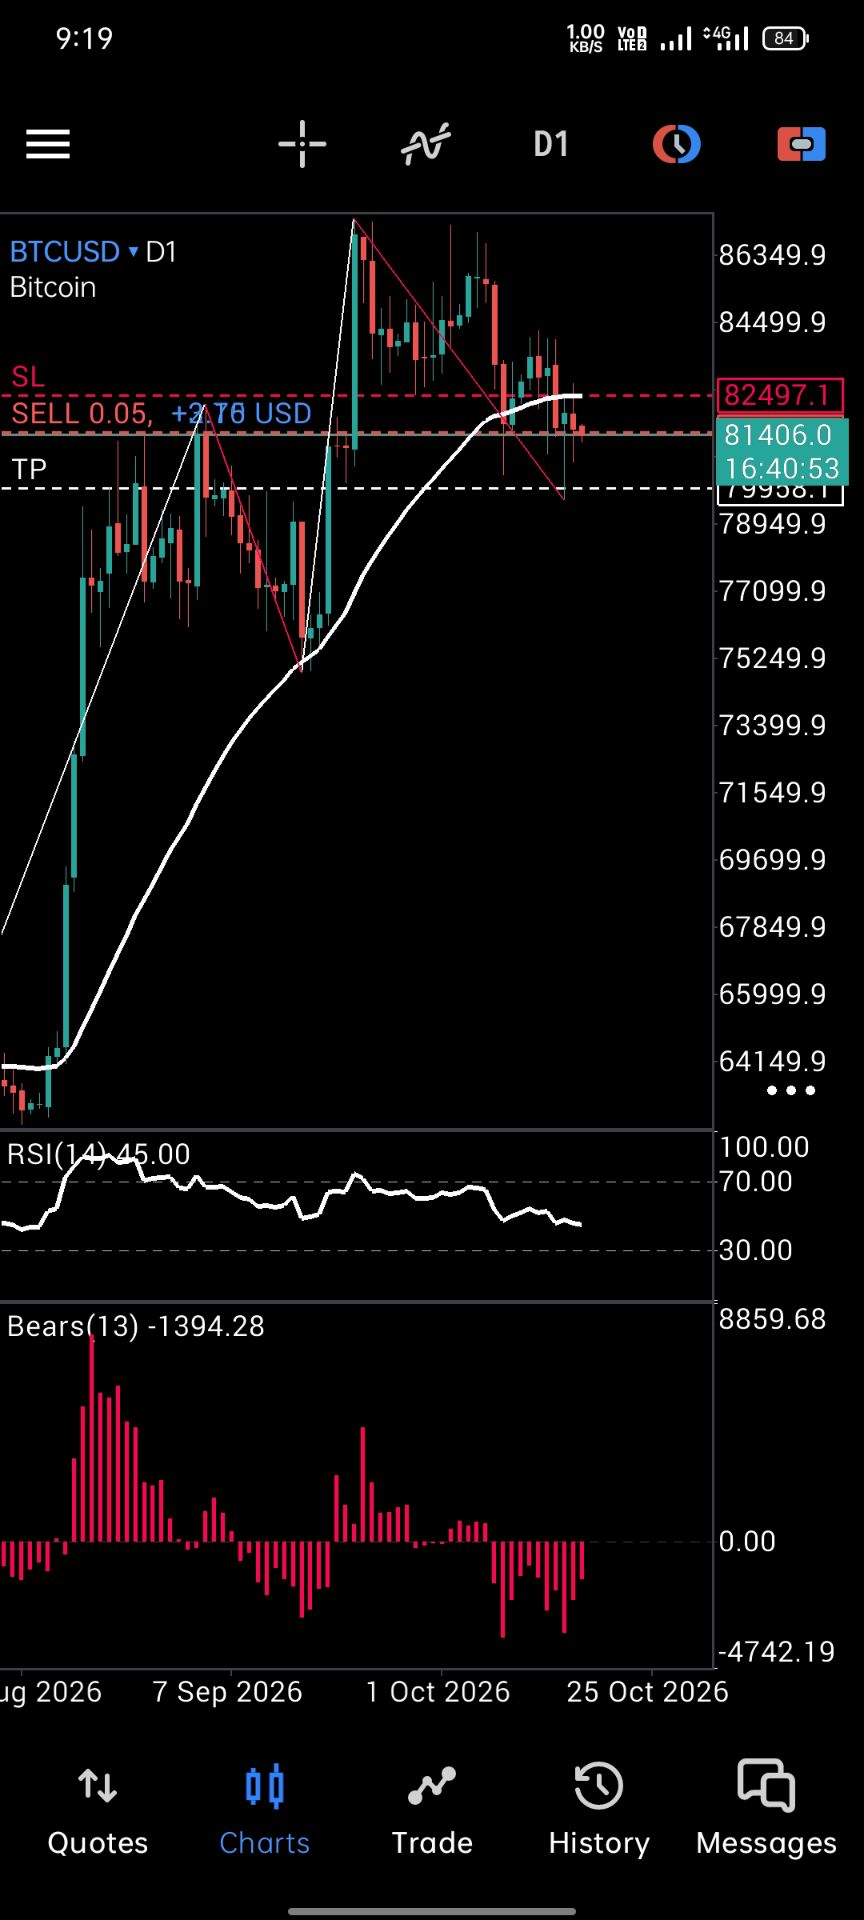


After bouncing 2.6% from recent lows, Bitcoin (BTC) has been attempting to turn the $82,000-$83,000 area into support. Some analysts have warned that the cryptocurrency must hold the crucial macro support levels or it will “confirm bearish acceleration.”
Bitcoin To Drop 76% From its Peak
On Thursday, Bitcoin crashed alongside the rest of the market, retracing nearly 9% in a day toward the $81,314 area. BTC had been trading between $86,000-$93,500 since early November, closing above the lower boundary of its two-month range in the weekly timeframe despite constant volatility.
At the moment, the flagship cryptocurrency has lost this key support in the daily timeframe and risks a deeper correction if the price doesn’t recover the $86,000 level before the end of the week.
As the price hovers between levels not seen since the late November correction, a market observer has warned that the leading cryptocurrency has lost its 100-week Exponential Moving Average (EMA) as support.
Ted Pillows asserted that the last two times Bitcoin had a weekly close below the 100-week EMA, back in 2018 and 2022, it dropped 50% in just 4-6 weeks. Moreover, he highlighted BTC’s historical pattern, noting that the cryptocurrency has repeated a similar performance between the 2017-2018 and 2021-2022 cycles.
The chart shows an eight-year ascending trendline that has marked the top of the previous cycles. The trendline began during the late 2017 peak and continued into the next bull market, marking the 2021 cycle top too.
Notably, the 2018 bear market correction saw Bitcoin retrace 83.11% from the ascending trendline, while the 2022 pullback had BTC dropping 77.57% from the cycle top. Per the chart, this has formed a rising support line that has marked where BTC’s price bottomed during previous bear markets.
Now, Bitcoin has seemingly topped around the trendline once again and could retrace up to 76.88% toward the $30,000 mark in 2026, if history repeats.
BTC Retests Macro Triangle Bottom
Analyst Rekt Capital also shared his perspective on BTC’s recent pullback now that it has broken down from its weekly price range and is revisiting the $82,500 bottom of its Macro Triangle formation.
The analyst explained that Bitcoin has been forming a triangle pattern in the monthly timeframe since mid-2024, similar to its 2021 triangle formation that preceded the previous bear market.
Per the analysis, the flagship crypto has shown a nearly identical price action to its 2021-2022 performance, with the price respecting the macro support and descending resistance.
A breakdown from the macro triangle bottom “would confirm Bearish Acceleration,” he noted, adding that for bull market continuation, the cryptocurrency would need to break and hold above the macro descending resistance on longer timeframes.
“Until then, we have more evidence that maybe we will be following 2021 [performance]. (…) It’s just a little bit more compressed.”
He also pointed out that BTC is displaying a similar Bull Market EMAs crossover that occurred during the early stages of the previous bear market.
Rekt Capital highlighted that the imminent crossover does not necessarily predict additional downside, but “is effectively confirming weakness, kind of responding to the weakness that we are already seeing and have seen for a while.”
“History is suggesting to us that if we continue to make these macro lower highs, which are a result of weakening demand at historical support regions, then there’s more reason to be bearish rather than bullish,” he concluded.

728 RM B 7/F GEE LOK IND BLDG NO 34 HUNG TO RD KWUN TONG KLN HONG KONG





交易股票、貨幣、商品、期貨、債券、基金等金融工具或加密貨幣屬高風險行為,這些風險包括損失您的部分或全部投資金額,所以交易並非適合所有投資者。
做出任何財務決定時,應該進行自己的盡職調查,運用自己的判斷力,並諮詢合格的顧問。本網站的內容並非直接針對您,我們也未考慮您的財務狀況或需求。本網站所含資訊不一定是即時提供的,也不一定是準確的。本站提供的價格可能由造市商而非交易所提供。您做出的任何交易或其他財務決定均應完全由您負責,並且您不得依賴通過網站提供的任何資訊。我們不對網站中的任何資訊提供任何保證,並且對因使用網站中的任何資訊而可能造成的任何交易損失不承擔任何責任。
未經本站書面許可,禁止使用、儲存、複製、展現、修改、傳播或分發本網站所含數據。提供本網站所含數據的供應商及交易所保留其所有知識產權。