


- USDJPY
- XAUUSD
- XAGUSD
- WTI


行情
分析
使用者
快訊
財經日曆
學習
數據
- 名稱
- 最新值
- 前值









As Bitcoin (BTC) edges closer to the psychologically significant $100,000 milestone, several technical and on-chain indicators suggest that a major breakout could be on the horizon. One such metric – Bitcoin’s Apparent Demand – has shown a strong rebound, signalling renewed interest and sustained accumulation in the market.
Bitcoin Sees Sharp Rebound In Apparent Demand
According to a recent CryptoQuant Quicktake post, contributor IT Tech pointed to a significant rise in BTC’s Apparent Demand. Most notably, this key indicator has returned to positive territory after spending several consecutive weeks in the red.
For the uninitiated, Bitcoin’s Apparent Demand (30-day sum) measures the cumulative net demand for BTC over the past 30 days by tracking wallet accumulation and exchange outflows. A sharp increase in this metric suggests strong, sustained buying pressure, which can indicate bullish sentiment and potential for a price rally.
The following chart illustrates this rebound in BTC’s Apparent Demand, which essentially reflects net changes in one-year inactive supply adjusted by daily block rewards – a metric designed to better represent organic demand growth.
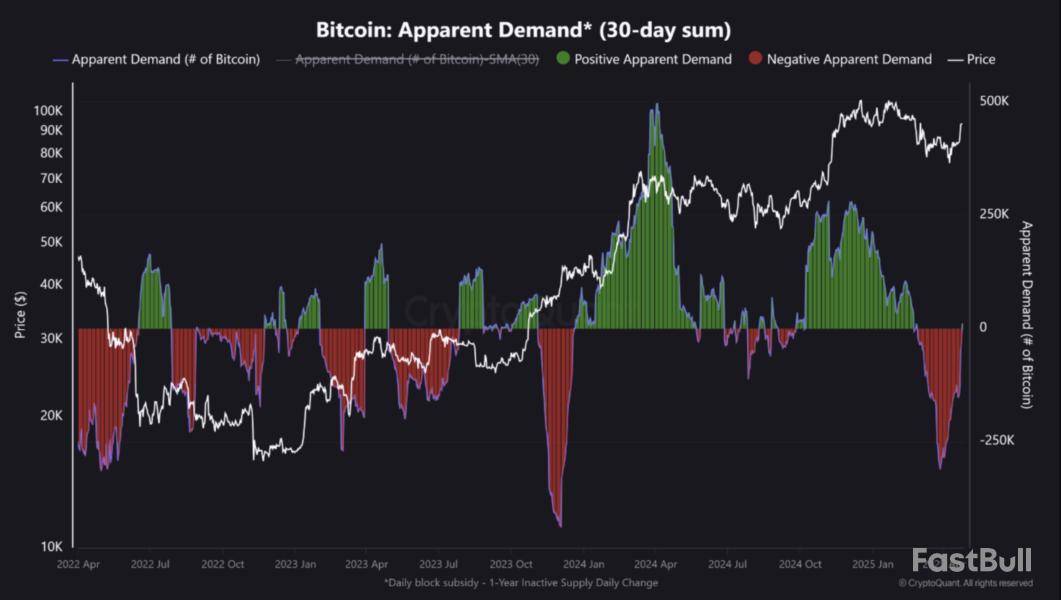
Previously, this metric had fallen deeply into negative territory – dipping below -200,000 (highlighted in red) – suggesting waning demand. However, its recent reversal into positive territory signals that long-dormant capital is flowing back into the market. As noted in the post:
The demand pivot is closely aligned with the recent price rebound above $87K, implying this recovery is underpinned by real on-chain behavior rather than purely speculative flows.
This marks the first positive Apparent Demand reading since February and aligns with rising inflows into spot Bitcoin exchange-traded funds (ETFs), as well as growing accumulation by long-term holders.
Data from SoSoValue shows that US-based spot BTC ETFs have recorded five consecutive days of net positive inflows, totalling more than $2.5 billion. The cumulative net inflow into spot BTC ETFs now stands at an impressive $38.05 billion.
Is A BTC Rally In Sight?
IT Tech noted that past reversals in Apparent Demand have historically preceded either significant rallies or periods of strong price support. If the current trend continues, BTC may have the momentum needed to challenge the $90,000 level in the near term.
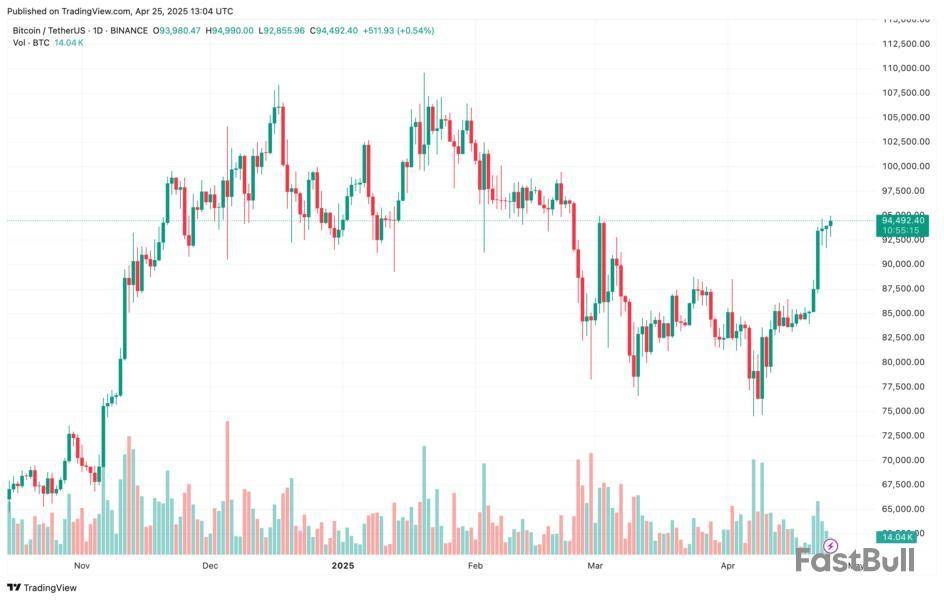
However, analysts caution that Bitcoin must hold its current support around $91,500 to maintain upward momentum. This level is particularly important because it is close to the realized price of short-term BTC holders, according to CryptoQuant contributor Crazzyblockk.
Further adding to this outlook, prominent crypto analyst Rekt Capital emphasized that Bitcoin needs to secure a weekly close above $93,500 and reclaim it as support in order to establish a clear path to $100,000. At press time, BTC trades at $94,492, up 2% in the last 24 hours.

728 RM B 7/F GEE LOK IND BLDG NO 34 HUNG TO RD KWUN TONG KLN HONG KONG


交易股票、貨幣、商品、期貨、債券、基金等金融工具或加密貨幣屬高風險行為,這些風險包括損失您的部分或全部投資金額,所以交易並非適合所有投資者。
做出任何財務決定時,應該進行自己的盡職調查,運用自己的判斷力,並諮詢合格的顧問。本網站的內容並非直接針對您,我們也未考慮您的財務狀況或需求。本網站所含資訊不一定是即時提供的,也不一定是準確的。本站提供的價格可能由造市商而非交易所提供。您做出的任何交易或其他財務決定均應完全由您負責,並且您不得依賴通過網站提供的任何資訊。我們不對網站中的任何資訊提供任何保證,並且對因使用網站中的任何資訊而可能造成的任何交易損失不承擔任何責任。
未經本站書面許可,禁止使用、儲存、複製、展現、修改、傳播或分發本網站所含數據。提供本網站所含數據的供應商及交易所保留其所有知識產權。


