Petikan
Berita
Analisis
Pengguna
24/7
Kalendar Ekonomi
Pendidikan
Data
- Nama
- Terkini
- Sblm


Akaun Signal untuk Ahli
Semua Akaun Signal
Semua Peraduan


Amerika Syarikat Kadar Bulanan Purata Gaji Setiap Jam (Selepas Pelarasan Bermusim) (Dis)S:--
R: --
Amerika Syarikat Purata Waktu Kerja Seminggu (Selepas Pelarasan Bermusim) (Dis)S:--
R: --
S: --
Amerika Syarikat Pembangunan Perumahan Baru Tahunan MoM (SA) (Okt)S:--
R: --
Amerika Syarikat Jumlah Bilangan Permit Pembinaan (Selepas Pelarasan Bermusim) (Okt)S:--
R: --
S: --
Amerika Syarikat Kadar Bulanan Permit Pembinaan (Selepas Pelarasan Bermusim) (Okt)S:--
R: --
S: --
Amerika Syarikat Perumahan Baharu Tahunan Bermula (Selepas Pelarasan Bermusim) (Okt)S:--
R: --
Amerika Syarikat Kadar Pengangguran U6 (Selepas Pelarasan Bermusim) (Dis)S:--
R: --
S: --
Amerika Syarikat Nombor Pekerjaan Pembuatan (Dilaraskan Mengikut Musim) (Dis)S:--
R: --
Amerika Syarikat Kadar Penyertaan Pekerjaan (Selepas Pelarasan Bermusim) (Dis)S:--
R: --
S: --
Amerika Syarikat Pekerjaan Bukan Pertanian (Sektor Swasta) (Dilaraskan Mengikut Musim) (Dis)S:--
R: --
Amerika Syarikat Kadar Pengangguran (Selepas Pelarasan Bermusim) (Dis)S:--
R: --
Amerika Syarikat Pekerjaan Bukan Pertanian (Selepas Pelarasan Bermusim) (Dis)S:--
R: --
Amerika Syarikat Purata Gaji Setiap Jam Tahunan (Dis)S:--
R: --
Kanada Pekerjaan Sepenuh Masa (Selepas Pelarasan Bermusim) (Dis)S:--
R: --
S: --
Kanada Bilangan Pekerja Sambilan (Selepas Pelarasan Bermusim) (Dis)S:--
R: --
S: --
Kanada Kadar Pengangguran (Selepas Pelarasan Bermusim) (Dis)S:--
R: --
S: --
Kanada Kadar Penyertaan Pekerjaan (Selepas Pelarasan Bermusim) (Dis)S:--
R: --
S: --
Amerika Syarikat Pekerjaan Kerajaan (Dis)S:--
R: --
S: --
Kanada Bilangan Orang Yang Bekerja (Dilaraskan Mengikut Musim) (Dis)S:--
R: --
S: --
Amerika Syarikat Indeks Jangkaan Pengguna UMich Prelim (Jan)S:--
R: --
S: --
Amerika Syarikat Indeks Sentimen Pengguna Universiti Michigan Kilat (Jan)S:--
R: --
S: --
Amerika Syarikat Indeks Keadaan Awal Universiti Michigan (Jan)S:--
R: --
S: --
Amerika Syarikat Jangkaan Inflasi 1 tahun Umich Prelim (Jan)S:--
R: --
S: --
Amerika Syarikat Nilai Awal Kadar Inflasi Tahunan Universiti Michigan Selama Lima Tahun (Jan)S:--
R: --
S: --
Amerika Syarikat Jangkaan Kadar Inflasi Lima Hingga Sepuluh Tahun (Jan)S:--
R: --
S: --
China, Tanah Besar Kadar Tahunan Bekalan Wang M1 (Dis)--
R: --
S: --
China, Tanah Besar Kadar Tahunan Bekalan Wang M0 (Dis)--
R: --
S: --
China, Tanah Besar Kadar Tahunan Bekalan Wang M2 (Dis)--
R: --
S: --
Amerika Syarikat Jumlah Pelantar Minyak Untuk Minggu IniS:--
R: --
S: --
Amerika Syarikat Jumlah Bilangan Pelantar Penerokaan MingguanS:--
R: --
S: --
Indonesia Jualan Runcit Tahunan (Nov)--
R: --
S: --
Zon Euro Indeks Keyakinan Pelabur Sentix (Jan)--
R: --
S: --
India CPI YoY (Dis)--
R: --
S: --
Jerman Akaun Semasa (Tidak Dilaraskan Mengikut Musim) (Nov)--
R: --
S: --
Kanada Indeks Keyakinan Ekonomi Negara--
R: --
S: --
Ahli FOMC Barkin Bercakap
Amerika Syarikat Hasil Lelongan Perbendaharaan 3 Tahun--
R: --
S: --
Amerika Syarikat Purata Hasil Lelongan Bon Perbendaharaan 10 Tahun--
R: --
S: --
Jepun Data Perdagangan Berdasarkan Bea Cukai (Nov)--
R: --
S: --
Jepun Baki Dagangan (Nov)--
R: --
S: --
U.K. Jualan Runcit Keseluruhan BRC YoY (Dis)--
R: --
S: --
U.K. Indeks BRC Untuk Perbandingan Jualan Runcit YoY (Dis)--
R: --
S: --
Turki Jualan Runcit Tahunan (Nov)--
R: --
S: --
Amerika Syarikat Indeks Keyakinan Perniagaan Kecil NFIB (Dilaraskan Musim) (Dis)--
R: --
S: --
Brazil Kadar Pertumbuhan Industri Perkhidmatan (Nov)--
R: --
S: --
Kanada Kadar Bulanan Permit Pembinaan (Selepas Pelarasan Bermusim) (Nov)--
R: --
S: --
Amerika Syarikat CPI Bulanan (Dilaraskan Mengikut Musim) (Dis)--
R: --
S: --
Amerika Syarikat Kadar Tahunan CPI (Tidak Diselaraskan Mengikut Musim) (Dis)--
R: --
S: --
Amerika Syarikat Kadar Bulanan Pendapatan Sebenar (Selepas Pelarasan Bermusim) (Dis)--
R: --
S: --
Amerika Syarikat Kadar Bulanan CPI (Tidak Dilaraskan Mengikut Musim) (Dis)--
R: --
S: --
Amerika Syarikat CPI Teras (Selepas Pelarasan Bermusim) (Dis)--
R: --
S: --
Amerika Syarikat Kadar Tahunan CPI Teras (Tidak Dilaraskan Mengikut Musim) (Dis)--
R: --
S: --
Amerika Syarikat Kadar Bulanan CPI Teras (Selepas Pelarasan Bermusim) (Dis)--
R: --
S: --
Amerika Syarikat Jualan Runcit Perniagaan Mingguan Redbook--
R: --
S: --
Amerika Syarikat Jualan Rumah Baharu MoM Tahunan (Okt)--
R: --
S: --
Amerika Syarikat Jumlah Tahunan Jualan Rumah Baharu (Okt)--
R: --
S: --
Amerika Syarikat Kadar Bulanan CPI Fed Cleveland (Dilaraskan Mengikut Musim) (Dis)--
R: --
S: --
China, Tanah Besar Import Tahunan (Yuan China) (Dis)--
R: --
S: --
China, Tanah Besar Baki Dagangan (Yuan China) (Dis)--
R: --
S: --
China, Tanah Besar Kadar Import Tahunan (Dolar AS) (Dis)--
R: --
S: --
China, Tanah Besar Nilai Eksport Tahunan (USD) (Dis)--
R: --
S: --


Tiada data yang sepadan
Aliran Pasaran
Indikator Teratas
Pandangan Terkini
Pandangan Terkini
Topik Trending
Kolumnis Top
Maklumat terkini
White Label
Data API
Web Plug-in
Program Afiliate
Lihat Semua

Tiada data
More than 50 billion SHIB tokens left centralized exchanges in a brief amount of time, according to a recent massive exchange outflow event reported by Shiba Inu. Practically speaking, this indicates that a sizable portion of the liquid supply has been removed from marketplaces, intended mainly for sales. That by itself does not ensure a rally, but it significantly alters short-term supply dynamics.
Shiba Inu exchange flows
One of three behaviors – long-term accumulation, cold storage transfers or internal restructuring by large holders – is typically indicated by significant exchange outflows. Instead of just shuffling wallets, the size and persistence of the negative netflow in this instance tend to favor accumulation.
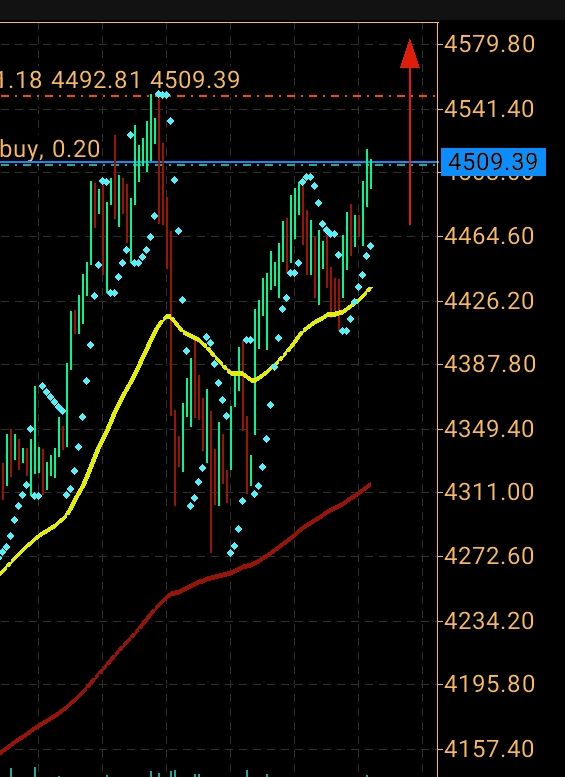
BINANCE:SHIBUSDT Chart by TradingView" />
Liquidity would normally move onto exchanges rather than off of them if participants were getting ready to sell. According to the data, sellers are either becoming much less aggressive at the current price levels or are thinning out.
Although the price chart does not yet shout bull market, it does support this interpretation. Although SHIB is still trading below its major moving averages and in a wider downtrend, the downtrend’s slope has significantly flattened. Instead of acceleration, recent price action indicates compression.
SHIB stays oversold
Momentum indicators are hovering in oversold territory without causing panic-driven breakdowns, lower lows are minimal and volatility has decreased. That is a classic example of late-stage bearishness.
From a midterm standpoint, this arrangement is beneficial but weak. It takes less additional demand to raise prices when supply leaves exchanges because it lessens the immediate sell pressure. Demand still needs to be demonstrated, though. In the absence of a catalyst or a wider market tailwind, SHIB may stay in consolidation for longer than impatient traders anticipate.
Exhaustion selling seems to be limiting the downside, while even modest inflows could increase the upside risk. When accumulation phases give way to momentum moves, SHIB has historically been extremely reactive, frequently without much notice.
Strategy (formerly MicroStrategy) is the largest corporate holder of Bitcoin, owning 671,268 BTC, which represents over 3.2% of all Bitcoin in circulation. That makes the company a high-risk keystone in the Bitcoin ecosystem.
If it falls apart, the impact could be larger than the 2022 FTX collapse. Here’s why that threat is real, what could trigger it, and how bad the fallout could be.
MicroStrategy Is a Leveraged Bitcoin Bet
MicroStrategy’s entire identity is now tied to Bitcoin. The company spent over $50 billion buying BTC, mostly using debt and stock sales. Its software business brings in just $460 million a year, which is a fraction of its exposure.
As of December 2025, its stock trades well below the value of its Bitcoin holdings. The market value is approximately $45 billion, but its BTC is worth around $59–60 billion.
Investors are discounting its assets because of concerns about dilution, debt, and sustainability.
Its average BTC cost basis is around $74,972, and most of its recent buys were near Bitcoin’s peak in Q4 2025.
More than 95% of its valuation hinges on the price of Bitcoin.
If BTC drops sharply, the company could be trapped — holding billions in debt and preferred equity with no way out.
For instance, Bitcoin dropped 20% since October 10, but MSTR’s loss has been more than double in the same period.
What Makes This a Black Swan Risk?
MicroStrategy used aggressive tactics to fund Bitcoin buys. It sold common stock and issued new types of preferred shares.
It now owes over $8.2 billion in convertible debt and has more than $7.5 billion in preferred stock. These financial tools require large cash outflows: $779 million annually in interest and dividends.
At the current levels, if Bitcoin crashes below $13,000, MicroStrategy could become insolvent. That’s not likely in the near term, but BTC’s history shows that 70–80% drawdowns are common.
A large crash, especially if paired with a liquidity crunch or ETF-driven volatility, could push the company into distress.
Unlike FTX, MicroStrategy is not an exchange. But the effect of its failure could be deeper. It owns more Bitcoin than any entity except a few ETFs and governments.
Forced liquidation or panic over MicroStrategy’s collapse could drive BTC’s price down sharply — creating a feedback loop across crypto markets.
MicroStrategy has promised not to sell its BTC, but that depends on its ability to raise cash.
As of late 2025, it holds $2.2 billion in reserves. This is enough to cover two years of payouts. But that buffer could vanish if BTC falls and capital markets close.
How Likely Is a Collapse for Michael Saylor’s Strategy?
Probability isn’t binary. But the risk is rising.
MicroStrategy’s current position is fragile. Its stock has fallen 50% this year. Its mNAV is below 0.8×. Institutional investors are shifting to Bitcoin ETFs, which are cheaper and less complex.
Index funds may drop MSTR due to its structure, triggering billions in passive outflows.
If Bitcoin falls below $50,000 and stays there, the company’s market cap could fall below its debt load. At that point, its ability to raise capital could dry up — forcing painful decisions, including asset sales or restructuring.
The odds of a total collapse in 2026 are low, but not remote. A rough estimate might place the probability between 10–20%, based on current balance sheet risk, market behavior, and Bitcoin volatility.
But if it does happen, the damage could exceed FTX’s collapse. FTX was a centralized exchange. MicroStrategy is a key holder of Bitcoin’s supply.
If its holdings flood the market, Bitcoin’s price and confidence could be hit hard. This would potentially trigger a broader selloff across crypto.
Amid already fragile sentiment across the crypto market, attackers exploited Trust Wallet, shaking confidence in self-custody solutions. The breach has impacted hundreds of users, with on-chain data showing that more than $6.77 million has already been stolen. The timing has amplified concern, coming at a moment when investors are already navigating heightened uncertainty, declining prices, and rising risk aversion.
According to the Trust Wallet team, the exploit appears to be linked to a recent update to its Chrome browser extension. In a public statement posted on X, the company urged users to take immediate action, stating: “Users with Browser Extension 2.68 should disable and upgrade to 2.69.” The message suggests that the vulnerability was isolated to a specific version of the extension, rather than the core wallet infrastructure, but the scale of the losses has nonetheless raised alarm.
Trust Wallet is one of the most widely used self-custody wallets in the industry. Reporting a user base of roughly 220 million people globally. That reach makes any security incident particularly significant, not only because of the direct financial impact, but also due to the broader implications for trust in non-custodial platforms.
As investigations continue and affected users assess the damage, the exploit adds another layer of stress to a market already grappling with weak sentiment and elevated skepticism toward crypto infrastructure.
Funds Tracked As Trust Wallet Commits To Full Reimbursement
On-chain investigators have begun tracing the movement of funds linked to the Trust Wallet exploit. According to analysis shared by Lookonchain, the attacker has already transferred approximately $5.5 million through a combination of instant swap services and centralized exchanges, including ChangeNOW, FixedFloat, KuCoin, and HTX.
Routing funds through multiple channels suggests an attempt to obscure flows and accelerate laundering. A pattern commonly observed in recent wallet exploits.
Despite the ongoing movement of stolen assets, Trust Wallet has moved quickly to reassure users. Binance founder and former CEO Changpeng Zhao (CZ) publicly stated that Trust Wallet will fully cover all user losses resulting from the incident. This commitment has been central to calming concerns. Particularly given the wallet’s large global user base and the broader climate of weakened trust in crypto infrastructure.
The Trust Wallet team later reinforced this position with a formal statement, confirming the scale of the impact and outlining next steps. “We’ve confirmed that approximately $7M has been impacted and we will ensure all affected users are refunded,” the team said.
The team added that supporting affected users is the top priority, and they are actively finalizing the refund process. The statement also warned users to avoid interacting with messages that do not originate from official Trust Wallet channels.
As fund tracking continues, the focus has now shifted from damage assessment to execution of reimbursements and restoration of user confidence.
Altcoin Market Holds Key Support As Broader Structure Weakens
The total cryptocurrency market capitalization excluding Bitcoin and Ethereum is trading near the $825 billion level on the weekly chart. Following a sharp pullback from the $1.1–$1.2 trillion highs reached earlier this year. This index, used as a proxy for broader altcoin market health, shows a clear loss of momentum after an aggressive expansion phase. Signaling rising stress across the altcoin sector.
Technically, the market has slipped below its faster weekly moving average, which previously acted as dynamic support during the uptrend. That level has now flipped into resistance, limiting upside attempts.
Price is currently hovering just above the longer-term moving averages, which converge between roughly $780 billion and $820 billion. This zone represents a critical structural support area. A sustained break below it would likely confirm a broader bearish transition for altcoins.
From a market-structure perspective, holding the current range keeps the possibility of consolidation alive. However, failure to defend this support would open the door to a deeper retracement toward the $650–$700 billion region. For a bullish case to re-emerge, the altcoin market would need to reclaim the $900 billion level and reestablish acceptance above its key moving averages.
Featured image from ChatGPT, chart from TradingView.com
As the year draws to a close, XRP investors are increasingly adopting a bearish outlook, anticipating that the altcoin will remain below the critical $2 threshold.
XRP Forecasts Dipped
A recent poll conducted by cryptocurrency exchange Gemini, running from December 12 to 23, reveals that 73% of investors predict XRP will finish the year between $1.50 and $2.00, suggesting a muted conclusion for the altcoin’s performance in 2025.
Just weeks prior, market sentiment was more optimistic, with around 38% of traders expecting XRP to rally to a range of $2.00 to $2.50 by December 31. However, that figure has since dropped to 28%, reflecting a significant decline in confidence.
The possibility of the cryptocurrency exceeding $2.50 appears almost non-existent, as only about 4% of respondents foresee it reaching the $2.50 to $3.00 range, and a similar 4% predict it could surpass $3.00.
The consensus of 73% predicting an XRP finish between $1.50 and $2.00 marks an increase from the 63% recorded earlier in the poll. This growing alignment among poll participants indicates that they are consolidating around this range as the most likely scenario.
Furthermore, the sentiment towards higher price levels has significantly shifted. The percentage of voters anticipating a rally into the mid-$2 range has dwindled to a mere 4%, reflecting dwindling confidence after several failed attempts to break through resistance levels.
Even the outlook for the altcoin’s price to drop below $1.50 has risen slightly to 7%, up from 6%, although most believe a sharp sell-off is unlikely.
Rising Supply From Early Investors
This prevailing sentiment aligns with Futures data indicating a prevalence of aggressive sell orders, while the slow accumulation of XRP in exchange-traded funds (ETFs) at a pace of $30 to $50 million daily cannot keep up with profit-taking and risk reduction activities in the market.
On-chain data reveals that significant realized gains have been secured as XRP approached its recent highs. For instance, a long-term holder who initially acquired the altcoin around $0.40 sold over 350 million tokens at approximately $2.00, reaping an estimated profit of $721 million.
With many early investors reportedly cashing out at the $2 level, there has been minimal support for dip-buying to bolster the price, keeping it in the current range between $1.7 and $1.8 recorded in the week.
Experts suggest that when the supply increases from long-term holders, whose initial investments were made at $0.40 to $0.60, it creates a resistance ceiling that is challenging to break without substantial new demand entering the market.
At the time of writing, XRP was trading at $1.830. The altcoin has recorded major losses in all time frames, with a year-to-date decline of 15%, in line with the broader market’s performance.
Featured image from DALL-E, chart from TradingView.com
On-chain data shows a chunk of the Bitcoin supply has its cost basis above the current spot price, which could potentially shape volatility if BTC rebounds.
Bitcoin Supply Overhang Could Dictate Volatility & Selling Pressure
As pointed out by CryptoQuant community analyst Maartunn in a new post on X, over 6.6 million BTC is being held above the latest spot price of the cryptocurrency. The on-chain indicator of relevance here is the “Supply In Loss,” which measures, as its name suggests, the total amount of Bitcoin that’s currently carrying some net unrealized loss.
The metric works by going through the transaction history of each token in circulation to determine the price at which it was last transacted on the blockchain. If this previous transfer price was more than the current spot price for any coin, then that particular token is considered to be in a state of loss.
The Supply In Loss adds up all coins fulfilling this condition to find the total situation on the network. A counterpart indicator called the Supply In Profit accounts for the supply of the opposite type.
Now, here is the chart shared by Maartunn that shows the trend in the Bitcoin Supply In Loss over the last few years:
As displayed in the above graph, the Bitcoin Supply In Loss shrunk to a value of zero as the asset’s price set its all-time high (ATH) above $126,000 back in October, but with the market downturn that has followed since then, the indicator’s value has shot up.
Today, around 6.6 million tokens of the cryptocurrency sit below cost basis, equivalent to a third of the BTC supply in circulation. The recent highs in the Supply In Loss represent the highest degree of pain in the market since 2023.
In another X post, the analyst has shared the chart for another Bitcoin indicator, this one called the UTXO Realized Price Distribution (URPD). The URPD contains information about how much BTC was bought last at each of the levels that the asset has visited in its history.
From the chart of the URPD, it’s visible how the Bitcoin supply that’s in loss is distributed across the various levels right now. A few levels are particularly prominent in the degree of supply that they carry, while some others are notably thin with coins.
Generally, investors who are in loss look forward to a retest of their cost basis so that they can get their money “back.” Once this happens, some of these hands decide to exit, fearing that BTC will go down again in the near future. This selling can make large supply clusters above the spot price, potential points of volatility.
Considering that a large portion of the supply is underwater right now, a venture back to higher levels could be met with selling pressure for Bitcoin.
BTC Price
Bitcoin has made some recovery during the past day as its price has returned to $88,600.
Bitcoin is struggling to regain momentum below the $90,000 level, yet it continues to hold above $86,000, reflecting a market gripped by indecision. Price action has narrowed into a tight range, with neither buyers nor sellers able to assert clear control.
As volatility compresses, apathy has become a defining feature of the current environment, and an increasing number of analysts are openly discussing the possibility that the market is transitioning toward a broader bear phase.
While price levels dominate headlines, on-chain data suggests the more important battle is unfolding beneath the surface. According to CryptoQuant analyst Burak Kesmeci, Bitcoin’s current positioning cannot be understood by price alone.
Instead, attention is shifting toward the cost bases of key market participants, particularly whales and Binance spot users. Even with Bitcoin trading around $87,000, the most consequential level sits significantly higher.
Data shows that the average cost basis of new whales, defined as holders with coins younger than 155 days, is clustered around $100,500. This zone represents a critical break-even threshold for large players who entered the market recently.
As a result, every approach toward $100,000 carries heightened significance. That level may either trigger distribution, as whales seek to protect capital, or mark the start of renewed accumulation if confidence returns.
Cost Basis Data Maps Bitcoin Real Support and Resistance
The report highlights that beneath Bitcoin’s current price action, cost basis data offers a clearer framework for understanding market risk. For Binance spot users, the average cost basis sits near $56,000. This level represents the largest concentration of spot volume in the market and effectively defines the “deep water” zone if conditions deteriorate.
In a prolonged bearish phase, $56K is where the bulk of spot holders would be tested, making it a critical long-term support area rather than a short-term trading level.
Long-term whale positioning adds another important layer. The cost basis for whales holding Bitcoin longer than 155 days is clustered around $40,000. This means these participants are still sitting on profits of more than 2x, even after the recent correction.
That profit cushion helps explain the rise in realized gains seen over recent weeks. For many long-term holders, current prices already represent a satisfactory exit, increasing the incentive to distribute into strength rather than aggressively accumulate.
Taken together, the data reframes Bitcoin’s market structure. The key short-term ceiling remains near $100,000, where newer whales approach breakeven and supply tends to emerge. On the downside, $56,000 stands out as the level where spot market conviction would be most severely tested.
Bitcoin Consolidates Above Key Weekly Support as Momentum Cools
Bitcoin is trading near the $88,700 level on the weekly chart, stabilizing after a sharp pullback from the $120,000–$125,000 highs reached earlier this cycle. While the broader uptrend from 2024 remains intact, recent price action signals a clear slowdown in momentum. The market has shifted from an impulsive expansion phase into a corrective and consolidative structure, with volatility compressing around a critical support zone.
Technically, Bitcoin is holding just above its rising medium-term moving average, which has acted as dynamic support throughout this bull cycle. The rejection above $110,000 marked a decisive loss of upside control, and the failure to quickly reclaim that zone suggests distribution rather than a brief pause. At the same time, price remains well above the long-term moving average, reinforcing that this move is still corrective within a larger trend, not yet a confirmed trend reversal.
Volume dynamics support this interpretation. Selling pressure expanded during the initial breakdown, but recent weeks show declining volume as price stabilizes between roughly $86,000 and $90,000. This points to seller exhaustion, though buyers have yet to step in with conviction.
Structurally, the $86,000–$88,000 range is pivotal. Holding this zone keeps the higher-timeframe bullish structure alive. A clean breakdown would expose deeper downside. While a recovery above $95,000 would be needed to reassert bullish momentum and reopen the path toward prior highs.
Featured image from ChatGPT, chart from TradingView.com
Ethereum is down $22.29 today or 0.76% to $2922.73
Note: The Ethereum price is a 5 p.m. ET snapshot from Kraken
Data compiled by Dow Jones Market Data
White Label
Data API
Web Plug-in
Pembuat Poster
Program Afiliate
Risiko kerugian dalam perdagangan instrumen kewangan seperti saham, FX, komoditi, niaga hadapan, bon, ETF dan kripto boleh menjadi besar. Anda mungkin mengalami kerugian keseluruhan dana yang anda depositkan dengan broker anda. Oleh itu, anda harus mempertimbangkan dengan teliti sama ada perdagangan sedemikian sesuai untuk anda berdasarkan keadaan dan sumber kewangan anda.
Tiada keputusan untuk melabur harus dibuat tanpa menjalankan usaha wajar secara menyeluruh sendiri atau berunding dengan penasihat kewangan anda. Kandungan web kami mungkin tidak sesuai dengan anda kerana kami tidak mengetahui keadaan kewangan dan keperluan pelaburan anda. Maklumat kewangan kami mungkin mempunyai kependaman atau mengandungi ketidaktepatan, jadi anda harus bertanggungjawab sepenuhnya untuk sebarang keputusan perdagangan dan pelaburan anda. Syarikat tidak akan bertanggungjawab ke atas kehilangan modal anda.
Tanpa mendapat kebenaran daripada tapak web, anda tidak dibenarkan menyalin grafik, teks atau tanda dagangan tapak web. Hak harta intelek dalam kandungan atau data yang dimasukkan ke dalam laman web ini adalah milik pembekal dan pedagang pertukarannya.
Tidak log masuk
Log masuk untuk mengakses lebih banyak ciri

Keahlian FastBull
Belum lagi
Belian
Log masuk
Daftar