

Kutipan
Berita
Analisis
Pengguna
24/7
Kalender Ekonomi
Pendidikan
Data
- Nama
- Nilai Terbaru
- Sblm.


Akun Sinyal untuk Anggota
Semua Akun Sinyal
Semua Kontes
 U.K. Neraca Perdagangan Non-Uni Eropa (Penyesuaian Per Kuartal) (Okt)
S:--
P: --
S: --
U.K. Akun Perdagangan (Okt)S:--
P: --
S: --
U.K. Indeks Sektor Jasa MoMS:--
P: --
S: --
U.K. Output Sektor Konstruksi MoM (Penyesuaian Per Kuartal) (Okt)S:--
P: --
S: --
U.K. Output Industri YoY (Okt)S:--
P: --
S: --
U.K. Akun Perdagangan (Penyesuaian Per Kuartal) (Okt)S:--
P: --
S: --
U.K. Neraca Perdagangan Uni Eropa (Penyesuaian Per Kuartal) (Okt)S:--
P: --
S: --
U.K. Output Manufaktur YoY (Okt)S:--
P: --
S: --
U.K. PDB MoM (Okt)S:--
P: --
S: --
U.K. PDB YoY (Penyesuaian Per Kuartal) (Okt)S:--
P: --
S: --
U.K. Output Industri MoM (Okt)S:--
P: --
S: --
U.K. Output Sektor Konstruksi YoY (Okt)S:--
P: --
S: --
 Perancis Indeks Harga Konsumen Final MoM (Nov)
S:--
P: --
S: --
 China, Daratan Pertumbuhan Kredit Tidak Dibayarkan YoY (Nov)
S:--
P: --
S: --
China, Daratan Uang Beredar M2 YoY (Nov)S:--
P: --
S: --
China, Daratan Uang Beredar M0 YoY (Nov)S:--
P: --
S: --
China, Daratan Uang Beredar M1 YoY (Nov)S:--
P: --
S: --
 India IHK YoY (Nov)
S:--
P: --
S: --
India Pertumbuhan Deposito YoYS:--
P: --
S: --
 Brazil Pertumbuhan Sektor Jasa YoY (Okt)
S:--
P: --
S: --
 Meksiko Nilai Produksi Industri YoY (Okt)
S:--
P: --
S: --
 Rusia Akun Perdagangan (Okt)
S:--
P: --
S: --
 Presiden Fed Philadelphia Henry Paulson menyampaikan pidato
 Kanada Izin Konstruksi MoM (Penyesuaian Per Kuartal) (Okt)
S:--
P: --
S: --
Kanada Penjualan Grosir YoY (Okt)S:--
P: --
S: --
Kanada Stok Grosir MoM (Okt)S:--
P: --
S: --
Kanada Stok Grosir YoY (Okt)S:--
P: --
S: --
Kanada Penjualan Grosir MoM (Penyesuaian Per Kuartal) (Okt)S:--
P: --
S: --
 Jerman Rekening Koran (Sebelum Penyesuaian Per Kuartal) (Okt)
S:--
P: --
S: --
Amerika Serikat Total Pengeboran MingguanS:--
P: --
S: --
Amerika Serikat Total Nilai Pengeboran Bahan Bakar Fosil MingguanS:--
P: --
S: --
 Jepang Indeks Difusi Non-Manufaktur Besar Tankan (kuartal 4)
--
P: --
S: --
Jepang Indeks Prospek Manufaktur Kecil Tankan (kuartal 4)--
P: --
S: --
Jepang Indeks Prospek Non-Manufaktur Besar Tankan (kuartal 4)--
P: --
S: --
Jepang Indeks Prospek Manufaktur Besar Tankan (kuartal 4)--
P: --
S: --
Jepang Indeks Difusi Manufaktur Kecil Tankan (kuartal 4)--
P: --
S: --
Jepang Indeks Difusi Manufaktur Besar Tankan (kuartal 4)--
P: --
S: --
Jepang Nilai Belanja Modal Perusahaan-Besar Tankan YoY (kuartal 4)--
P: --
S: --
U.K. Indeks Harga Properti Residential - Rightmove YoY (Des)--
P: --
S: --
China, Daratan Output Industri YoY (Awal Sampai Akhir Tahun) (Nov)--
P: --
S: --
China, Daratan Tingkat Pengangguran Perkotaan (Nov)--
P: --
S: --
 Arab Saudi IHK YoY (Nov)
--
P: --
S: --
 Zona Euro Output Industri YoY (Okt)
--
P: --
S: --
Zona Euro Output Industri MoM (Okt)--
P: --
S: --
Kanada Tingkat Penjualan Rumah Siap Huni MoM (Nov)--
P: --
S: --
Zona Euro Total Aset Cadangan (Nov)--
P: --
S: --
U.K. Ekspektasi Inflasi--
P: --
S: --
Kanada Indeks Keyakinan Ekonomi Nasional--
P: --
S: --
Kanada Konstruksi Rumah Baru (Nov)--
P: --
S: --
Amerika Serikat Indeks Tenaga Kerja Manufaktur Fed New York (Des)--
P: --
S: --
Amerika Serikat Indeks Manufaktur Fed New York (Des)--
P: --
S: --
Kanada IHK Inti YoY (Nov)--
P: --
S: --
Kanada Pesanan Belum Selesai Manufaktur MoM (Okt)--
P: --
S: --
Kanada Pesanan Baru Manufaktur MoM (Okt)--
P: --
S: --
Kanada IHK Inti MoM (Nov)--
P: --
S: --
Kanada Stok Manufaktur MoM (Okt)--
P: --
S: --
Kanada IHK YoY (Nov)--
P: --
S: --
Kanada IHK MoM (Nov)--
P: --
S: --
Kanada IHK YoY (Penyesuaian Per Kuartal) (Nov)--
P: --
S: --
Kanada IHK Inti MoM (Penyesuaian Per Kuartal) (Nov)--
P: --
S: --

Tidak Ada Data Yang Cocok
Opini Terbaru
Opini Terbaru
Topik Populer
Kolumnis Teratas
Terbaru
Label putih
Data API
Web Plug-ins
Program Afiliasi
Lihat Semua
Tidak ada data
Bitcoin price started a fresh increase and tested the $108,800 zone. BTC is struggling to rise further and is correcting gains below $108,000.
Bitcoin Price Starts Fresh Increase
Bitcoin price started a fresh increase from the $104,500 support zone. BTC climbed above the $105,500 and $106,200 levels to enter a positive zone.
The price even jumped above the $108,000 resistance. However, the bears remained active amid rising global conflict fears. A high was formed at $108,898 and the price is now correcting gains. There was a move below the $108,000 level. The price dipped below the 23.6% Fib retracement level of the upward move from the $104,529 swing low to the $108,898 high.
Besides, there was a break below a bullish trend line with support at $107,800 on the hourly chart of the BTC/USD pair. Bitcoin is now trading above $106,800 and the 100 hourly Simple moving average.
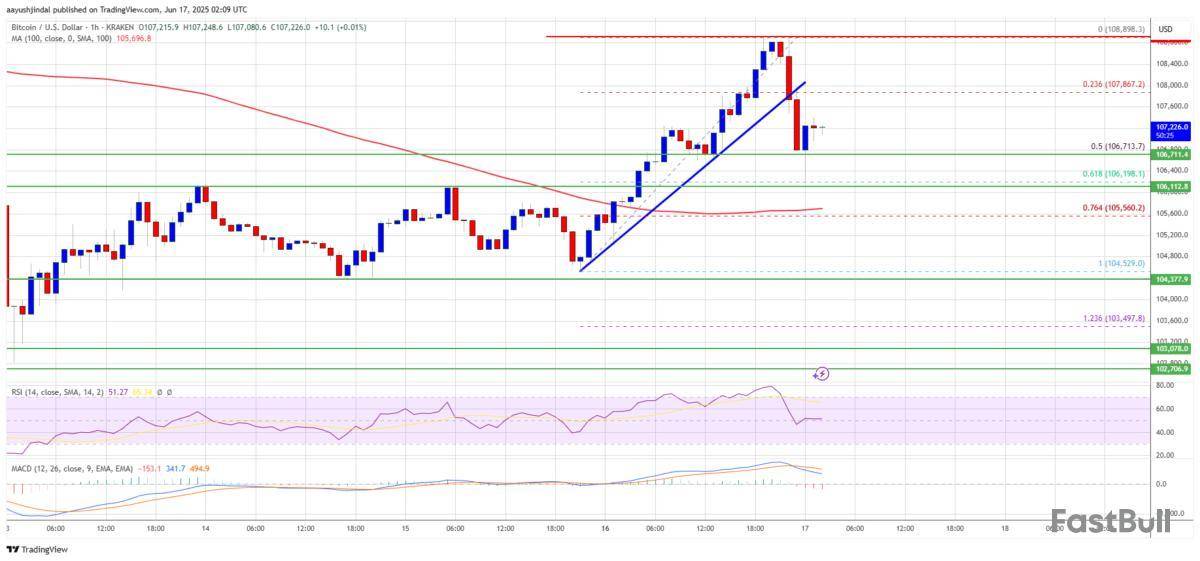
On the upside, immediate resistance is near the $107,600 level. The first key resistance is near the $108,000 level. The next key resistance could be $108,800. A close above the $108,800 resistance might send the price further higher. In the stated case, the price could rise and test the $110,000 resistance level. Any more gains might send the price toward the $112,000 level.
More Losses In BTC?
If Bitcoin fails to rise above the $108,000 resistance zone, it could start another decline. Immediate support is near the $106,700 level and the 50% Fib retracement level of the upward move from the $104,529 swing low to the $108,898 high. The first major support is near the $106,200 level.
The next support is now near the $105,500 zone. Any more losses might send the price toward the $103,500 support in the near term. The main support sits at $102,000, below which BTC might gain bearish momentum.
Technical indicators:
Hourly MACD – The MACD is now gaining pace in the bearish zone.
Hourly RSI (Relative Strength Index) – The RSI for BTC/USD is now near the 50 level.
Major Support Levels – $106,700, followed by $105,500.
Major Resistance Levels – $107,600 and $108,000.
Bitwise Asset Management’s European research arm argues that the sharp sell-off that followed last week’s military escalation between Iran and Israel is likely to give way to a powerful relief rally in Bitcoin, echoing the cryptocurrency’s behaviour after earlier geopolitical shocks. In its 16 June weekly newsletter Bitwise Europe points to a “Chart of the Week” that lines up the twenty most significant geopolitical risk events since July 2010 and finds that, on average, Bitcoin was “up 31.2 percent fifty days after the event, with a median gain of 10.2 percent.”
According to the authors, “major geopolitical risk events tend to be good buying opportunities for bitcoin and other crypto assets.” The firm’s in-house Crypto Asset Sentiment Index briefly turned negative on Friday—its first dip below zero since May—but had already swung back into slightly bullish territory by Monday morning, a shift Bitwise attributes to renewed inflows into spot exchange-traded products and continued US-dollar weakness. At Bitcoin’s current price of around $107,000, a 31% rally would bring it to approximately $140,000.
Missiles Fly, Bitcoin To $140,000?
The historical analogue is being tested in real time as markets digest the first open exchange of missiles between Tehran and Jerusalem. The Associated Press reports that Iran has fired more than 370 projectiles at Israel since 13 June, killing at least twenty-four people, while Israel claims to have destroyed over 120 Iranian launchers and says it now enjoys “full aerial superiority over Tehran.”
The confrontation triggered a textbook flight to safety: gold blasted through $3,430 an ounce on Friday, establishing a fresh record high, while Brent crude spiked and global equities lurched lower. Bitcoin, which had been flirting with its all-time peak near $111,000 early last week, sank as low as $102,600 during the first wave of air-strike headlines before rebounding to the $106,000–107,000 zone. Even after that drawdown, Bitwise notes, the flagship cryptocurrency still out-performed the S&P 500 on a weekly basis thanks to a late-week equity swoon.
Bitwise’s thesis rests on three pillars. First is behavioural: previous geopolitical shocks—from Russia’s 2014 annexation of Crimea to the US–Iran standoff of January 2020—produced knee-jerk liquidations in risk assets, yet Bitcoin’s selling pressure tended to exhaust quickly, setting the stage for a mean-reversion pop. Second is macroeconomic.
The firm highlights a “pronounced depreciation of the US Dollar,” as the DXY index slid to its weakest level since March 2022 following softer-than-expected inflation prints and another uptick in continuing unemployment claims. Fed-funds futures now imply 1.9 rate cuts by December 2025, loosening global financial conditions and historically favourable for non-yielding, dollar-denominated assets such as Bitcoin.
Third is structural demand: US spot Bitcoin ETFs took in a net $1.37 billion last week, while corporate treasuries kept accumulating—Strategy’s Michael Saylor announced the acquisition of 10,100 BTC for $1.05 billion today , and Tokyo-listed Metaplanet disclosed an additional 1,112 BTC purchase that brings its war chest to 10,000 coins.
In derivatives, Bitwise flags that the put-call open-interest ratio on Bitcoin options ended the week at 0.61 after dipping to 0.55, while the one-month 25-delta skew flipped decisively into positive territory at +4.87 percent, indicating a premium for upside exposure despite realised volatility languishing around 30 percent. Funding rates on perpetual swaps also remained net long even during Thursday’s risk-off purge, a pattern the firm interprets as “bullish positioning or demand for topside hedging.” Behind the scenes, whales withdrew a net 169,527 BTC from exchanges, and exchange-held reserves fell to 2.92 million coins—about 14.6 percent of supply—further tightening spot liquidity.
Sceptics may note that past performance is not predictive and that the explosive rally following Russia’s 2022 invasion of Ukraine was fuelled in part by unprecedented monetary stimulus that may not be replicated. Bitwise itself concedes that realised losses spiked to $55.5 million on-chain last week and that momentum in “apparent demand” has softened.
Yet the firm argues that the confluence of structural inflows, dollar weakness and depressed sentiment mirrors the set-ups that preceded its historical sample of 31-percent rallies. As the newsletter concludes, “structural demand by both ETPs and corporate treasuries as well as continued macro tailwinds via Dollar weakness and global money supply expansion still support a positive market development for bitcoin and crypto assets.”
At press time, BTC traded at $107,239.
An analyst has explained how Dogecoin might have to hold strong above this level, if the memecoin has to avoid a 30% price drop.
Dogecoin Is Currently Trading Inside A Symmetrical Triangle
In a new post on X, analyst Ali Martinez has shared a chart that shows where Dogecoin currently stands from a technical analysis (TA) perspective. Below is the graph in question, showing the trend in the 1-day price of the memecoin.
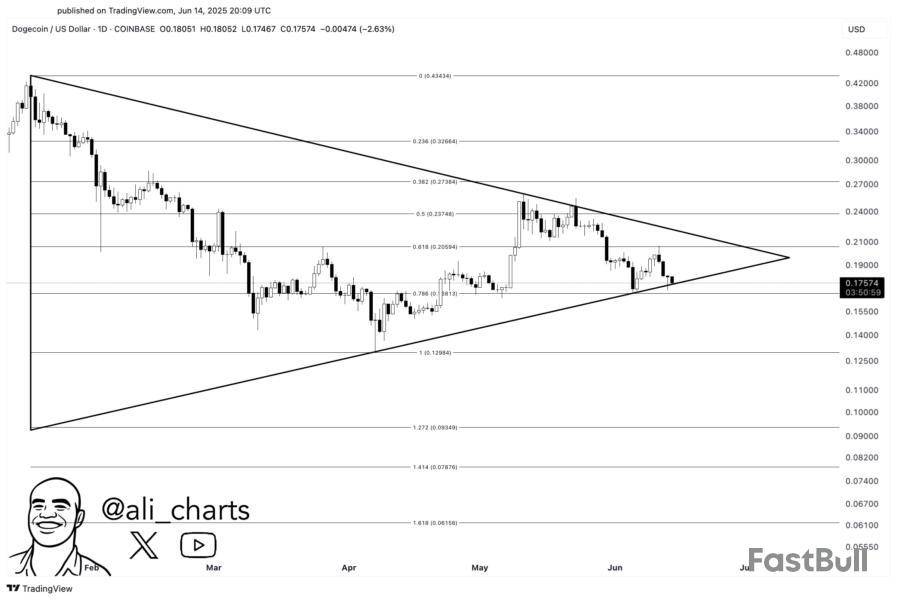
From the chart, it’s visible that the Dogecoin price has possibly been trading inside a triangular channel during the last few months. The channel hasn’t appeared to be just any triangle-shaped one, either, but a special type called the Symmetrical Triangle.
A Symmetrical Triangle forms whenever an asset observes consolidation between two trendlines converging at a roughly equal and opposite slope. The upper line of the pattern tracks lower highs in the price, and the lower one higher lows.
As the asset moves inside this channel, its range becomes narrower with time, until it shrinks down to a point at the apex. Generally, volatile moves are more likely to occur when consolidation tightens, so a breakout of the pattern becomes increasingly probable as the price approaches the tip of the triangle
Symmetrical Triangle breakouts can signal a continuation of the trend in the direction of the break. This means that a rise above the pattern can be a bullish sign, while a drop below it may be a bearish one.
As displayed in the chart, the 1-day price of Dogecoin has recently been nearing the end of the triangle, a potential sign that a breakout could be imminent. Currently, the memecoin is retesting the lower line, so it will be interesting to see whether the level holds or if this is where a break would finally happen.
Unlike the Ascending and Descending Triangles, two other popular types of triangular channels in TA, breakouts are usually considered to be equally probable in either direction for a Symmetrical Triangle. The reason is simple: consolidation occurs in an exactly sideways manner in this pattern. In contrast, the Ascending and Descending types slope upward and downward, respectively, which can bias the breakout direction.
Thus, even if Dogecoin is retesting the lower level right now, a rebound and then breakout from the upper line may also still be quite possible. That said, in the event that a bearish breakout does take place, things can be especially troubling for DOGE, as there is another level of importance just nearby.
The level in question, situated around $0.168, corresponds to the 0.786 Fibonacci Retracement level. Fibonacci Retracement levels are lines defined using ratios found in the famous Fibonacci series. “Dogecoin $DOGE must hold above $0.168 to avoid a 30% price drop!” warns the analyst.
DOGE Price
At the time of writing, Dogecoin is trading around $0.177, down over 4% in the last week.
After weeks of false starts and sideways grinding, XRP has finally displayed meaningful life on the chart, posting a strong rebound and possibly paving the way for a more widespread reversal. As of press time, XRP had risen by almost 5% for the day, surpassing local resistance and setting up a breakout above the 50 EMA and the 100 EMA, two crucial moving averages.
This newfound vigor follows a triple test of the 200 EMA, which remained a solid support level close to $2.10. The strength of each bounce has increased, indicating seller fatigue and rising buyer interest. Now that volume is increasing and the RSI is approaching bullish territory (it is currently at about 52), XRP is ready for an upward continuation if momentum continues. Chart by TradingView">
A close above the area where the 50 and 100 EMAs converge, which is situated squarely between $2.25 and $2.28, would be the most noteworthy technical milestone. A push toward the $2.50-$2.60 range, which is home to a cluster of previous rejection wicks, might be possible if that zone were decisively reclaimed. This would change the short- to medium-term structure to bullish.
Additionally, the neckline of a larger ascending triangle that has been in place since April is a structurally significant area where this bounce occurs. If validated, that pattern points to XRP's long-term reversal thesis and may signal the start of a fresh upward trend, which bulls have been craving in the wake of Bitcoin's hegemony. Even though XRP is still in the woods, its pulse is more robust than it has been in weeks.
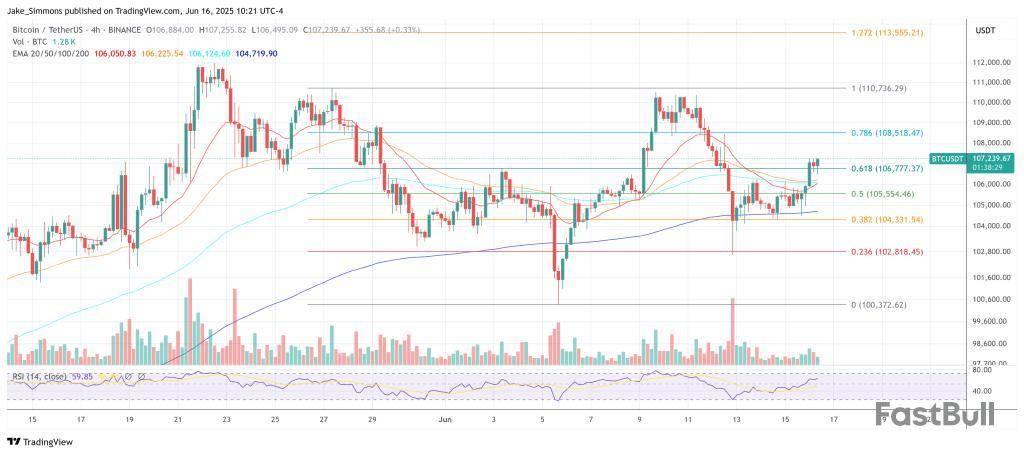
Bitcoin: Things heating up
Bitcoin is once again heating up, and it is showing indications that a move toward its all-time high (ATH) may be imminent if and only if it can overcome the final technical barrier, which is the descending trendline that has capped all of the recent highs. BTC is currently trading above $106,000, maintaining a strong hold above the 20 and 50-day key short-term EMAs and gaining steady momentum.
Since the last decline to $103,000, the price action has been volatile but bullish forming a string of higher lows. As a bullish indication that the underlying trend is still in favor of buyers, the 50 EMA keeps serving as dynamic support. Before entering overbought territory, the RSI has plenty of room to expand as it stays in the neutral zone (~53).
Because of the obvious descending trendline that is just above the current price range, this is not yet a full-blown breakout. This line, which was taken from the peak in early June close to $112,000, has established a ceiling that Bitcoin has precisely adhered to. Until this trendline is decisively broken, the market might stay choppy, stalling at around $110,000. The structure, however, is leaning bullish.
The combination of rising support levels and consolidation below resistance creates a classic continuation pattern known as an ascending triangle. There is not much technically left to stop a retest of ATH territory and beyond if Bitcoin can break above $110,000 and hold. Although the tapering volume may cause some concern, a spike in trading activity as the price presses against the descending line could support the breakout scenario.
Is Solana ready?
Solana's chart is starting to resemble the classic head and shoulders (H&S) pattern, which is frequently linked to bearish breakdowns and trend reversals. This could be a warning to bullish traders. The structure is starting to become apparent even though the market has not confirmed the setup yet.
According to the chart, SOL reached its peak in late May at about $170 (the head) with two lower highs at about $160 forming the shoulders on either side. The $145-$147 range, which has served as support several times over the past month, seems to be the neckline's current range. If SOL breaks below that neckline with significant volume, we may witness a more severe short-term retracement down toward the $125-$130 range. The H&S pattern is typically a bearish reversal signal.
The upside potential appears limited for the time being unless bulls can mount a strong surge, as SOL has had difficulty breaking above the 100 and 200 EMAs. They are currently at $157 and $161, respectively. It is not finalized, though. If buyers are able to invalidate the neckline breach and force SOL past $162, the entire formation may be scrapped because the right shoulder is still developing.
In that case, Solana would return to its bullish stance, targeting a retest of $170 and perhaps higher. Volume is still a crucial component that is lacking; thus far there has not been a clear volume spike that would indicate a breakout or a breakdown. The RSI is neutral with a slight bearish inclination hovering just below 50.
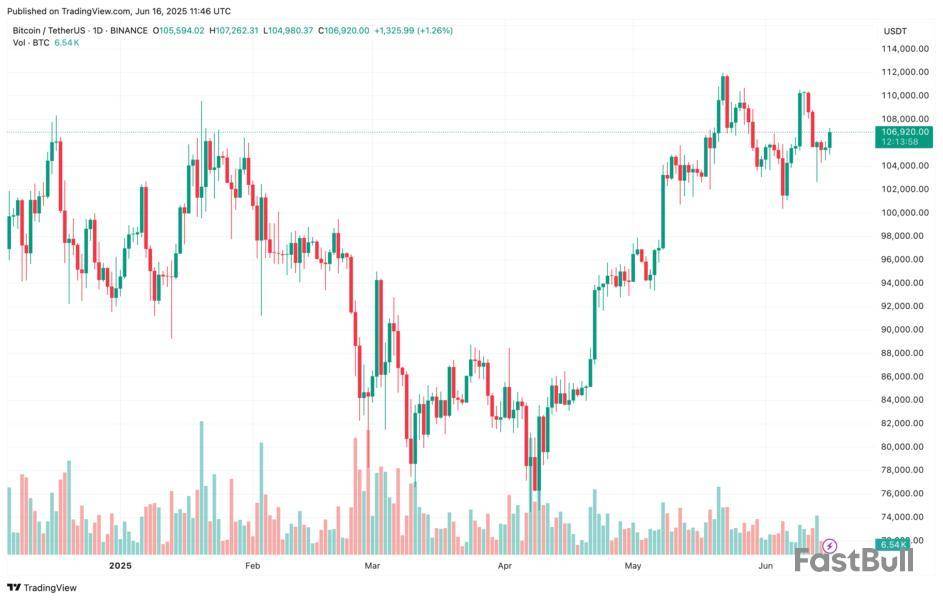
As Bitcoin (BTC) reels amidst escalating geopolitical tensions between Israel and Iran – dropping from $110,530 on June 9 to just above $106,900 today – concerns are mounting that BTC’s upward momentum may have stalled. However, on-chain data suggests that both Bitcoin whales and retail investors still anticipate further upside for the leading cryptocurrency.
Bitcoin Whale And Retail Inflows To Binance Tumble
According to a recent CryptoQuant Quicktake post by contributor Darkfost, Bitcoin inflows to Binance crypto exchange from two distinct cohorts – whales and retail investors – have fallen to their lowest levels in the current market cycle.
Darkfost shared the following chart illustrating that Bitcoin whale inflows to Binance have hit their lowest point since 2024. Similarly, retail investor inflows are also at their lowest since 2024, signalling a strong preference to hold rather than sell.
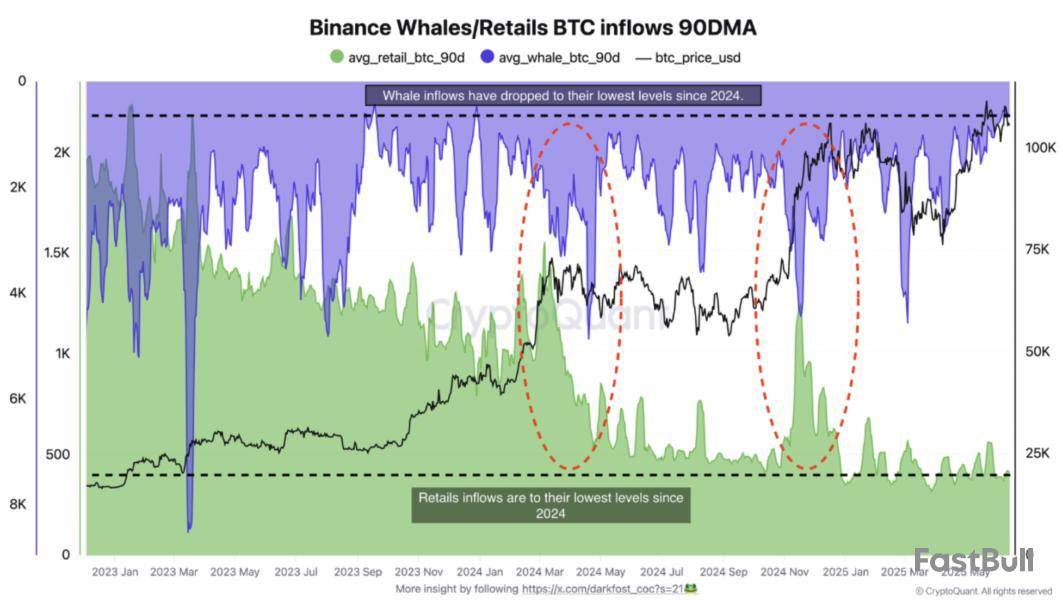
The contributor emphasized that this alignment in behavior between whales and retail investors is a “highly constructive signal for the market.” Apart from the consistent inflows observed at the start of the current cycle, Darkfost identified two previous instances when both groups acted in sync.
Notably, such periods of aligned behavior have typically coincided with previous market tops. These tops were marked by synchronized BTC inflows into exchanges, leading to a significant uptick in selling pressure and, eventually, market demand exhaustion.
Commenting on the recent drop in BTC inflows, Darkfost suggested that market participants may be waiting for clearer macroeconomic cues or are simply exhibiting high conviction in Bitcoin’s long-term potential. They added:
Such alignment across investor classes may also reflect broader market confidence, with expectations of further profits ahead.
Recent trading setups support the aforementioned outlook. In a separate X post, seasoned crypto analyst Ash Crypto highlighted that a Bitcoin whale had opened a massive $200 million long position with 20x leverage.
Should BTC Holders Be Worried?
Despite the encouraging dip in BTC inflows to major exchanges like Binance, some analysts warn that a deeper correction may be imminent. For example, TradingView analyst MIRZA recently predicted that BTC could fall as low as $85,000.
Similarly, veteran trader Peter Brandt shared a cautionary note, that BTC may see a steep slide in the coming months. Brandt stated that if BTC mirrors the 2021-22 market cycle, then it may risk falling to as low as $23,600.
That said, BTC outflows from exchanges continue to rise, depleting available reserves – a dynamic that could result in a supply shock. As of this writing, BTC is trading at $106,920, up 1.8% over the past 24 hours.
728 RM B 7/F GEE LOK IND BLDG NO 34 HUNG TO RD KWUN TONG KLN HONG KONG


Label putih
Data API
Web Plug-ins
Pembuat Poster
Program Afiliasi
Berdagang Instrumen Keuangan Seperti Saham, Mata Uang, Komoditas, Kontrak Berjangka, Obligasi, Dana, Atau Mata Uang Kripto Adalah Perilaku Berisiko Tinggi, Termasuk Kehilangan Sebagian Atau Seluruh Jumlah Investasi Anda, Sehingga Perdagangan Tidak Cocok Untuk Semua Investor.
Anda Harus Melakukan Uji Tuntas Anda Sendiri, Menggunakan Penilaian Anda Sendiri, Dan Berkonsultasi Dengan Penasihat Yang Memenuhi Syarat Saat Membuat Keputusan Keuangan Apa Pun. Konten Situs Web Ini Tidak Ditujukan Kepada Anda, Situasi Keuangan Atau Kebutuhan Anda Juga Tidak Diperhitungkan. Informasi Yang Terdapat Di Situs Web Ini Belum Tentu Tersedia Secara Waktu Nyata, Juga Belum Tentu Akurat. Setiap Pesanan Atau Keputusan Keuangan Lainnya Yang Anda Buat Sepenuhnya Menjadi Tanggung Jawab Anda Dan Anda Tidak Boleh Bergantung Pada Informasi Apa Pun Yang Disediakan Melalui Situs Web. Kami Tidak Memberikan Jaminan Apa Pun Untuk Informasi Apa Pun Di Situs Web Dan Tidak Bertanggung Jawab Atas Kerugian Transaksi Apa Pun Yang Mungkin Timbul Dari Penggunaan Informasi Apa Pun Di Situs Web.
Dilarang Menggunakan, Menyimpan, Menggandakan, Menampilkan, Memodifikasi, Menyebarluaskan Atau Mendistribusikan Data Yang Terdapat Dalam Situs Web Ini Tanpa Izin Tertulis Dari Situs Web Ini. Semua Hak Kekayaan Intelektual Dilindungi Oleh Pemasok Dan Bursa Yang Menyediakan Data Yang Terdapat Di Situs Web Ini.
Tidak Masuk
Masuk untuk mengakses lebih banyak fitur

Anggota FastBull
Belum
Pembelian


Masuk
Daftar


