


- EURUSD
- XAUUSD
- XAGUSD
- WTI
- USDX


Citations
Analyse
Utilisateur
24/7
Calendrier économique
Education
Données
- Des noms
- Dernier
- Précédent


















What really is altcoin season?
Altcoin season, often called “altseason,” occurs when a significant portion of altcoins, cryptocurrencies other than Bitcoin, experience rapid price increases that outpace Bitcoin’s performance.
This period is characterized by a shift of investor capital from Bitcoin into assets such as Ether , Solana , Cardano (ADA) and even smaller tokens like Dogecoin or Pudgy Penguins (PENGU).
The Altcoin Season Index is frequently used as a benchmark. Per Blockchain Center’s definition, altseason is considered underway when at least 75% of the top 100 altcoins outperform Bitcoin over a 90-day period.
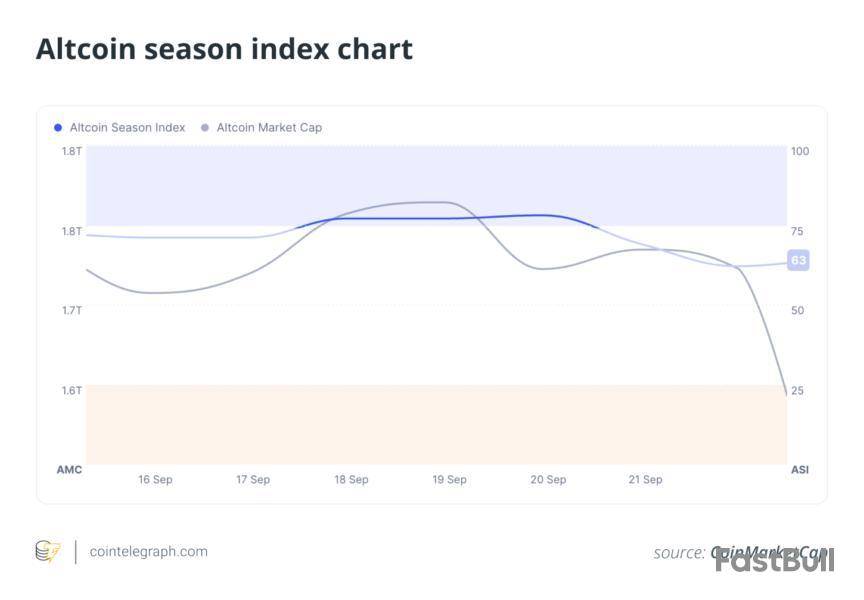
Historically, altcoin seasons have delivered outsized returns. For instance, during the 2021 cycle, large-cap altcoins gained approximately 174%, while Bitcoin advanced only about 2% over the same span.
These episodes raise a central question: What factors consistently drive altcoin season, and why do they matter?
Bitcoin’s price cycle: The catalyst for altcoin rallies
Bitcoin is the crypto market’s bellwether. Its price movements often set the stage for altcoin season. Typically, altseason follows a Bitcoin bull run.
When Bitcoin surges, say, crossing milestones such as $100,000, as it did in late 2024, investors pour capital into the market. Once Bitcoin’s price stabilizes or consolidates, traders often rotate their profits into altcoins, seeking higher returns from more volatile assets.
This pattern is rooted in market psychology. Bitcoin’s rally attracts new capital, boosting overall market confidence. As Bitcoin’s growth slows, investors look for the next big opportunity, and altcoins, with their potential for outsized gains, become the go-to choice. For instance, after Bitcoin’s 124% gain in 2024, 20 of the top 50 altcoins outperformed it, signaling the early stages of an altseason.
A key metric to watch is Bitcoin dominance (BTC.D), which measures Bitcoin’s share of the total crypto market capitalization. When BTC.D drops below 50%-60%, it often signals capital flowing into altcoins. In August 2025, Bitcoin dominance fell to 59% from 65%, hinting at an impending altseason.
Market sentiment and FOMO: The psychological fuel
Altcoin season thrives on human emotion, specifically, the fear of missing out (FOMO). As altcoins like Ether or memecoins like Pepe (PEPE) start posting double- or triple-digit gains, social media platforms like X, Reddit and Telegram light up with hype.
This buzz creates a feedback loop: Rising prices attract more investors, which drives prices higher still. In 2024, memecoins like Dogwifhat (WIF) surged over 1,100%, fueled by community-driven excitement.
Social media trends are a leading indicator of altcoin season. Heightened discussions on platforms like X often precede price rallies, as retail investors jump in to capitalize on the momentum.
For example, in 2025, Google Trends data for “altcoins” shattered records, reaching an all-time high in August, surpassing the May 2021 altseason peak, with search interest entering “price discovery” during Bitcoin’s consolidation above $110,000. This surge reflects exploding retail FOMO, especially for ETH, SOL and memecoins like DOGE, as institutional exchange-traded fund (ETF) inflows (e.g., $4 billion into ETH) rotate capital into altcoins.
Macroeconomic factors: Liquidity and risk appetite
The broader economic landscape plays a massive role in the altcoin season. Macroeconomic conditions like interest rates, inflation and global liquidity significantly influence crypto markets.
When central banks, such as the US Federal Reserve, cut interest rates or increase liquidity through measures like quantitative easing, riskier assets like altcoins tend to thrive. Lower interest rates push investors away from traditional safe havens like bonds and into high-risk, high-reward assets like altcoins.
For instance, analysts are hoping that Fed rate cuts in 2025 could inject liquidity into markets, fueling altcoin momentum. Conversely, tighter monetary policies can suppress altcoin growth by reducing market liquidity. In 2020-2021, aggressive money printing and low interest rates created a perfect storm for altcoins, with the altcoin market cap hitting record highs.
Geopolitical events and regulatory developments also matter. Pro-crypto policies in major markets, such as the US or EU, boost investor confidence and drive capital into altcoins. For example, the 2024 approval of Ether spot ETFs, with inflows reaching nearly $4 billion in August 2025, shows how regulatory clarity sparks altcoin rallies.Technological innovation and new narratives
Altcoin season isn’t just about hype; it’s often driven by technological advancements and emerging narratives. Each altseason tends to have a defining theme.
In 2017, it was the initial coin offering (ICO) boom. In 2021, decentralized finance (DeFi) and non-fungible tokens (NFTs) took center stage. In 2025, analysts point to AI-integrated blockchain projects, tokenization of real-world assets (RWAs) and layer-2 solutions as key drivers.
Platforms like Ethereum, Solana and Avalanche are gaining traction for their scalability and ability to support tokenized securities, from stocks to real estate. These innovations attract institutional capital, which often flows into altcoins before retail investors pile in.
Ethereum, in particular, plays a pivotal role. As the backbone of DeFi, NFTs and layer-2 solutions, Ether’s price surges often signal the start of broader altcoin rallies.
Institutional and retail capital: The money flow
The crypto market has matured, and institutional adoption is now a major driver of altcoin season. Unlike past retail-led booms, in 2025, institutional capital drives altcoin season, with Bitcoin dominance dropping below 59%, echoing 2017 and 2021 pre-altseason trends.
Ether ETFs amassed nearly $4 billion in inflows in August 2025 alone, while Solana and XRP (XRP) ETF reviews signal broader adoption. The US Securities and Exchange Commission’s streamlined ETF listing rules in September boosted over 90 applications, with XRP ETF approval odds at 95%, potentially unlocking $4.3 billion-$8.4 billion.
Solana exchange-traded products saw $1.16 billion year-to-date inflows, and CME’s SOL/XRP futures options launch in October 2025 will draw hedge funds. Retail investors amplify this via FOMO, with memecoins like DOGE ( 10% to $0.28) and presale tokens surging.
CryptoQuant shows altcoin trading volume on Binance Futures hitting $100.7 billion daily in July 2025 (the highest since February), driven by altcoin-to-stablecoin trades, not BTC rotation.
DeFi total value locked (TVL) reached over $140 billion, and the Altcoin Season Index hit 76, with 75% of altcoins outperforming BTC. This $4-trillion market cap growth reflects fresh capital. October’s ETF decisions could trigger over $5 billion of inflows, blending institutional stability with retail hype for sustained altcoin rallies in Q4.
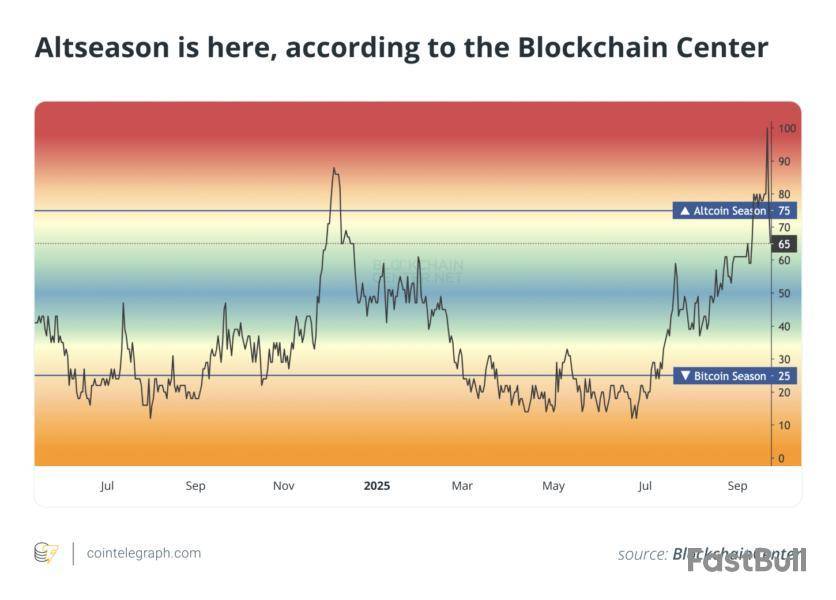
Key metrics to watch: How to spot altcoin season
In the past, analysts have suggested that altcoin season was signaled when Bitcoin dominance fell below 55%, along with an Altcoin Season Index above 75, rising altcoin-to-stablecoin volumes and technical indicators.
To navigate altcoin season, investors rely on several indicators:
Risks and strategies to navigate altcoin season
While altcoin season offers massive opportunities, it’s not without risks. Altcoins are highly volatile, often losing 50%-90% of their value post-peak. Speculative hype, scams and regulatory uncertainty can also derail gains.
To maximize returns, you could consider these strategies:
However, caution is key. The crypto market is unpredictable, and altseason is often only clear in hindsight. By understanding the drivers, such as Bitcoin’s cycle, market sentiment, macro conditions and technological trends, investors can position themselves to ride the wave while managing risks.

728 RM B 7/F GEE LOK IND BLDG NO 34 HUNG TO RD KWUN TONG KLN HONG KONG





Le risque de perte dans la négociation d'instruments financiers tels que les actions, les devises, les matières premières, les contrats à terme, les obligations, les ETF et les crypto-monnaies peut être substantiel. Vous pouvez subir une perte totale des fonds que vous déposez auprès de votre courtier. Par conséquent, vous devez examiner attentivement si ce type de négociation vous convient, compte tenu de votre situation et de vos ressources financières.
Aucune décision d'investissement ne doit être prise sans avoir procédé soi-même à une vérification préalable approfondie ou sans avoir consulté ses conseillers financiers. Le contenu de notre site peut ne pas vous convenir car nous ne connaissons pas votre situation financière et vos besoins en matière d'investissement. Nos informations financières peuvent avoir un temps de latence ou contenir des inexactitudes, de sorte que vous devez être entièrement responsable de vos décisions en matière de négociation et d'investissement. La société ne sera pas responsable de vos pertes en capital.
Sans l'autorisation du site web, vous n'êtes pas autorisé à copier les graphiques, les textes ou les marques du site web. Les droits de propriété intellectuelle sur le contenu ou les données incorporées dans ce site web appartiennent à ses fournisseurs et marchands d'échange.
Non connecté
Se connecter pour accéder à d'autres fonctionnalités


Se connecter
S'inscrire


