


Daily Technical Analysis: [10 MAR]
1. GBP/USD Analysis:
News Summary:
The surge in oil and gas prices triggered by the conflict in the Middle East is creating significant inflation risks for the United Kingdom. According to estimates from ING, if the recent increases in oil and gas prices are sustained, UK inflation could rise to more than twice the Bank of England’s 2% target. Earlier, crude oil prices surpassed $100 per barrel for the first time since 2022. As the Bank of England faces the prospect that UK inflation could rebound to as high as 5%, investors are increasingly betting that expectations for near-term interest rate cuts may be reversed.
Trend Analysis:
We can see GBP/USD has shown a modest rebound on the H4 chart and is trading above the 48 hours moving average. Meanwhile, both the MACD double line and histogram bars are shrinking near the zero axis. The sell limit could be set, stop loss is necessary.
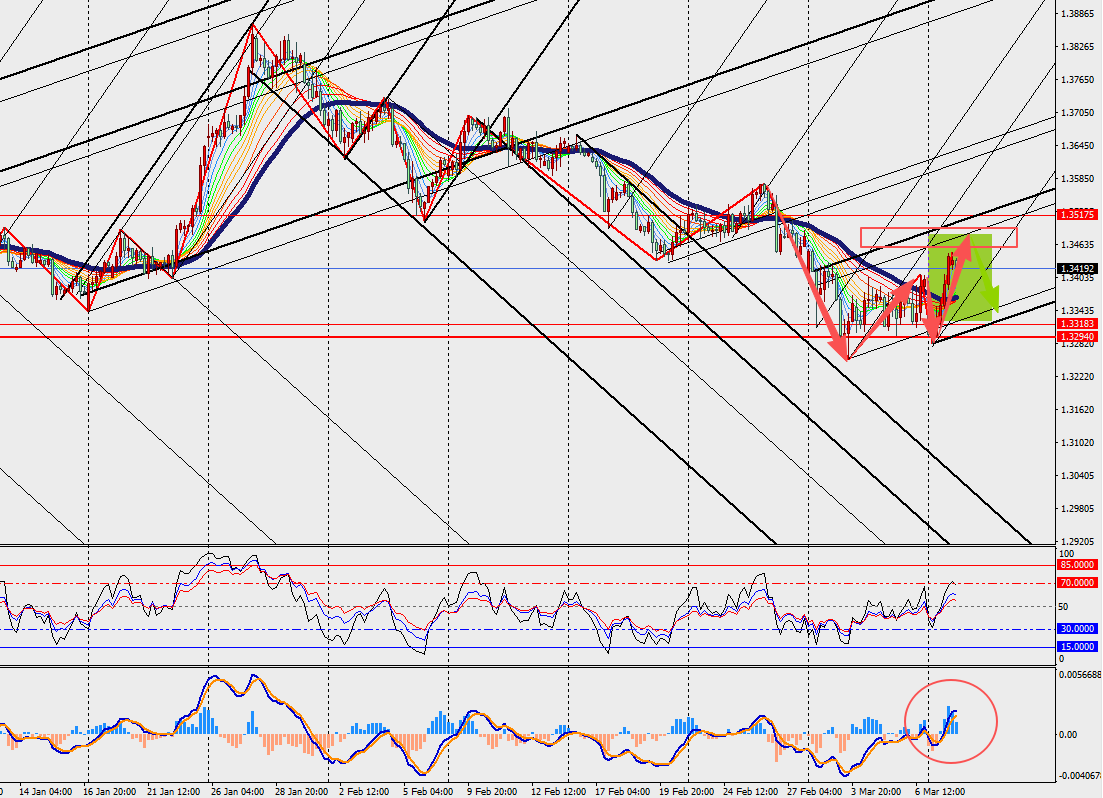
Today's Key Price Levels:
Key Support Levels: [1.3350]
Key Resistance Levels: [1.3500]
Pivot Points [1.3380]
2. Gold Analysis:
News Summary:
In the early stage of the oil price surge, gold came under pressure amid the ongoing decline. However, the subsequent pullback in oil prices provided some renewed support for gold. In particular, when oil prices fell by more than $25 from $118, concerns about disruptions to crude supply eased slightly, allowing both the equity market and gold prices to recover part of their losses. This suggests that although fluctuations in oil prices can directly influence gold prices, the market’s risk-off sentiment has not completely faded amid the continuing geopolitical tensions in the Middle East.
Trend Analysis:
On the H4 chart, we can see gold is showing a sideways rebound and trading near the 48 hours moving average. In addition, the MACD double line and energy bars are contracting around the zero axis. The buy limit could be used, stop loss is mandatory.
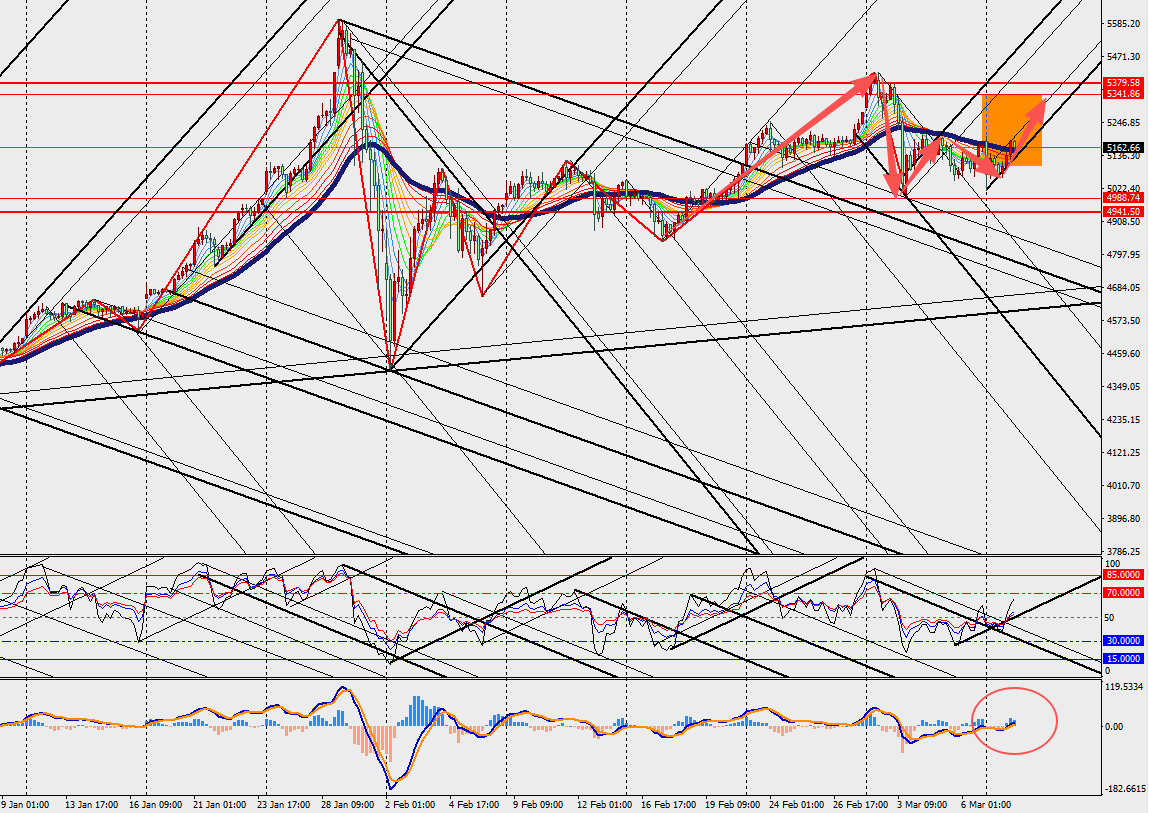
Today's Key Price Levels:
Key Support Levels: [5120]
Key Resistance Levels: [5200]
Pivot Points [5140]


Copyright © 2026 FastBull Ltd


Risk Warning
FX trading is of high risk and may not be suitable for all investors. Leverage will create additional risks and loss. Before trading, please carefully consider your investment objectives, experience level and risk tolerance. You may lose part or all of your initial investment; do not invest money that you cannot afford. Educate yourself about the risks associated with FX trading. If you have any questions, please consult an independent financial or tax advisor. Any data and information are provided "as is" and only for information purpose, not for trading or recommendations. Past performance does not predict future results.
Disclaimer
The data contained in this website may not be real-time and accurate. The data and prices on this site are not necessarily provided by the market or exchange, but may be provided by market makers, so prices may be inaccurate and differ from actual market prices. Namely, this price is indicative price only to reflect market trend, and is unfavorable for trading purpose. The provider of the data contained in the Website shall not be liable for any loss incurred by you as a result of your trading activities or reliance on the information contained in the Website.