


Daily Technical Analysis: [07 MAY]
1. AUD/USD Analysis:
News Summary:
Data released by the Australian Bureau of Statistics showed that Australian household spending rose 6.3% year-over-year and 1.6% month-over-month in March, marking the fastest pace of growth in two years. The surge was largely driven by sharply higher gasoline prices following the outbreak of the Iran conflict. Due to supply chain disruptions caused by tensions in the Middle East, fuel prices jumped significantly in early March and remained elevated throughout the month. In response to rising costs, drivers reduced the amount of fuel purchased per visit while increasing the frequency of refuelling.
Trend Analysis:
On the H4 chart, we can see AUD/USD has rebounded after a decline and is currently trading above the 48 hours moving average. In addition, the MACD double line and energy bars are expanding near the zero axis.
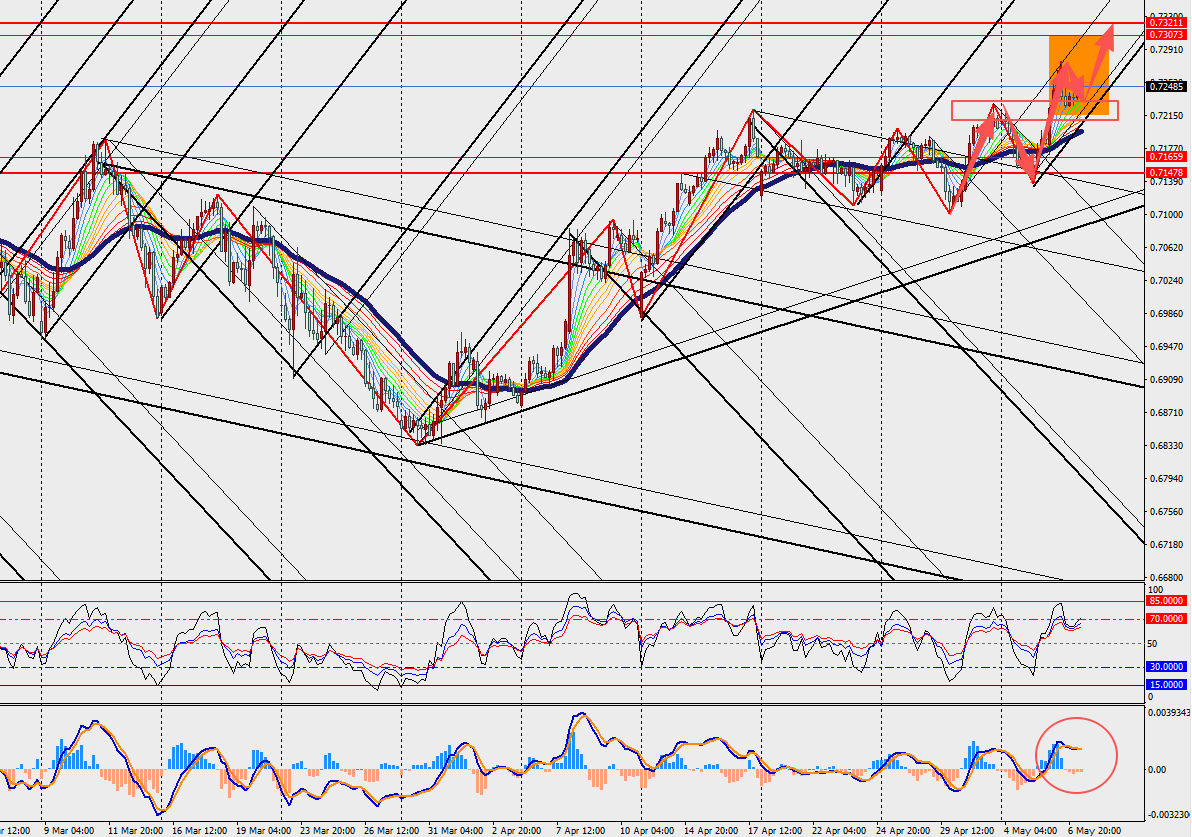
Today's Key Price Levels:
Key Support Levels: [0.7170]
Key Resistance Levels: [0.7320]
Pivot Points [0.7200]
2. Crude Oil Analysis:
News Summary:
An energy consulting firm stated that the recent weakness in oil prices appears to be more of a technical correction after a sharp rally over the past week, as short-term profit-taking pressure has started to emerge. At the same time, optimistic comments from the Trump administration suggesting that the ceasefire agreement with Iran remains in effect also triggered some selling in the market. However, crude oil prices are still hovering near the elevated $100-per-barrel level. The key support factor remains the ongoing closure of the Strait of Hormuz, which has persisted for nearly two months and disrupted approximately 20% of global oil supplies.
Trend Analysis:
We can see crude oil on the H4 chart is rebounding after entering oversold territory, but it continues to trade below the 48 hours moving average. Meanwhile, both the MACD double line and histogram bars are expanding below the zero axis.
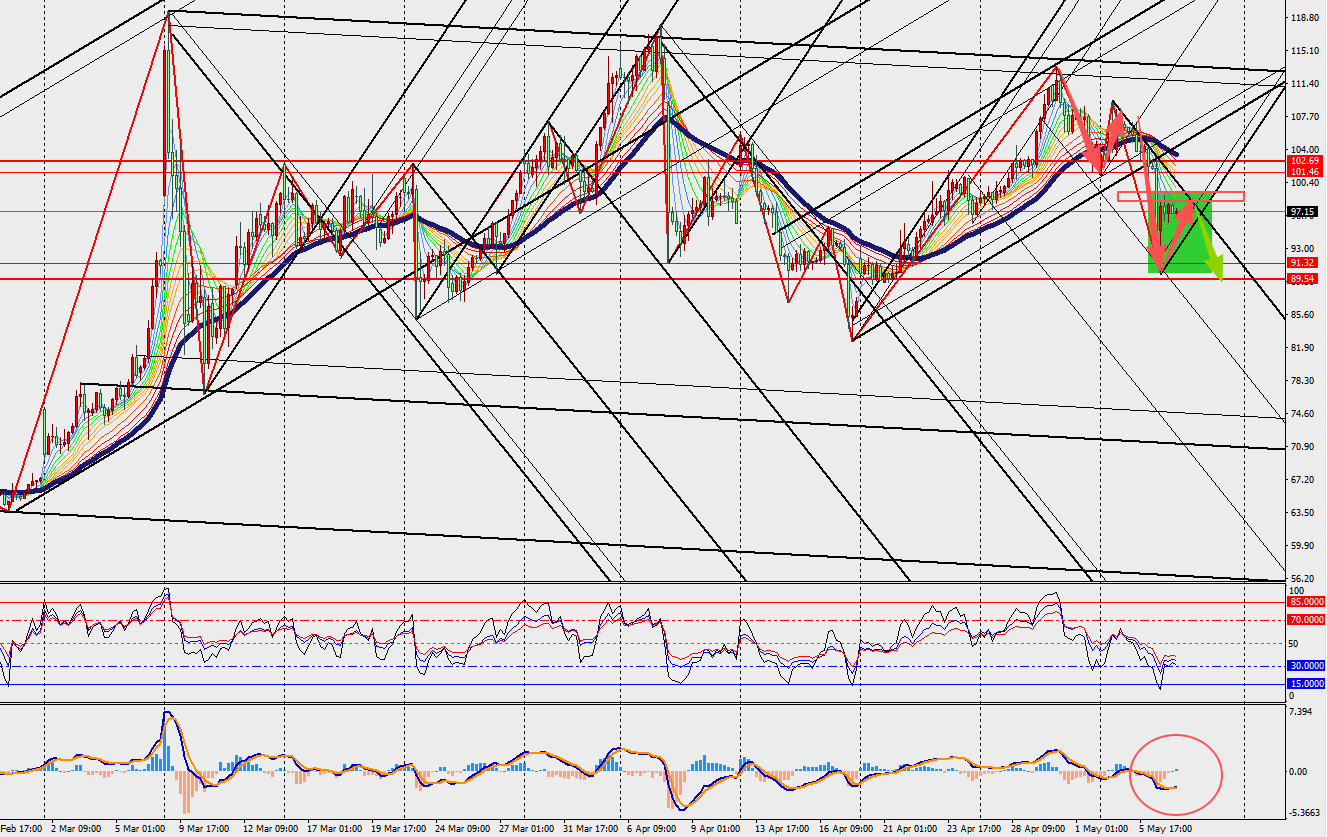
Today's Key Price Levels:
Key Support Levels: [90.00]
Key Resistance Levels: [102.00]
Pivot Points [100.00]


Copyright © 2026 FastBull Ltd


Risk Warning
FX trading is of high risk and may not be suitable for all investors. Leverage will create additional risks and loss. Before trading, please carefully consider your investment objectives, experience level and risk tolerance. You may lose part or all of your initial investment; do not invest money that you cannot afford. Educate yourself about the risks associated with FX trading. If you have any questions, please consult an independent financial or tax advisor. Any data and information are provided "as is" and only for information purpose, not for trading or recommendations. Past performance does not predict future results.
Disclaimer
The data contained in this website may not be real-time and accurate. The data and prices on this site are not necessarily provided by the market or exchange, but may be provided by market makers, so prices may be inaccurate and differ from actual market prices. Namely, this price is indicative price only to reflect market trend, and is unfavorable for trading purpose. The provider of the data contained in the Website shall not be liable for any loss incurred by you as a result of your trading activities or reliance on the information contained in the Website.