- โบรกเกอร์ HOT
- โบรกเกอร์โกง
- BV ประเมิน NEW
- อันดับ
- หน่วยงานควบคุม
- ข่าว
- การเรียกร้อง
- เอ็กซ์โป HOT
- กิจกรรม
- รางวัล


Daily Technical Analysis: [15 JUNE]
1. AUD/USD Analysis:
News Summary:
The Reserve Bank of Australia (RBA) is set to announce its interest rate decision on Tuesday, with market expectations for further rate hikes continuing to fade. Since February this year, the RBA has delivered three consecutive rate increases in an effort to contain inflationary pressures that had already been building before the outbreak of the Middle East conflict. However, tighter monetary policy is now beginning to weigh on the broader economy. Australia's first-quarter GDP growth slowed sharply to 0.3% from 0.9% in the previous quarter, while the unemployment rate climbed to 4.5% in April, the highest level since 2021.
Trend Analysis:
We can see AUD/USD has staged a strong rebound on the H4 chart and continues to trade above the 48 hours moving average. Meanwhile, both the MACD double line and histogram bars are gradually expanding around the zero axis. The buy limit could be set, stop loss is necessary.
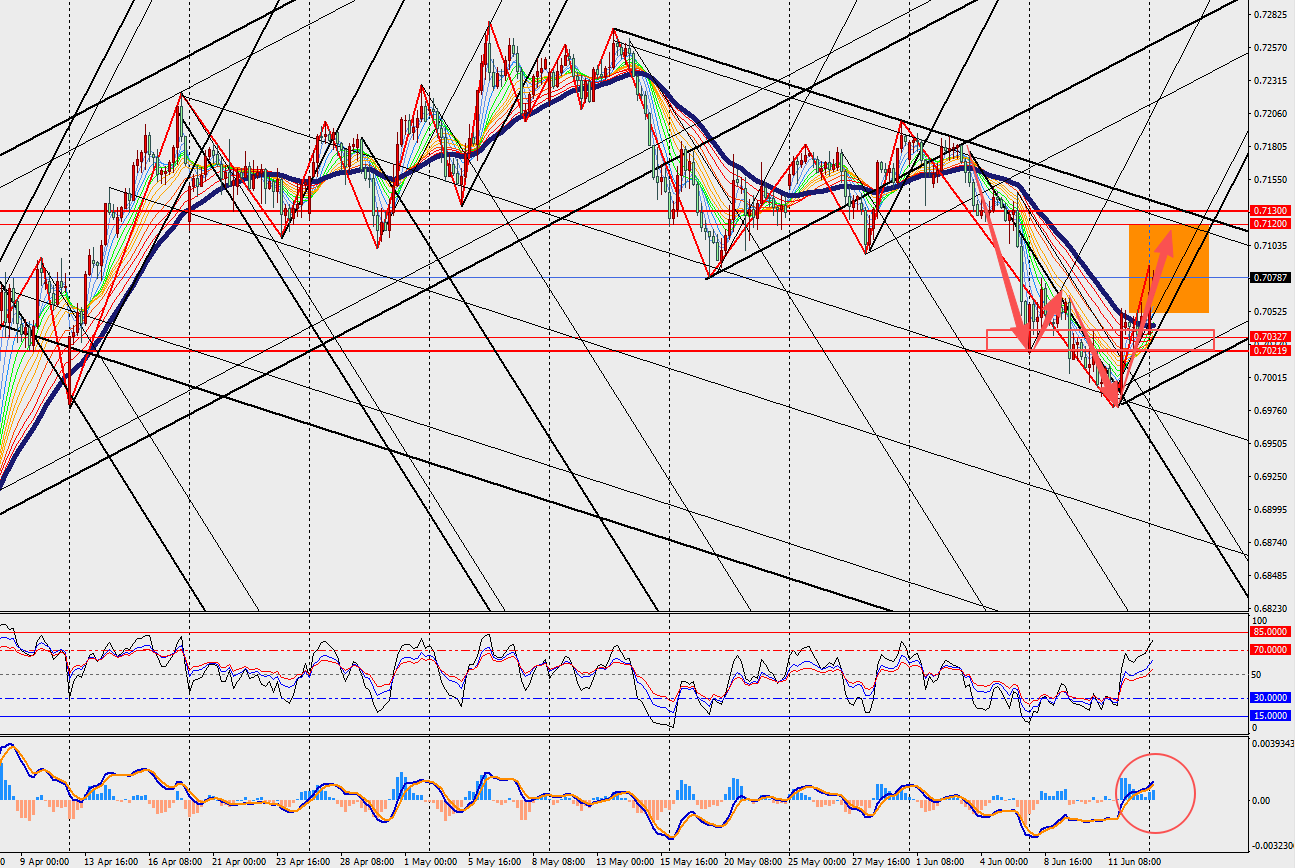
Today's Key Price Levels:
Key Support Levels: [0.7000]
Key Resistance Levels: [0.7140]
Pivot Points [0.7030]
2. Gold Analysis:
News Summary:
The United States and Iran have reached a historic peace agreement, paving the way for the reopening of the Strait of Hormuz. As concerns over disruptions to global energy supplies ease, international crude oil prices have fallen sharply. Lower oil prices have helped cool inflation expectations, reducing market concerns about further Federal Reserve rate hikes and putting downward pressure on the U.S. dollar index. Against this backdrop, spot gold surged on Monday, reaching its highest level in nearly a week. The peace agreement between the U.S. and Iran is reshaping market expectations through a clear transmission mechanism: lower oil prices ease inflation pressures, softer inflation reduces the likelihood of additional Fed tightening, and a weaker U.S. dollar enhances the appeal of non-yielding assets such as gold. This chain of developments is effectively removing one of the biggest headwinds that has weighed on gold prices in recent months.
Trend Analysis:
On the H4 chart, we can see gold has posted a strong rally and continues to trade above the 48 hours moving average. In addition, both the MACD double line and energy bars are expanding around the zero axis. The buy limit could be placed, stop loss is mandatory.
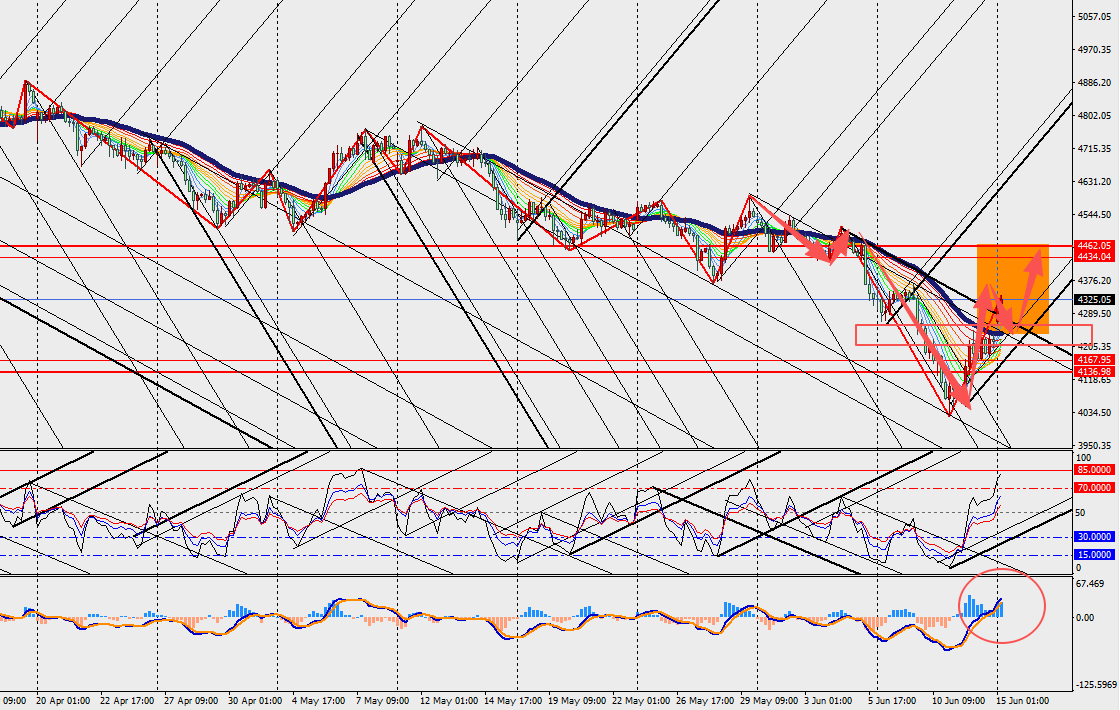
Today's Key Price Levels:
Key Support Levels: [4270]
Key Resistance Levels: [4400]
Pivot Points [4300]


ลิขสิทธิ์ © 2026 FastBull Ltd


คำเตือนความเสี่ยง
การเทรดฟอเร็กซ์มีความเสี่ยงสูงและอาจไม่เหมาะสำหรับนักลงทุนทั้งหมด เลเวอเรจอาจเป็นการเพิ่มความเสี่ยงและการสูญเสีย ก่อนตัดสินใจซื้อขาฟอเร็กซ์ โปรดพิจารณาวัตถุประสงค์การลงทุน ระดับประสบการณ์ และความเสี่ยงที่ยอมรับได้อย่างรอบคอบ คุณอาจสูญเสียเงินลงทุนเริ่มแรกบางส่วนหรือทั้งหมด อย่าลงทุนด้วยเงินที่คุณไม่พร้อมเสีย ทำความเข้าใจความรู้เกี่ยวกับความเสี่ยงที่เกี่ยวข้องกับการเทรดฟอเร็กซ์ หากคุณมีคำถามเพิ่มเติม โปรดขอคำแนะนำกับที่ปรึกษาทางการเงินหรือที่ปรึกษาภาษี การบริการข้อมูลต่างๆ "ตามสภาพจริง"มีวัตถุประสงค์ในการให้ข้อมูล มิใช่เพื่อการเทรดหรือให้คำแนะนำผลงานในอดีตไม่สามารถทำนายผลในอนาคตได้
ข้อจำกัดความรับผิดชอบ
ข้อมูลที่อยู่ในเว็บไซต์นี้อาจไม่ถูกต้องแบบเรียลไทม์ ข้อมูลและราคาในเว็บไซต์นี้ไม่ได้มาจากตลาดหรือการแลกเปลี่ยน อาจมาจากผู้ดูแลสภาพคล่อง ดังนั้น ราคาอาจไม่ถูกต้องและแตกต่างจากตลาดจริงกล่าวคือราคาเป็นเพียงเครื่องบ่งชี้ซึ่งสะท้อนถึงแนวโน้มของลาด และไม่ควรใช้เพื่อการค้าผู้ให้บริการ โบรกเกอร์ที่ให้ข้อมูลในเว็บไซต์นี้จะไม่รับผิดชอบต่อความสูญเสียใด ๆ ที่คุณอาจได้รับอันเป็นผลมาจากแนวทางการเทรดที่ไม่เหมาะสมหรือการพึ่งพาข้อมูลที่มีอยู่ในเว็บไซต์นี้