• 거래
  • 견적
  • 복사
  • 대회
  • 7x24
  • 달력
  • Q&A
  • 채팅
필터
자산
마지막
입찰
호가
높은
낮은
자산
자산
스프레드
출처
SPX
S&P 500 Index
7544.67
7544.67
7544.67
7556.26
7422.24
+167.81
+ 2.27%
--
--
DJI
Dow Jones Industrial Average
52366.82
52366.82
52366.82
52439.93
51643.01
+1081.09
+ 2.11%
--
--
IXIC
NASDAQ Composite Index
25306.52
25306.52
25306.52
25339.58
24762.57
+727.11
+ 2.96%
--
--
USDX
US Dollar Index
101.518
101.518
101.598
102.133
101.483
-0.560
-0.55%
--
--
EURUSD
Euro / US Dollar
1.12198
1.12198
1.12207
1.12236
1.11348
+0.00822
+ 0.74%
--
--
GBPUSD
Pound Sterling / US Dollar
1.34374
1.34374
1.34386
1.34418
1.33458
+0.00884
+ 0.66%
--
--
XAUUSD
Gold / US Dollar
4131.23
4131.23
4131.64
4139.16
4054.18
+59.72
+ 1.47%
--
--
WTI
Light Sweet Crude Oil
84.878
84.878
84.908
90.437
84.222
-4.596
-5.14%
--
--

NULL_CELL

NULL_CELL
--
NULL_CELL
--
NULL_CELL
--
더보기

신호 제공자가 되어 보세요

거래 신호를 판매하여 추가 수입을 얻으세요

더보기

NULL_CELL

NULL_CELL

더보기

NULL_CELL

NULL_CELL

NULL_CELL
  • NULL_CELL
  • NULL_CELL
  • NULL_CELL
NULL_CELL
  • NULL_CELL
  • NULL_CELL
  • NULL_CELL

모든 대회

  • 모두
  • 추천하다
  • 주식
  • 암호화폐
  • 중앙은행
  • 트럼프 업데이트
  • 주요 뉴스
주요 뉴스만 보기
공유

나스닥 지수는 한때 3%를 넘어섰지만, 서부 텍사스산 원유(WTI)와 브렌트유는 모두 1.50달러 하락했고, 브렌트유는 하락폭이 7%까지 확대되었습니다. 뉴스 측면에서는 아라비야 TV가 아랍 소식통을 인용해 미국이 이란의 우라늄 농축을 3.67%까지 허용했고, 테헤란이 이에 동의했다고 보도했습니다.

공유

알 아라비야 TV에 따르면, 아랍 소식통들은 제안된 틀 안에서 호르무즈 해협이 즉시 개방되고 해상 봉쇄가 해제될 것이라고 전했다.

공유

알 아라비야 TV에 따르면, 아랍 소식통들은 합의가 이루어지면 미국이 이란의 60억 달러에서 90억 달러 상당의 자산 동결을 해제할 것이라고 전했다.

공유

알 아라비야 TV에 따르면, 아랍 소식통들은 이란의 우라늄 농축 수준 감축에 대한 예비 합의가 이루어질 것으로 예상된다고 전했습니다. 미국은 이란의 60% 농축 우라늄 비축량 감축을 요구해왔습니다.

공유

브렌트유는 배럴당 91달러 아래로 떨어지며 하루 만에 7.51% 하락했다.

공유

뉴욕 은 선물 가격은 이날 3% 상승하여 현재 온스당 53.53달러에 거래되고 있습니다.

공유

중동 언론이 미국과 이란 간 핵 협상 진전 소식을 보도하면서 나스닥 지수가 3% 상승했고, 금과 은 현물 가격이 급등했으며, 유가는 급락했다.

공유

알 아라비야 TV에 따르면, 아랍 소식통들은 이란이 고농축 우라늄의 농축도를 낮추기 위해 제3국의 도움을 받는 방안을 모색하고 있다고 전했다.

공유

알 아라비야 TV에 따르면, 아랍 소식통들은 미국이 이란의 우라늄 농축률을 3.67%까지 허용했고, 테헤란이 이에 동의했다고 전했다.

공유

WTI와 브렌트유 가격 모두 단기적으로 1.50달러씩 하락했으며, 브렌트유의 하락폭은 6.7%로 확대되었습니다.

공유

아라비야 TV에 따르면, 아랍 소식통들은 카타르와 파키스탄의 제안으로 미국과 테헤란 간의 본격적인 협상이 재개되었다고 전했습니다. 국제원자력기구(IAEA) 사찰단의 이란 복귀에 대한 논의가 진행 중이지만, 사찰단의 임무 범위는 구체적으로 정해지지 않았습니다.

공유

서부 텍사스산 원유(WTI)는 이날 6% 하락하여 현재 배럴당 85.37달러에 거래되고 있습니다.

공유

브렌트유는 배럴당 92달러 아래로 떨어지며 하루 만에 7.07% 하락했다.

공유

마르코 루비오 미국 국무장관: 유엔 사무총장직을 수행할 자격을 갖춘 후보가 두세 명 있다고 봅니다.

공유

루비오 미국 국무장관: 이스라엘은 더 이상 미국의 군사 지원이 필요하지 않다.

공유

마르코 루비오 미국 국무장관: 이스라엘에 대한 미국의 군사 지원에 관한 양해각서 체결을 위한 협상이 진행 중입니다.

공유

루비오 미국 국무장관은 허그스 미국 국방장관에 대한 탄핵은 부당했으며, 그는 훌륭하게 직무를 수행했다고 말했습니다.

공유

루비오 미국 국무장관: 베네수엘라는 대선 전에 미국에 영사관을 개설해야 한다.

공유

마르코 루비오 미국 국무장관은 브라질 정부에 미국 대사의 입국을 허용할 것을 촉구했다.

공유

루비오 미국 국무장관: 우리는 인공지능이 경제에 미치는 영향에 대해 더 많이 논의해야 합니다.

시각
ACT
FCST
이전
임팩트
미국 주간 총 드릴링

움:--

F: --

이: --

WTI
  • WTI
  • XAUUSD
  • XAGUSD
  • USDX
미국 주간 총 석유 시추

움:--

F: --

이: --

WTI
  • WTI
  • XAUUSD
  • XAGUSD
  • USDX
미국 소비자신용(SA) (9월)

움:--

F: --

이: --
USDX
  • USDX
  • XAUUSD
  • XAGUSD
  • WTI
중국 (본토 통화 준비금 (10월)

움:--

F: --

이: --

XAUUSD
  • XAUUSD
  • XAGUSD
  • WTI
  • USDX
중국 (본토 사회적 금융 규모 (10월)

--

F: --

이: --

중국 (본토 M2 통화 공급량(YoY) (10월)

--

F: --

이: --

중국 (본토 M0 화폐 공급량(YoY) (10월)

--

F: --

이: --

중국 (본토 M1 통화공급량(YoY) (10월)

--

F: --

이: --

트럼프 미국 대통령이 연설을 했다.
일본 통화 준비금 (10월)

움:--

F: --

이: --

USDJPY
  • USDJPY
  • XAUUSD
  • XAGUSD
  • WTI
중국 (본토 소비자물가지수(MoM) (10월)

움:--

F: --

이: --

XAUUSD
  • XAUUSD
  • XAGUSD
  • WTI
  • USDX
중국 (본토 PPI(전년 대비) (10월)

움:--

F: --

이: --

XAUUSD
  • XAUUSD
  • XAGUSD
  • WTI
  • USDX
중국 (본토 소비자물가지수(YoY) (10월)

움:--

F: --

이: --

XAUUSD
  • XAUUSD
  • XAGUSD
  • WTI
  • USDX
일본 주요 지표 예비 (9월)

움:--

F: --

이: --

USDJPY
  • USDJPY
  • XAUUSD
  • XAGUSD
  • WTI
  • USDX
독일 수출 MoM(SA) (9월)

움:--

F: --

이: --
EURUSD
  • EURUSD
  • XAUUSD
  • XAGUSD
  • WTI
  • USDX
유로존 Sentix 투자자 신뢰 지수 (11월)

움:--

F: --

이: --

EURUSD
  • EURUSD
  • XAUUSD
  • XAGUSD
  • WTI
  • USDX
멕시코 소비자물가지수(YoY) (10월)

움:--

F: --

이: --

XAUUSD
  • XAUUSD
  • XAGUSD
  • WTI
  • USDX
캐나다 국민경제신뢰지수

움:--

F: --

이: --

USDCAD
  • USDCAD
  • XAUUSD
  • XAGUSD
  • WTI
  • USDX
미국 협의회 고용 동향 지수(SA) (10월)

움:--

F: --

이: --
USDX
  • USDX
  • XAUUSD
  • XAGUSD
  • WTI
미국 도매판매액(MoM)(SA) (9월)

움:--

F: --

이: --
USDX
  • USDX
  • XAUUSD
  • XAGUSD
  • WTI
중국 (본토 수입(CNH) (10월)

--

F: --

이: --

중국 (본토 수출 (10월)

--

F: --

이: --

중국 (본토 무역수지(CNH) (10월)

--

F: --

이: --

중국 (본토 전년 대비 수입(CNH) (10월)

--

F: --

이: --

중국 (본토 전년 대비 수출(USD) (10월)

--

F: --

이: --

중국 (본토 전년 대비 수입(USD) (10월)

--

F: --

이: --

중국 (본토 무역수지(USD) (10월)

--

F: --

이: --

사우디 아라비아 원유 생산

움:--

F: --

이: --

WTI
  • WTI
  • XAUUSD
  • XAGUSD
  • USDX
리치먼드 연방준비은행 총재인 바킨이 연설을 했습니다.
Bailey BOE 주지사가 연설합니다
미국 3년만기 국채 경매 수익률

움:--

F: --

이: --

XAUUSD
  • XAUUSD
  • XAGUSD
  • WTI
  • USDX
일본 무역수지 (9월)

--

F: --

이: --

영국 BRC 유사 소매 판매(YoY) (10월)

--

F: --

이: --

영국 BRC 전체 소매판매(YoY) (10월)

--

F: --

이: --

인도네시아 소매판매(YoY) (9월)

--

F: --

이: --

일본 30년 JGB 경매 수익률

--

F: --

이: --

프랑스 ILO 실업률(SA) (제3분기)

--

F: --

이: --

남아프리카 실업률 (제3분기)

--

F: --

이: --

FOMC 위원 월러가 연설하고 있다
미국 NFIB 중소기업 낙관 지수(SA) (10월)

--

F: --

이: --

미국 실질소득(MoM) (SA) (10월)

--

F: --

이: --

미국 핵심 CPI 전월 대비(SA) (10월)

--

F: --

이: --

미국 CPI 전월(SA) (10월)

--

F: --

이: --

미국 핵심 CPI(SA) (10월)

--

F: --

이: --

미국 CPI 전월(SA 아님) (10월)

--

F: --

이: --

미국 주간 레드북 상업용 소매 매출(YoY)

--

F: --

이: --

미국 클리블랜드 연은 CPI(MoM) (10월)

--

F: --

이: --

ECB 수석 이코노미스트 레인이 연설합니다.
미국 EIA 올해 단기 원유생산 전망 (11월)

--

F: --

이: --

미국 내년 EIA 천연가스 생산량 예측 (11월)

--

F: --

이: --

미국 EIA 내년 단기 조생산 전망 (11월)

--

F: --

이: --

EIA 단기 월별 에너지 전망
미국 10년만기 국채 경매 평균 생산하다

--

F: --

이: --

미국 API 주간 정유 재고

--

F: --

이: --

미국 API 주간 쿠싱 원유 재고량

--

F: --

이: --

미국 API 주간 휘발유 재고

--

F: --

이: --

미국 API 주간 원유 재고량

--

F: --

이: --

일본 로이터 단칸 제조업체 지수 (11월)

--

F: --

이: --

일본 로이터 단칸 비제조업체 지수 (11월)

--

F: --

이: --

대한민국 실업률(SA) (10월)

--

F: --

이: --

필라델피아 연방준비은행 총재 헨리 폴슨이 연설을 하고 있다.
전문가 Q&A
    • 모두
    • 대화방
    • 여러 떼
    • 친구
    Sanjeev Ku flag
    Shadow flag
    Size
    @041378WLJDInteresting buy, mate. What's your entry level?
    @SizeNice entry, mate. What’s your stop-loss, and are you holding it for the TP at 4131.830?
    "Oscar"님이 메시지를 회수했습니다
    Oscar flag
    who is seeing buy in Gold???
    Skylark flag
    Areeba Mini❣️❣️
    @SkylarkAll trades are going well. all are on hold
    @Areeba Mini❣️❣️okay that's good friend, wish you all the best
    Skylark flag
    Osaghae Cephas
    @SkylarkI think there is an error with ur chat or fastbull😂 how come am getting tagged for something I didn't say🤷🤦
    @Osaghae Cephasoh another time. sorry about that mate. Will be more careful next time
    Skylark flag
    Galileo
    looks like gold bulls are getting another opportunity. We're now trading around 4,127, up more than 1% today.
    @Galileookay Gold is already bullish so it's just a continuation of the trend. Don't you think so
    Skylark flag
    041378WLJD
    Buy gold TP:4131.830
    @041378WLJDhello visitor. How are you doing today. How is your Gold position going?
    EuroTrader flag
    Oscar
    who is seeing buy in Gold???
    @Oscarconflicting signals on gold at the moment..I don't see a buy hitting the markets any time soon
    Skylark flag
    Galileo
    @johnDXY has dropped from approximately 102.36 to 101.83. That's a meaningful reversal after the employment report
     @Galileo I think that's some of the reasons that Gold is bullish at the moment. Don't you think so.
    EuroTrader flag
    Oscar
    who is seeing buy in Gold???
    @Oscardid you take any trades yet on the shiny metal or you still observing the markets
    Osaghae Cephas flag
    Skylark
    @Osaghae Cephasoh another time. sorry about that mate. Will be more careful next time
    @Skylarkcool
    Osaghae Cephas flag
    EuroTrader
    @Oscardid you take any trades yet on the shiny metal or you still observing the markets
    @EuroTraderbro
    Skylark flag
    Oscar
    who is seeing buy in Gold???
    @Oscarmate let me check it out and see if there is opportunities on long
    Osaghae Cephas flag
    EuroTrader
    @Oscardid you take any trades yet on the shiny metal or you still observing the markets
    @EuroTraderur gold trade u didn't later update me if u closed in profits or entered another position?@EuroTrader
    Skylark flag
    Skylark flag
    Skylark
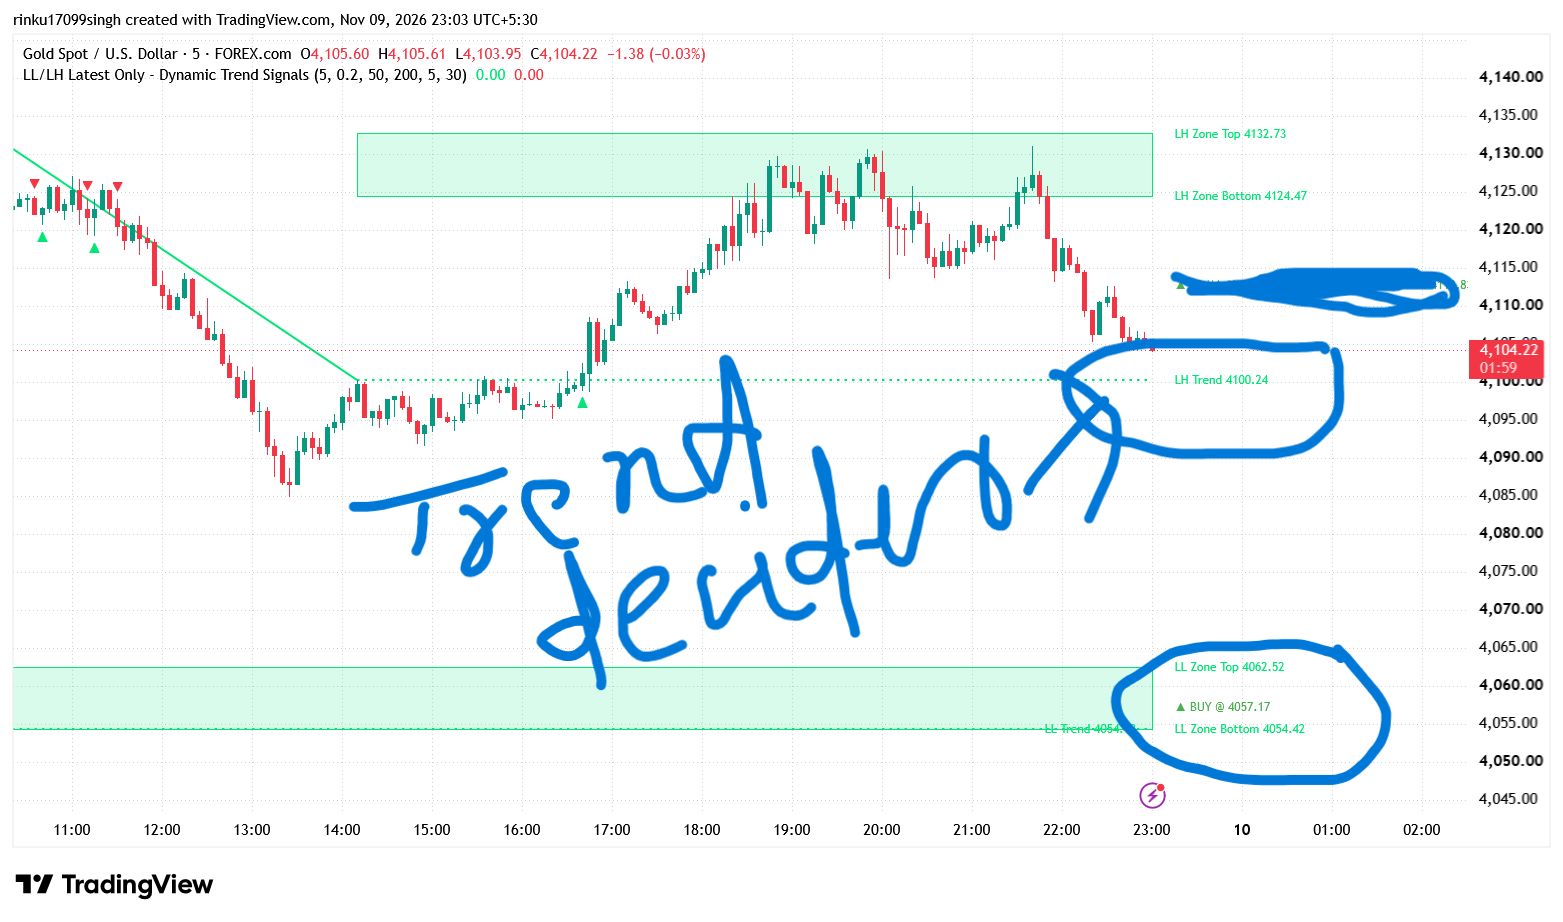
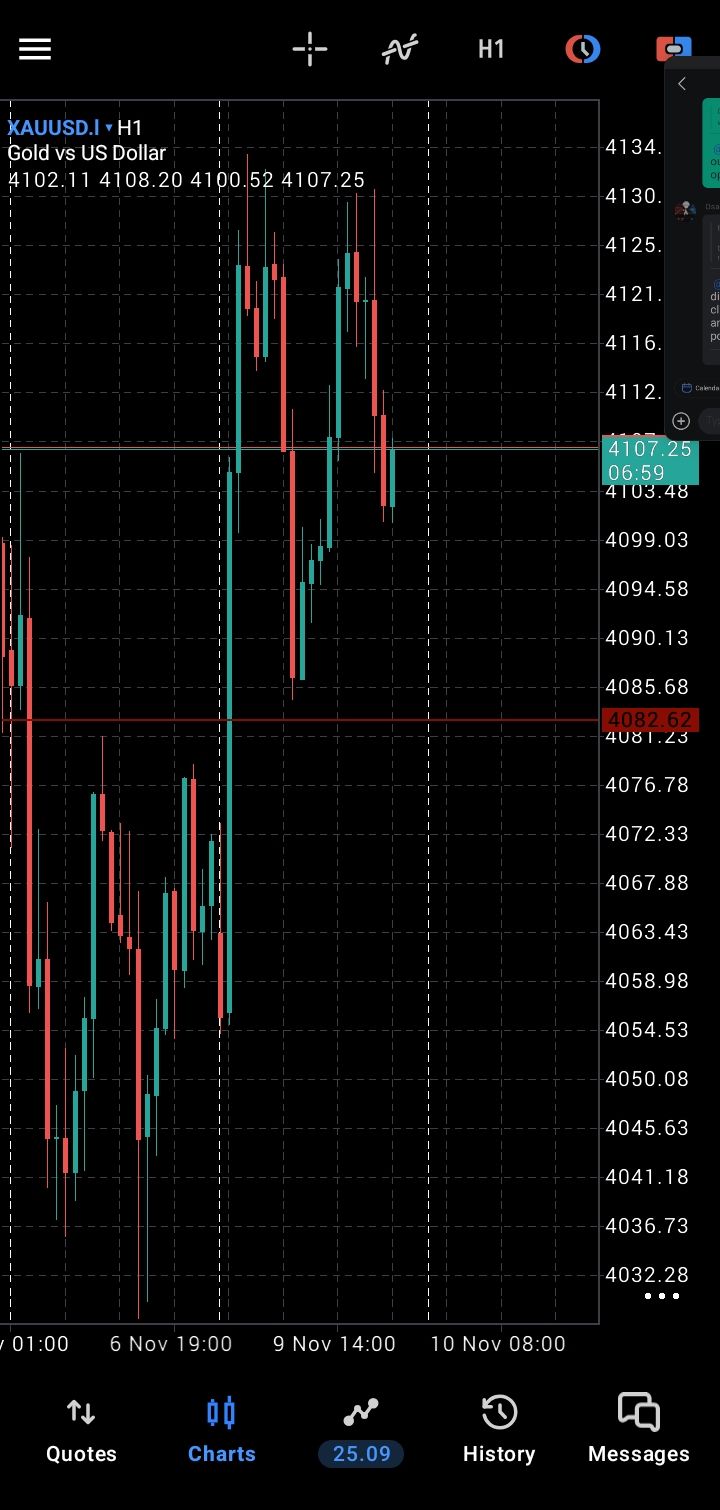
    @OscarThis the chart on gold bro.i don't think there is a setup here at the moment
    Skylark flag
    @OscarThough u should check it out and see for yourself
    pinescript flag
    mengapa selalu emas hahaha
    pinescript flag
    EuroTrader
    @Oscardid you take any trades yet on the shiny metal or you still observing the markets
    @EuroTraderhalo paman apa yang sedang kamu perdagangkan ?
    여기에 입력하세요...
    자산 이름 또는 코드 추가

      일치하는 데이터가 없습니다

      모두
      추천하다
      주식
      암호화폐
      중앙은행
      트럼프 업데이트
      주요 뉴스
      • 모두
      • 러시아-우크라이나 분쟁
      • 중동의 긴장 지점
      • 모두
      • 러시아-우크라이나 분쟁
      • 중동의 긴장 지점
      검색
      제품

      차트 NULL_CELL

      채팅 전문가 Q&A
      필터 경제 일정 데이터 Outils
      패스트불 프로 특징
      데이터 센터 시장 트렌드 기관 데이터 정책금리 거시경제

      시장 트렌드

      투기심리 주문 장부 상관관계

      상위 지표

      차트 NULL_CELL
      시장

      뉴스

      7x24 분석 교육

      최신 의견

      최근 업데이트

      전략

      복사 순위 AI 전략 신호 제공자가 되어 보세요 AI 평가
      대회
      Brokers

      개요 딜러 평가 순위 규제 기관 소식 청구
      브로커 목록 외환 브로커 비교 도구 실시간 스프레드 비교 사기
      Q&A 불만 사기 경고 비디오 사기 탐지 팁
      더

      사업
      활동
      신병 모집 회사 소개 NULL_CELL 지원 센터

      화이트 라벨

      Broker API

      데이터API

      웹 플러그인

      제휴 프로그램

      수상 내역 기관 평가 IB Seminar 살롱 이벤트 전시회
      베트남 태국 싱가포르 두바이
      팬 미팅 투자 공유 세션
      FastBull 서밋 BrokersView 엑스포
      최근 검색
        인기 검색어
          견적
          분석
          사용자
          7x24
          경제 일정
          교육
          데이터
          • 이름
          • 최신 값
          • 이전

          모두 보기

          데이터가 없음

          스캔하여 다운로드

          Faster Charts, Chat Faster!

          다운로드
          • English
          • Español
          • العربية
          • Bahasa Indonesia
          • Bahasa Melayu
          • Tiếng Việt
          • ภาษาไทย
          • Français
          • Italiano
          • Türkçe
          • Русский язык
          • 简中
          • 繁中
          계좌 개설
          검색
          제품
          차트 NULL_CELL
          시장
          뉴스
          전략

          복사 순위 AI 전략 신호 제공자가 되어 보세요 AI 평가
          대회
          Brokers

          개요 딜러 평가 순위 규제 기관 소식 청구
          브로커 목록 외환 브로커 비교 도구 실시간 스프레드 비교 사기
          Q&A 불만 사기 경고 비디오 사기 탐지 팁
          더

          사업
          활동
          신병 모집 회사 소개 NULL_CELL 지원 센터

          화이트 라벨

          Broker API

          데이터API

          웹 플러그인

          제휴 프로그램

          수상 내역 기관 평가 IB Seminar 살롱 이벤트 전시회
          베트남 태국 싱가포르 두바이
          팬 미팅 투자 공유 세션
          FastBull 서밋 BrokersView 엑스포

          XRP, 주요 지지선 약화로 하락 가능성 직면

          잔 첸
          요약:

          XRP는 기술적 약세로 주요 지지선이 위협받으면서 하락 가능성에 직면해 있습니다. 하락 신호, 주요 가격대, 그리고 전망을 반전시킬 수 있는 요인들을 살펴보겠습니다.

          XRP는 모멘텀 약화와 불안정한 기술적 구조로 인해 주요 지지선이 위협받으면서 다시 하락 압력에 직면하고 있습니다. 트레이더들은 매수세가 최근의 지지선을 방어할 수 있을지, 아니면 지속적인 매도세가 더 큰 조정으로 이어질지 주시하고 있습니다.
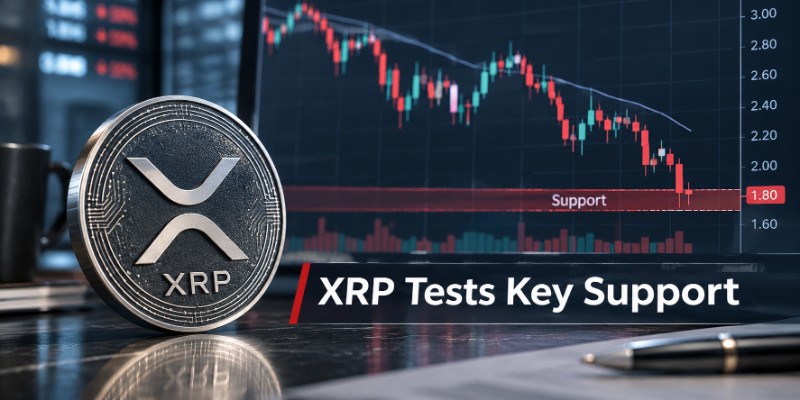
          XRP, 주요 지지선 약화로 하락 가능성 직면_1

          목차

          • XRP 가격 약세, 주요 지지선에 대한 우려 제기
          • XRP 회복세에 걸림돌이 되는 약세 기술 지표
          • XRP가 1.18달러 지지선을 유지할 수 있을까요?
          • 경기 회복 실패는 하방 위험을 증가시킬 수 있다
          • XRP 하락 전망을 무효화할 수 있는 요인은 무엇일까요?
          • 전반적인 암호화폐 시장 상황이 XRP에 영향을 미칠 수 있습니다.
          • XRP의 다음 움직임을 앞두고 트레이더들이 주목해야 할 점은 무엇일까요?
          • XRP 가격 전망: 추가 하락 가능성 있음

          XRP 가격 약세, 주요 지지선에 대한 우려 제기

          최근 XRP 가격 움직임은 단기 전망에 대한 우려를 증폭시키고 있습니다. 지속적인 회복세를 보이기는커녕, XRP는 상승 모멘텀을 되찾는 데 어려움을 겪으며 추가적인 매도 압력에 취약한 상태입니다. 이러한 약세는 XRP가 과거 매수자들이 시장 방어를 시도했던 수준에 근접하고 있다는 점에서 중요합니다.

          COINOTAG의 2026년 11월 6일 일일 기술적 분석에서는 1.1826달러를 기준 가격으로 사용하여 즉각적인 지지선은 1.1766달러, 저항선은 1.2226달러로 파악했습니다. 분석 결과, 가격이 모니터링 대상인 8개의 이동평균선 모두 아래에 위치하여 강한 하락 추세가 나타났습니다. 이러한 수치는 특정 일일 가격 변동을 나타내는 것이며, 영구적인 가격 수준을 의미하는 것은 아닙니다.

          이번 하락세는 일시적인 장중 조정 이상의 의미를 지닙니다. XRP는 상승세를 유지하는 데 어려움을 겪고 있으며, 기술적 지표는 단기적으로 매도세가 우위를 점하고 있음을 시사합니다. 자산 가격이 하락 후 반복적으로 회복하지 못할 경우, 시장 참여자들은 특히 전반적인 시장 심리가 불확실한 상황에서 일시적인 반등에 대한 매수 의지가 약해질 수 있습니다.

          이동평균은 트레이더들이 단기적인 변동과 장기적인 추세를 구분하는 데 도움을 줍니다. 자산 가격이 여러 주요 이동평균선 아래에서 거래될 경우, 해당 이동평균선들은 반등 시도 시 저항선 역할을 할 수 있습니다. XRP가 모니터링되는 이동평균선 아래에 위치해 있다는 것은 매수자들이 확실한 추세 반전을 이루기 위해서는 단기적인 반등 이상의 움직임이 필요할 수 있음을 시사합니다.

          하지만 기술적 약세가 추가 하락을 의미하는 것은 아닙니다. 인근 지지선 부근에서 수요가 반등하여 시장 안정에 도움이 될 수 있습니다. 중요한 것은 매수세가 이러한 안정세를 지속적인 회복세로 전환시킬 수 있느냐는 것입니다.

          XRP 회복세에 걸림돌이 되는 약세 기술 지표

          XRP에 대한 신중한 전망에는 여러 기술적 지표가 영향을 미치고 있습니다. 특히 상대강도지수(RSI), 이동평균, 그리고 이동평균수렴발산(MACD)과 같은 모멘텀 지표들이 주목받고 있습니다.

          The RSI measures the speed and magnitude of recent price movements. It generally ranges from zero to 100, with readings below 30 commonly interpreted as oversold and readings above 70 as overbought. COINOTAG's November 6 assessment placed XRP's daily RSI at approximately 33.3, while its four-hour RSI stood near 28.0. The shorter timeframe therefore showed more pronounced selling pressure.

          A four-hour RSI below 30 can attract buyers looking for a technical rebound. Nevertheless, an oversold reading does not prove that a decline has ended. During a persistent downtrend, an asset can remain oversold as sellers continue to dominate trading activity.

          The MACD offers another way to evaluate whether bearish momentum is strengthening or weakening. When the MACD line remains below its signal line and both sit in negative territory, traders generally interpret the configuration as evidence of downward momentum. The November 6 daily snapshot showed a negative MACD reading and a negative histogram, consistent with a bearish momentum signal.

          The broader concern is that any potential rebound has not yet been supported by convincing evidence of a trend reversal. Even if selling pressure begins to ease, buyers will need to push the price higher and maintain those gains to change the technical picture. Moving averages add another challenge: XRP needs to recover important short-term averages before traders can confidently argue that its downward structure is improving.

          Can XRP Hold the $1.18 Support Level?

          The $1.18 area has become an important near-term reference point for XRP traders. It sits close to the technical support identified at $1.1766, making this zone worth monitoring as the market attempts to stabilize.

          A successful defense could give buyers an opportunity to slow the decline and establish a short-term trading range. However, repeated tests of the same support can weaken confidence in its ability to hold, particularly when buying interest remains limited.

          The next technical support levels in the November 6 snapshot were around $1.1382 and $1.0497. These are potential areas to monitor if selling pressure intensifies, not guaranteed price targets. Their relevance may change as new daily candles form and market conditions evolve.

          The distinction between an intraday move below support and a confirmed breakdown is important. A temporary dip may reflect short-term volatility or stop-loss activity. A sustained daily close below $1.1766 would provide stronger evidence that sellers have gained additional control.

          Traders may therefore focus on daily closing prices, trading volume and the market's response to recovery attempts. A breakdown accompanied by expanding selling volume would generally carry more bearish significance than a brief move below support followed by a rapid recovery.

          A Failed Recovery Could Increase Downside Risks

          If XRP cannot defend the $1.18 region, attention may shift toward lower support areas. Such a move would reinforce the existing bearish structure and potentially encourage additional selling from short-term traders.

          The first challenge for buyers would be to prevent the market from establishing a sustained position below nearby support. If that effort fails, the next technical areas around $1.14 and $1.05 could become increasingly relevant.

          A breakdown could also affect market psychology. Traders who previously viewed the decline as a temporary correction may reconsider their positions if XRP continues making lower lows. This could increase selling pressure, especially among participants using leverage or following short-term technical signals.

          Nevertheless, a bearish scenario would become less convincing if XRP quickly recovered the broken support area. Such a move could indicate that the breakdown was a temporary liquidity event rather than the beginning of another extended downward movement. Confirmation matters more than a single price print.

          What Could Invalidate the Bearish XRP Outlook?

          Despite the negative short-term structure, XRP's downside outlook is not irreversible. A meaningful recovery would require buyers to demonstrate that selling pressure is fading and that demand can support higher prices.

          The first positive signal would be a sustained move above immediate resistance near $1.2226. A daily close above this level could indicate that buyers are beginning to regain control. The next areas to watch would be $1.2546 and $1.291, where additional technical resistance could limit a recovery.

          A stronger bullish signal would emerge if XRP reclaimed these levels with increasing trading volume. Rising prices accompanied by stronger participation would provide better evidence of genuine demand than a low-volume rebound.

          There is also an important distinction between short-term and longer-term indicators. COINOTAG's November 6 analysis showed a strong bearish bias on both four-hour and daily charts, while the weekly outlook retained a bullish bias, with weekly RSI near 42.5. This divergence suggests that near-term weakness does not necessarily invalidate the broader recovery structure.

          However, the weekly outlook would need confirmation from improving price action. Without that confirmation, short-term bearish momentum could continue to dominate trading decisions.

          Broader Cryptocurrency Market Conditions Could Influence XRP

          XRP does not trade independently of the wider cryptocurrency market. Bitcoin's direction, overall risk appetite and liquidity conditions can influence demand for major altcoins.

          When Bitcoin experiences significant selling pressure, investors may reduce exposure to other cryptocurrencies, including XRP. This can make it more difficult for XRP to recover even when its own technical indicators begin showing signs of stabilization.

          The broader market environment also matters because institutional and retail investors often adjust cryptocurrency exposure according to macroeconomic expectations. Changes in interest-rate expectations, inflation concerns and geopolitical uncertainty can affect demand for risk-sensitive assets.

          Derivatives activity is another factor. High leverage can amplify price movements when markets approach important technical levels. If XRP falls below support while leveraged traders are heavily positioned, forced liquidations could add to selling pressure.

          Conversely, declining open interest combined with stabilizing prices could indicate that excessive speculative positioning is being reduced. Such a development would not guarantee a recovery, but it could help create more stable conditions for buyers.

          Traders should therefore consider XRP's technical structure alongside Bitcoin's performance, broader market liquidity and derivatives positioning rather than relying on a single indicator.

          What Traders Should Watch Before XRP's Next Move

          The coming trading sessions could help determine whether XRP is entering another downward leg or attempting to establish a temporary bottom. Several signals deserve particular attention:

          • Daily closing prices: A sustained close below nearby support would strengthen the bearish scenario, while a recovery above resistance could weaken it.
          • Trading volume: Expanding volume during a decline may confirm stronger selling participation. Increasing volume during a recovery would provide evidence of renewed buying interest.
          • RSI recovery: A move back above 30 on shorter timeframes could indicate easing selling pressure, although it would not independently confirm a trend reversal.
          • Bitcoin direction: A continued decline across the broader cryptocurrency market could make XRP's recovery more difficult.
          • Derivatives positioning: Changes in open interest, funding rates and liquidations may reveal whether speculative selling is intensifying.

          These indicators are most useful when they point in the same direction. For example, a move above resistance supported by stronger spot-market volume and improving momentum would provide a more convincing bullish signal than an isolated price spike.

          XRP Price Outlook: Further Declines Remain Possible

          XRP's immediate technical outlook remains cautious as weakening momentum and nearby support create an unfavorable short-term trading environment. If buyers fail to defend the current price structure, the cryptocurrency could face additional downside pressure, with lower support areas becoming increasingly important.

          Nevertheless, the possibility of a rebound should not be dismissed. Oversold conditions, improving weekly momentum and a recovery above immediate resistance could change the market's direction.

          현재 핵심 쟁점은 매수세가 일시적인 반등에 그치지 않고 지속적인 방어선을 구축할 수 있을지 여부입니다. XRP가 더 강력한 수요를 보여주고 중요한 기술적 지지선을 회복하기 전까지는 추가 하락 위험이 여전히 존재합니다.

          트레이더는 확정된 가격 변동, 거래량 및 전반적인 암호화폐 시장 상황을 모니터링한 후 다음 주요 추세에 대한 결론을 내려야 합니다. 기술적 지지선은 유용한 참고 지점을 제공하지만, 추가 손실을 막아주는 것은 아닙니다.

          위험 경고 및 투자 면책 조항
          여러분은 전략 거래와 관련하여 고 위험성을 이해하고 인정합니다. 모든 전략이나 투자 방법을 따르면 손실이 발생할 수 있습니다. 사이트의 콘텐츠는 정보 제공의 목적으로만 기여자와 분석가가 제공합니다. 귀하의 투자 목표와 재정 상황에 따라 거래 자산, 증권, 전략 또는 기타 상품이 귀하에게 적합한지 여부를 결정할 책임은 전적으로 여러분에게 있습니다.
          즐겨찾기
          공유
          FastBull
          Copyright © 2026 FastBull Ltd

          728 RM B 7/F GEE LOK IND BLDG NO 34 HUNG TO RD KWUN TONG KLN HONG KONG

          TelegramInstagramTwitterfacebooklinkedin
          App Store Google Play Android Windows
          제품
          차트

          채팅

          전문가 Q&A
          필터
          경제일정
          데이터
          Outils
          패스트불 프로
          특징
          기능
          견적
          복사 거래
          AI 전략
          대회
          7x24
          분석
          교육
          회사
          신병 모집
          회사 소개
          문의하기
          NULL_CELL
          다운로드 FastBull
          지원 센터
          피드백
          사용자 계약
          개인 정보 정책
          개인정보 보호 선언
          사업

          화이트 라벨

          Broker API

          데이터API

          웹 플러그인

          포스터 메이커

          제휴 프로그램

          위험 공개

          주식, FX, 상품, 선물, 채권, ETF 또는 암호화폐와 같은 금융 자산 거래의 손실 위험은 상당할 수 있습니다. 중개인에게 자금을 예치할 경우, 이 자금이 전부 손실될 수도 있습니다. 따라서 귀하의 상황과 재정 상황에 비추어 그러한 거래가 귀하에게 적합한지 신중하게 고려해야 합니다.

          본인 스스로 나름대로 철저히 조사를 하거나 재무 관련 상담가와 상의하지 않고는 이러한 투자는 고려해서는 안됩니다. 이런 절차 없이 투자할 경우, 귀하의 재정 상태와 투자 요구 사항을 알지 못한 상태에서 하는 투자이기 때문에 당사의 웹 콘텐츠는 귀하에게 적합하지 않을 수 있습니다. 당사의 재무 정보가 최신으로 업데이트 되는 데는 지연이 있을 수 있고, 부정확한 내용이 포함될 수도 있으므로 모든 거래 및 투자 결정에 대한 책임은 투자자 본인의 몫입니다. 회사는 귀하의 자본 손실에 대해 책임을 지지 않습니다.

          웹사이트의 허가 없이 웹사이트 그래픽, 텍스트 또는 상표를 복사할 수 없습니다. 이 웹사이트에 포함된 콘텐츠 또는 데이터에 대한 지적 재산권은 해당 공급자 및 거래소 판매자에게 있습니다.

          NULL_CELL

          NULL_CELL

          브로커 연결
          신호 제공자가 되어 보세요
          지원 센터
          고객 서비스
          NULL_CELL
          가격 상승/하락 색상

          가입

          가입하기

          위치
          공들여 나열한 것
          전체 화면
          기본 차트로 설정
          fastbull.com 방문 시 기본적으로 차트 페이지가 열립니다