


- GBPUSD
- XAUUSD
- XAGUSD
- WTI
- USDX


견적
분석
사용자
7x24
경제 일정
교육
데이터
- 이름
- 최신 값
- 이전











JEPQ의 배당금 지급 내역을 살펴보세요. 최신 월별 배당금 지급액, 과거 지급액, 2026년 배당금 지급 일정, 배당 수익률, 그리고 다가오는 배당락일을 확인할 수 있습니다.
최종 업데이트: 2026년 10월 29일
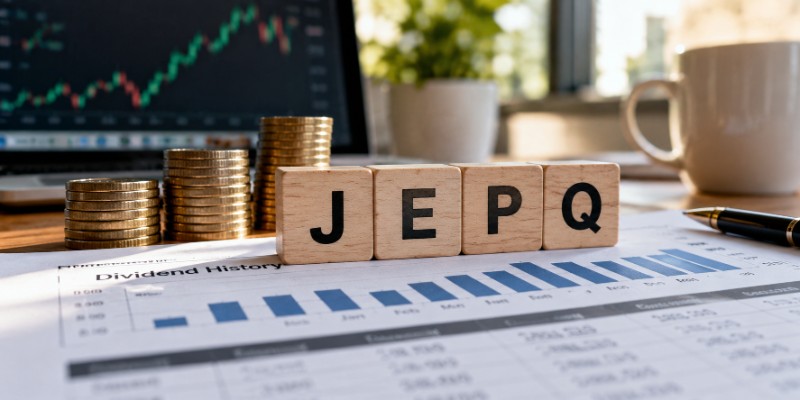
JP모건 나스닥 주식 프리미엄 소득 ETF(JEPQ)는 기술주 중심의 투자에서 월별 배당 수익을 원하는 투자자들에게 인기가 높습니다. 하지만 JEPQ는 실제로 얼마를 배당하며, 다음 배당금 지급일은 언제일까요? JEPQ의 최근 배당금 지급 내역, 지급 이력, 향후 지급 예정일 및 배당 수익률을 자세히 살펴보겠습니다.
목차
JEPQ는 매월 배당금을 지급하며, 지급액은 시장 상황과 펀드의 수익 창출 전략에 따라 변동됩니다. 분기별로 비교적 안정적인 배당금을 지급하는 다른 펀드들과 달리, JEPQ는 고정된 배당금을 약속하지 않습니다.
JEPQ의 가장 최근 배당금은 주당 0.56687달러 였으며 , 2026년 10월 5일에 지급되었습니다. 투자자는 배당금을 받으려면 10월 1일 배당락일 이전에 주식을 보유해야 했습니다.
| 배당금 상세 내역 | 최신 정보 |
|---|---|
| ETF 이름 | JP모건 나스닥 주식 프리미엄 소득 ETF |
| 증권 시세 표시기 | JEPQ |
| 최신 배당금 | 주당 0.56687달러 |
| 배당락일 | 2026년 10월 1일 |
| 기록 날짜 | 2026년 10월 1일 |
| 지불일 | 2026년 10월 5일 |
| 지불 주기 | 월간 간행물 |
| 펀드 운용보수율 | 0.35% |
10월 분배금은 9월의 0.68255달러보다 약 16.9% 낮았습니다. 이러한 변동은 JEPQ에서 흔히 발생하는 현상이며, 펀드의 기초 자산 성과가 부진하다는 것을 반드시 의미하는 것은 아닙니다.
다음 표는 JP Morgan Asset Management의 공식 기록에 따른 JEPQ의 최근 12건의 배당 내역을 보여줍니다.
| 배당락일 | 주당 배당금 | 지불일 |
|---|---|---|
| 2026년 10월 1일 | 0.56687달러 | 2026년 10월 5일 |
| 2026년 9월 1일 | 0.68255달러 | 2026년 9월 3일 |
| 2026년 8월 3일 | 0.70497달러 | 2026년 8월 5일 |
| 2026년 7월 1일 | 0.63658달러 | 2026년 7월 6일 |
| 2026년 6월 1일 | 0.56444달러 | 2026년 6월 3일 |
| 2026년 5월 1일 | 0.59095달러 | 2026년 5월 5일 |
| 2026년 4월 1일 | 0.55860달러 | 2026년 4월 6일 |
| 2026년 3월 2일 | 0.50900달러 | 2026년 3월 4일 |
| 2026년 2월 2일 | 0.46572달러 | 2026년 2월 4일 |
| 2025년 12월 31일 | 0.57610달러 | 2026년 1월 5일 |
| 2025년 12월 1일 | 0.55323달러 | 2025년 12월 3일 |
| 2025년 11월 3일 | 0.47553달러 | 2025년 11월 5일 |
출처: JP Morgan Asset Management – JEPQ 공식 펀드 페이지 .
JEPQ의 월별 배당금은 이 12번의 지급에 걸쳐 주당 약 0.47달러에서 0.70달러 사이였습니다. 2026년 8월에 가장 높은 배당금이 지급되었고, 2월에 가장 낮은 배당금이 지급되었습니다.
2025년 12월 31일 배당금은 2026년 1월에 지급되었습니다. 따라서 표에는 2025년 12월 배당락일이 두 번 표시되고 2026년 1월 배당락일은 표시되지 않습니다.
JEPQ는 일반적으로 월별 배당 일정을 따르며, 배당 기준일은 매월 초이며 배당금 지급은 영업일 기준 며칠 후에 이루어집니다.
2026년 10월 29일 현재, 다음 배송 예정일은 다음과 같습니다.
| 이벤트 | 예정일 |
|---|---|
| 배당락일 | 2026년 11월 2일 |
| 기록 날짜 | 2026년 11월 2일 |
| 지불일 | 2026년 11월 4일 |
| Dividend Amount | Not yet announced |
These are scheduled dates, not a confirmation of the upcoming dividend amount. JEPQ's November payout will only be known once the fund announces its distribution.
Investors buying JEPQ on or after the ex-dividend date will not qualify for that month's payment. To receive it, shares generally must be purchased before the ex-dividend date.
JEPQ pays distributions 12 times per year, typically once each month.
The fund launched in May 2022 and has maintained a monthly distribution structure since its early operations. Payments generally arrive during the first week of the month, although holidays and market calendars can shift the dates.
Investors can check the fund's official dividend calendar for scheduled payment dates. The calendar does not guarantee how much each distribution will be.
Source: J.P. Morgan ETF Dividend Calendar 2026.
JEPQ's relatively high distribution yield is one of its biggest attractions. However, investors should distinguish between the income already paid and the amount they might receive in the future.
Based on the 12 distributions with ex-dividend dates from November 3, 2025, through October 1, 2026, JEPQ paid approximately $6.88 per share.
This is its trailing 12-month (TTM) distribution total, calculated from actual payments rather than an estimate of future income.
Using JEPQ's October 28, 2026 closing price of approximately $60.06, its trailing distribution yield was around 11.46%.
The calculation is straightforward:
TTM Distribution Yield = Annual Distributions Per Share ÷ Current Share Price × 100
$6.88454 ÷ $60.06 × 100 ≈ 11.46%
This figure changes whenever JEPQ's share price moves or a new monthly distribution replaces an older payment in the trailing calculation.
It is also different from the fund's 30-day SEC yield, which measures investment income using a standardized methodology rather than simply adding up past distributions.
JEPQ generates income through a combination of stock dividends and an options-based strategy.
The fund invests primarily in large-cap, Nasdaq-focused equities while using equity-linked notes (ELNs) to generate additional income from option premiums.
These premiums can provide meaningful cash flow, particularly during periods of elevated market volatility.
The trade-off is that the options strategy can limit some of the portfolio's upside when technology stocks rally sharply. JEPQ is designed to balance monthly income with the potential for capital appreciation, not to match every gain of the Nasdaq-100.
Investors can estimate their potential income using JEPQ's historical distributions.
For example, using the latest 12-month total of approximately $6.88454 per share:
| JEPQ Shares | Estimated Monthly Income | Estimated Annual Income |
|---|---|---|
| 100 | $57.37 | $688.45 |
| 250 | $143.43 | $1,721.14 |
| 500 | $286.86 | $3,442.27 |
| 1,000 | $573.71 | $6,884.54 |
| 2,000 | $1,147.42 | $13,769.08 |
These estimates use the trailing 12-month average, not the most recent monthly payout.
For instance, an investor holding 500 JEPQ shares received approximately $283.44 from the October 2026 distribution:
500 shares × $0.56687 = $283.44
That differs from the $286.86 monthly average shown above because JEPQ's distributions fluctuate.
To estimate income for any position:
Monthly Income = Shares Owned × Monthly Distribution Per Share
Annual Income = Shares Owned × TTM Distributions Per Share
The estimates are before taxes and assume that future distributions resemble historical payments. They do not account for reinvestment, changes in share count, or fluctuations in JEPQ's price.
JEPQ's distributions are influenced by option premiums, stock dividends, market volatility, and portfolio positioning.
When option premiums are higher, the fund may generate more distributable income. During quieter markets, premiums can decline.
That helps explain why JEPQ paid approximately $0.705 per share in August 2026 but only $0.567 in October.
A smaller distribution does not automatically mean the fund is in trouble. Investors should examine several months of payments rather than focusing on one unusually high or low amount.
A high dividend yield does not guarantee a high investment return.
Suppose JEPQ distributes 11% over a year, but its share price declines by 8%. An investor's total return would be substantially lower than the distribution yield alone suggests.
Total return includes both cash distributions and changes in share value, with reinvestment included when measuring reinvested total return.
JEPQ's options strategy can also cause it to lag a rapidly rising Nasdaq-100 market. Investors seeking maximum long-term growth may therefore view the fund differently from those prioritizing monthly cash flow.
Yes. JEPQ distributions may be taxable, although the treatment depends on their composition and the investor's tax circumstances.
Payments can include ordinary income, qualified dividends, capital gains, or other tax classifications where applicable.
The final tax treatment is determined through the fund's annual tax reporting rather than the monthly cash amount alone.
Investors should consult their brokerage tax documents or the fund's official tax information before estimating after-tax income.
JEPQ offers a combination that traditional dividend stocks rarely provide: exposure to major technology companies alongside monthly cash distributions supported by an options-based strategy.
2026년 10월 28일 기준 약 11.46%의 누적 배당 수익률은 높은 소득 잠재력을 보여줍니다. 하지만 과거 배당 지급 내역을 살펴보면 투자자들이 해당 수익률을 보장된 연간 수익률로 여겨서는 안 된다는 것을 알 수 있습니다.
정기적인 현금 흐름에 중점을 두는 투자자라면 JEPQ를 고려해 볼 만합니다. 하지만 최대 자본 성장을 우선시하는 투자자라면 옵션 전략으로 인한 잠재적인 상승 여력 제한과 소득 혜택을 신중하게 비교 검토해야 합니다.
가장 유용한 접근 방식은 JEPQ의 배당금 지급 내역, 주가 변동, 그리고 전체 총 수익률을 종합적으로 모니터링하는 것이지, 월별 배당금만으로 ETF를 판단하는 것이 아닙니다.
과거 배당금 지급이 미래 지급을 보장하지는 않습니다. 본 자료는 정보 제공 목적으로 작성되었으며 투자 조언이 아닙니다.

728 RM B 7/F GEE LOK IND BLDG NO 34 HUNG TO RD KWUN TONG KLN HONG KONG


주식, FX, 상품, 선물, 채권, ETF 또는 암호화폐와 같은 금융 자산 거래의 손실 위험은 상당할 수 있습니다. 중개인에게 자금을 예치할 경우, 이 자금이 전부 손실될 수도 있습니다. 따라서 귀하의 상황과 재정 상황에 비추어 그러한 거래가 귀하에게 적합한지 신중하게 고려해야 합니다.
본인 스스로 나름대로 철저히 조사를 하거나 재무 관련 상담가와 상의하지 않고는 이러한 투자는 고려해서는 안됩니다. 이런 절차 없이 투자할 경우, 귀하의 재정 상태와 투자 요구 사항을 알지 못한 상태에서 하는 투자이기 때문에 당사의 웹 콘텐츠는 귀하에게 적합하지 않을 수 있습니다. 당사의 재무 정보가 최신으로 업데이트 되는 데는 지연이 있을 수 있고, 부정확한 내용이 포함될 수도 있으므로 모든 거래 및 투자 결정에 대한 책임은 투자자 본인의 몫입니다. 회사는 귀하의 자본 손실에 대해 책임을 지지 않습니다.
웹사이트의 허가 없이 웹사이트 그래픽, 텍스트 또는 상표를 복사할 수 없습니다. 이 웹사이트에 포함된 콘텐츠 또는 데이터에 대한 지적 재산권은 해당 공급자 및 거래소 판매자에게 있습니다.




