


- GBPUSD
- XAUUSD
- XAGUSD
- WTI
- USDX


견적
분석
사용자
7x24
경제 일정
교육
데이터
- 이름
- 최신 값
- 이전











2026년부터 2030년까지의 HBAR 가격 예측(연간 전망, ETF 동향, 토큰 경제, 주요 위험 요소, 헤데라가 1달러에 도달할 수 있는지에 대한 현실적인 평가 포함).
핵심 요약
헤데라는 기업 파트너십과 블록체인 기술로 주목을 받고 있지만, HBAR 가격은 아직 잠재력을 충분히 반영하지 못하고 있습니다. 2030년까지 1달러에 도달할 수 있을까요? 이 HBAR 가격 예측(2026~2030년)에서는 연간 목표 가격, ETF 수요, 네트워크 성장, 토큰 경제, 그리고 미래를 좌우할 수 있는 주요 위험 요소를 분석합니다.
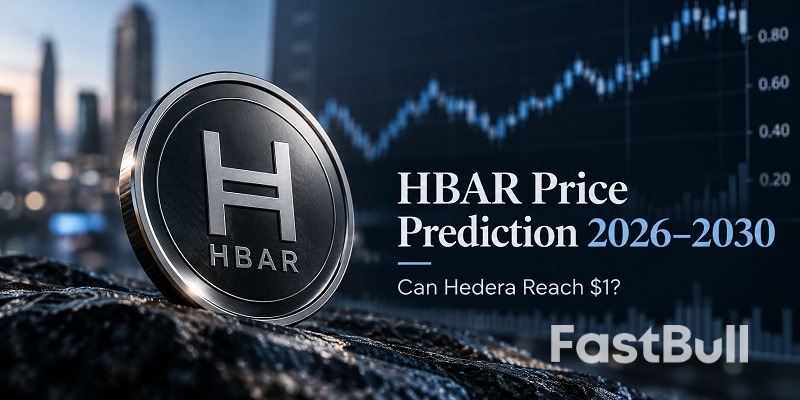
2026년 10월 27일 현재 HBAR는 약 0.076달러에 거래되고 있으며, 시가총액은 약 33억 6천만 달러입니다. 이는 사상 최고가인 0.5692달러 대비 약 86.7% 하락한 수치입니다. 최신 데이터는 CoinGecko의 실시간 HBAR 데이터 에서 확인하세요.
2025년 10월 거래를 시작한 Canary HBAR ETF(HBR)는 증권 계좌를 통해 투자할 수 있습니다. ETF 자금 유입 데이터에 따르면 출시 이후 누적 순유입액은 약 1억 1,400만 달러이며, 2026년 10월 23일까지 한 달 동안 순유입액은 약 410만 달러였습니다. 자금 유입은 여전히 긍정적이었지만, HBAR는 10월 11일 약 0.094달러에서 10월 26일 0.077달러로 하락하여 ETF에 대한 관심만으로는 상승세를 유지할 수 없음을 보여줍니다. HBR 자금 유입 데이터 및 펀드 공식 페이지를 참조하십시오 .
헤데라는 기존의 블록 기반 체인 대신 해시그래프 합의 알고리즘을 사용합니다. HBAR 토큰은 네트워크 수수료를 지불하고 스테이킹을 지원합니다. 수수료는 미국 달러로 책정되지만 HBAR로 지불되므로 기업은 토큰 가격 변동에 관계없이 비용을 예측 가능하게 유지할 수 있습니다. 헤데라는 다양한 산업 분야의 조직으로 구성된 운영 위원회의 감독을 받습니다. 헤데라 개요 및 수수료 모델 설명 에서 더 자세한 내용을 확인하세요 .
이러한 약세, 기본, 강세 시나리오는 네트워크 활동 및 수수료, ETF 수요, 그리고 더 넓은 암호화폐 시장 사이클을 반영합니다. 이는 독립적인 추정치일 뿐이며, 보장된 수치는 아닙니다.
HBAR could finish 2026 between $0.05 and $0.16. Weak sentiment could leave it at $0.05–$0.07; our base case is $0.07–$0.11, while a stronger market and renewed ETF inflows could lift it to $0.12–$0.16. Near term, around $0.075 is a support area to watch, while $0.085–$0.090 may act as resistance. These are technical reference points, not guaranteed turning points.
In 2027, HBAR could trade at $0.04–$0.09 in a bearish scenario, $0.10–$0.20 in a base case, or $0.22–$0.35 if adoption accelerates and the wider crypto market turns bullish. The key test is whether enterprise projects create consistent usage and token demand.
Our 2028 ranges are $0.05–$0.12 bearish, $0.15–$0.30 base, and $0.35–$0.55 bullish. A favorable crypto cycle could help, but Bitcoin’s halving does not guarantee HBAR gains. The bullish case requires real usage and token demand to grow together.
By 2029, HBAR could reach $0.06–$0.15 in a bearish scenario, $0.18–$0.35 in a base case, or $0.45–$0.75 in a bullish one. Tokenized assets, stablecoins, and enterprise applications could lift activity, but low fees may limit how much that growth increases demand for HBAR.
For 2030, our ranges are $0.08–$0.20 bearish, $0.25–$0.50 base, and $0.75–$1.20 bullish. Reaching $1 likely requires a strong bull market, sustained institutional interest, and evidence that network growth benefits HBAR holders. It remains an optimistic scenario.
| Year | Bearish | Base | Bullish |
|---|---|---|---|
| 2026 | $0.05–$0.07 | $0.07–$0.11 | $0.12–$0.16 |
| 2027 | $0.04–$0.09 | $0.10–$0.20 | $0.22–$0.35 |
| 2028 | $0.05–$0.12 | $0.15–$0.30 | $0.35–$0.55 |
| 2029 | $0.06–$0.15 | $0.18–$0.35 | $0.45–$0.75 |
| 2030 | $0.08–$0.20 | $0.25–$0.50 | $0.75–$1.20 |
Network growth and token demand are not the same. Adoption must create lasting demand for HBAR, not just prove that Hedera can process transactions.
As of October 26, 2026, Hedera recorded about 740,000 transactions and 6,443 active addresses in 24 hours. DeFi total value locked was around $30 million, with roughly $1.42 million in decentralized exchange volume over the same period. The figures show activity, but a modest on-chain financial ecosystem relative to HBAR’s multibillion-dollar valuation. Track the metrics on DefiLlama.
Hedera’s low, predictable fees appeal to businesses, but fees are denominated in dollars and paid in HBAR. When HBAR’s price rises, fewer tokens are needed for the same transaction. More transactions therefore may not create proportional buying pressure; demand must also come from broader use, staking, or long-term holding.
HBAR has a fixed maximum supply of 50 billion tokens. CoinGecko listed about 44.3 billion in circulation as of October 27, 2026, or roughly 88.7% of the maximum. A fixed supply limits unlimited issuance, but future releases can still add selling pressure. With most tokens circulating, gains depend on demand absorbing available supply. See current supply data and the Council’s treasury report.
More applications need to generate meaningful economic activity and consistent demand for HBAR. Partnerships are not proof of token value capture. If usage, staking, and long-term holding rise together, HBAR could benefit; otherwise, higher transaction counts may have little price impact.
HBAR’s upside depends on whether Hedera turns enterprise interest into real usage and stronger demand for its token. Three possible drivers stand out.
In April 2026, Accenture joined the Hedera Governing Council, adding a major enterprise name to the network. Council participation may open commercial doors, but only applications used at scale would show whether it creates HBAR demand. Read Hedera’s announcement.
Tokenized real-world assets and stablecoins could expand Hedera’s financial use cases. A project involving Lloyds Banking Group, Aberdeen Investments, and Archax demonstrated tokenized funds and UK government bonds used as collateral for foreign-exchange trades. USDT0 also launched on Hedera in March 2026. These applications could increase activity, but price gains still depend on meaningful HBAR demand. See the RWA case study and USDT0 announcement.
The Canary HBAR ETF provides exposure through a brokerage account without requiring investors to manage tokens directly. Sustained net inflows could support sentiment and add buying demand. But a listing alone cannot guarantee a rally; sustained inflows must coincide with stronger spot demand and network use. Follow the fund’s official page and daily flow data.
Several risks could still limit HBAR’s upside.
ETF flows can change quickly. While HBR recorded net inflows through late October 2026, that demand could slow or reverse. If institutional interest fades, reduced buying pressure could make a recovery harder, especially during a broader crypto downturn.
Hedera competes with networks such as Ethereum, Solana, Avalanche, and Stellar for developers, users, liquidity, and enterprise projects. Technical strengths do not guarantee market share; competitors may attract more applications and capital.
Hedera’s Governing Council offers a structured enterprise-focused model, but investors may weigh it differently from more decentralized networks. Regulatory changes around crypto, staking, or investment products could also affect demand.
HBAR could reach $1 by 2030, but it would need to rise more than 13 times from around $0.076. Our base-case forecast remains below that level, so $1 should be treated as a bullish scenario rather than a likely outcome.
At $1, HBAR’s market cap would be about $44.3 billion at current circulating supply, or $50 billion fully diluted—over 13 times its current market cap. For context, late-October market snapshots put XRP’s market cap around $86 billion and Solana’s near $60 billion. The target is not impossible, but it would place HBAR among the market’s larger crypto assets. See HBAR data and the October 21 market snapshot.
HBAR would need sustained ETF inflows, stronger institutional demand, and real growth in enterprise apps, tokenized assets, and stablecoins that create lasting demand for the token. See the potential growth drivers and key risks above.
$1 is possible, but ambitious. Our base case is $0.25–$0.50 by 2030; reaching $1 or higher would likely require a strong crypto bull market and clear evidence that Hedera’s growth is translating into token demand. Treat it as an optimistic scenario, not a guaranteed destination.
HBAR is not dead, but its long-term value depends on whether Hedera’s growth creates real demand for the token. Partnerships alone cannot guarantee a recovery; see why network growth may not lift the price.
It could revisit $0.5692 if demand and market conditions improve, but a return is not guaranteed. See the price forecasts.
HBAR may offer greater percentage upside because its market cap is smaller, while XRP has a larger established market. Both are risky, and neither is certain to outperform.
Those are ambitious targets: at 50 billion tokens, $5 implies a $250 billion valuation and $10 implies $500 billion, requiring extraordinary demand.
HBAR는 기업 블록체인 도입을 지지하는 사람들에게 적합할 수 있지만, 경쟁 심화, 불확실한 수요, 그리고 변동성으로 인해 위험도가 높습니다. 투자 결정을 내리기 전에 주요 위험 요소를 확인하십시오.

728 RM B 7/F GEE LOK IND BLDG NO 34 HUNG TO RD KWUN TONG KLN HONG KONG


주식, FX, 상품, 선물, 채권, ETF 또는 암호화폐와 같은 금융 자산 거래의 손실 위험은 상당할 수 있습니다. 중개인에게 자금을 예치할 경우, 이 자금이 전부 손실될 수도 있습니다. 따라서 귀하의 상황과 재정 상황에 비추어 그러한 거래가 귀하에게 적합한지 신중하게 고려해야 합니다.
본인 스스로 나름대로 철저히 조사를 하거나 재무 관련 상담가와 상의하지 않고는 이러한 투자는 고려해서는 안됩니다. 이런 절차 없이 투자할 경우, 귀하의 재정 상태와 투자 요구 사항을 알지 못한 상태에서 하는 투자이기 때문에 당사의 웹 콘텐츠는 귀하에게 적합하지 않을 수 있습니다. 당사의 재무 정보가 최신으로 업데이트 되는 데는 지연이 있을 수 있고, 부정확한 내용이 포함될 수도 있으므로 모든 거래 및 투자 결정에 대한 책임은 투자자 본인의 몫입니다. 회사는 귀하의 자본 손실에 대해 책임을 지지 않습니다.
웹사이트의 허가 없이 웹사이트 그래픽, 텍스트 또는 상표를 복사할 수 없습니다. 이 웹사이트에 포함된 콘텐츠 또는 데이터에 대한 지적 재산권은 해당 공급자 및 거래소 판매자에게 있습니다.





