• commercio
  • Quotazioni
  • Copia
  • Concorso
  • 24/7
  • Calendario
  • FAQ
  • Chat
Filtro
SIMBOLO
ULTIMO
OFFERTA
CHIEDERE
ALTO
BASSO
VARIAZIONE NETTA.
%CHG.
SPREAD
FONTE
SPX
S&P 500 Index
7580.07
7580.07
7580.07
7637.48
7527.56
-140.32
-1.82%
--
--
DJI
Dow Jones Industrial Average
51770.31
51770.31
51770.31
52383.90
51563.76
-572.25
-1.09%
--
--
IXIC
NASDAQ Composite Index
25436.99
25436.99
25436.99
25673.00
25177.33
-747.73
-2.86%
--
--
USDX
US Dollar Index
101.807
101.807
101.887
101.913
101.400
+0.104
+ 0.10%
--
--
EURUSD
Euro / US Dollar
1.11561
1.11561
1.11616
1.12144
1.11353
-0.00230
-0.21%
--
--
GBPUSD
Pound Sterling / US Dollar
1.33860
1.33860
1.33926
1.34334
1.33702
+0.00095
+ 0.07%
--
--
XAUUSD
Gold / US Dollar
3875.25
3875.25
3875.25
4026.26
3869.98
-145.70
-3.62%
--
--
WTI
Light Sweet Crude Oil
102.072
102.072
102.102
104.014
101.471
+0.099
+ 0.10%
--
--

Account Comunità

Conti Segnale
--
Conti Redditizi
--
Conti in Perdita
--
Vedi altro

Diventa un fornitore di segnali

Vendi segnali e ottieni entrate

Vedi altro

Guida al Copy Trading

Inizia con facilità e fiducia

Vedi altro

Account di Segnale per Membri

Tutti gli Account di Segnale

Miglior Rendimento
  • Miglior Rendimento
  • Miglior P/L
  • Miglior MDD
Ultima 1 Settimana
  • Ultima 1 Settimana
  • Ultimo 1 Mese
  • Ultimo 1 Anno

Tutti i Contest

  • Tutto
  • Consiglia
  • Azioni
  • Criptovalute
  • Banche centrali
  • Aggiornamenti su Trump
  • Notizie in evidenza
Vedi solo notizie principali
Condividi

La richiesta di asilo politico avanzata da Trump per Bolsonaro ha acuito le tensioni tra Stati Uniti e Brasile, spingendo Rubio e il ministro degli Esteri brasiliano a concordare un nuovo incontro.

Condividi

Lavrov: Putin è disposto a incontrare Zelensky, a condizione che quest'ultimo si rechi a Mosca.

Condividi

Giappone, Stati Uniti e Corea del Sud hanno firmato un memorandum d'intesa sulla cooperazione nell'Artico e nel Pacifico e istituiranno un gruppo di lavoro per promuovere la cooperazione marittima ed economica.

Condividi

Il sindaco di Kiev: L'approvvigionamento idrico della città è stato interrotto a seguito dei raid aerei russi.

Condividi

Ufficio nazionale di statistica cinese: l'indice PMI per la produzione manifatturiera ad alta tecnologia e per la produzione di apparecchiature a ottobre si è attestato rispettivamente al 51,3% e al 50,6%.

Condividi

Il prezzo del petrolio Brent è sceso sotto i 113 dollari nel mercato grigio, registrando un calo di oltre lo 0,7% rispetto al giorno precedente.

Condividi

Ufficio nazionale di statistica cinese: l'indice dell'attività economica non manifatturiera si è attestato al 49,7% nel mese di ottobre.

Condividi

I futures del gas naturale statunitense sono scesi sotto i 2,90 dollari sul mercato grigio, registrando un calo dello 0,7% rispetto al giorno precedente.

Condividi

Secondo l'Ufficio nazionale di statistica cinese, l'indice PMI manifatturiero si è attestato al 49,3% a ottobre, in calo di 0,8 punti percentuali rispetto al mese precedente, indicando una lieve flessione dell'attività manifatturiera. Per dimensione aziendale, il PMI per le grandi imprese si è attestato al 50,2%, in calo di 0,4 punti percentuali rispetto al mese precedente, ma rimanendo comunque al di sopra della soglia critica; i PMI per le medie e piccole imprese si sono attestati rispettivamente al 48,4% e al 47,5%, in calo di 1,3 e 1,4 punti percentuali rispetto al mese precedente, e al di sotto della soglia critica.

Condividi

Ufficio nazionale di statistica cinese: l'indice PMI (Purchasing Managers' Index) del settore manifatturiero si è attestato al 49,3% nel mese di ottobre.

Condividi

Il primo ministro polacco è accusato di aver ordito un colpo di stato contro la Corte costituzionale.

Condividi

Il ministro degli Esteri russo Sergey Lavrov ha dichiarato che l'adesione della Polonia al G20 non porterebbe benefici al gruppo e che Mosca ritiene non vi sia bisogno di un'ulteriore voce europea.

Condividi

Un giudice statunitense ha stabilito che il Dipartimento di Giustizia ha il divieto di minacciare gli addetti alle elezioni.

Condividi

L'amministrazione Trump ha in programma di rimpatriare alcuni migranti afghani in Afghanistan.

Condividi

Trump: Fannie Mae e Freddie Mac investiranno 40 miliardi di dollari nel settore dei mutui ipotecari in Florida.

Condividi

Trump: Abbiamo costruito il confine più sicuro della storia americana. Negli ultimi 17 mesi, a nessun immigrato clandestino è stato permesso di entrare negli Stati Uniti. Abbiamo ottenuto il più grande calo di crimini violenti mai registrato e il tasso di omicidi è sceso al livello più basso dal 1900, ovvero da 125 anni.

Condividi

Trump: Stanziare 40 milioni di dollari di fondi federali per il programma di apprendistato.

Condividi

In Florida, Trump ha annunciato che Johnson & Johnson investirà 1 miliardo di dollari per costruire un grande centro di distribuzione a Jacksonville. Blue Origin investirà 600 milioni di dollari per espandere il suo complesso missilistico presso il Cape Canaveral Space Port. Williams International investirà un altro miliardo di dollari per produrre motori aeronautici nella contea di Ocala, in Florida.

Condividi

L'amministratore delegato di Alaska Airlines Group ha dichiarato che i prezzi del carburante e le sfide geopolitiche hanno esercitato una notevole pressione finanziaria sull'azienda.

Condividi

Alaska Airlines licenzierà circa 200 dipendenti non a contratto; i licenziamenti non riguarderanno le posizioni di prima linea non dirigenziali.

TEMPO
ATTO
FCST
PREC
IMPATTO
Tacchino Indice di fiducia economica (Ottobre)

A:--

F: --

P: --

XAUUSD
  • XAUUSD
  • XAGUSD
  • WTI
  • USDX
UK Indice dei prezzi delle case a livello nazionale mese su mese (Ottobre)

A:--

F: --

P: --
GBPUSD
  • GBPUSD
  • XAUUSD
  • XAGUSD
  • WTI
  • USDX
UK Indice dei prezzi delle case a livello nazionale anno su anno (Ottobre)

A:--

F: --

P: --

GBPUSD
  • GBPUSD
  • XAUUSD
  • XAGUSD
  • WTI
  • USDX
Francia PPI MoM (Settembre)

A:--

F: --

P: --

EURUSD
  • EURUSD
  • XAUUSD
  • XAGUSD
  • WTI
  • USDX
Germania Tasso di disoccupazione (SA) (Ottobre)

A:--

F: --

P: --

EURUSD
  • EURUSD
  • XAUUSD
  • XAGUSD
  • WTI
  • USDX
Germania PIL preliminare su base annua (SA) (Terzo trimestre)

A:--

F: --

P: --

EURUSD
  • EURUSD
  • XAUUSD
  • XAGUSD
  • WTI
  • USDX
Germania PIL preliminare su base annua (non SA) (Terzo trimestre)

A:--

F: --

P: --

EURUSD
  • EURUSD
  • XAUUSD
  • XAGUSD
  • WTI
  • USDX
Germania PIL preliminare trimestrale (SA) (Terzo trimestre)

A:--

F: --

P: --

EURUSD
  • EURUSD
  • XAUUSD
  • XAGUSD
  • WTI
  • USDX
Italia PIL preliminare su base annua (SA) (Terzo trimestre)

A:--

F: --

P: --

EURUSD
  • EURUSD
  • XAUUSD
  • XAGUSD
  • WTI
  • USDX
Zona Euro PIL preliminare trimestrale (SA) (Terzo trimestre)

A:--

F: --

P: --

EURUSD
  • EURUSD
  • XAUUSD
  • XAGUSD
  • WTI
  • USDX
Italia Preliminari IAPC su base annua (Ottobre)

A:--

F: --

P: --

EURUSD
  • EURUSD
  • XAUUSD
  • XAGUSD
  • WTI
  • USDX
Zona Euro Tasso di disoccupazione (Settembre)

A:--

F: --

P: --
EURUSD
  • EURUSD
  • XAUUSD
  • XAGUSD
  • WTI
  • USDX
Zona Euro PIL preliminare su base annua (SA) (Terzo trimestre)

A:--

F: --

P: --

EURUSD
  • EURUSD
  • XAUUSD
  • XAGUSD
  • WTI
  • USDX
Italia Retribuzione oraria media su base mensile (Settembre)

A:--

F: --

P: --

EURUSD
  • EURUSD
  • XAUUSD
  • XAGUSD
  • WTI
  • USDX
Brasile Tasso di disoccupazione (Settembre)

A:--

F: --

P: --

XAUUSD
  • XAUUSD
  • XAGUSD
  • WTI
  • USDX
Sud Africa Bilancia commerciale (Settembre)

A:--

F: --

P: --

XAUUSD
  • XAUUSD
  • XAGUSD
  • WTI
  • USDX
Stati Uniti d'America Indice del costo del lavoro trimestrale (Terzo trimestre)

A:--

F: --

P: --

XAUUSD
  • XAUUSD
  • XAGUSD
  • WTI
  • USDX
Canada PIL su base annua (Agosto)

A:--

F: --

P: --

WTI
  • WTI
  • XAUUSD
  • XAGUSD
  • USDX
Canada PIL su base mensile (SA) (Agosto)

A:--

F: --

P: --

WTI
  • WTI
  • XAUUSD
  • XAGUSD
  • USDX
Germania IAPC preliminare su base mensile (Ottobre)

A:--

F: --

P: --

EURUSD
  • EURUSD
  • XAUUSD
  • XAGUSD
  • WTI
  • USDX
Germania Preliminari IAPC su base annua (Ottobre)

A:--

F: --

P: --

EURUSD
  • EURUSD
  • XAUUSD
  • XAGUSD
  • WTI
  • USDX
Germania MoM finale CPI (Ottobre)

A:--

F: --

P: --

EURUSD
  • EURUSD
  • XAUUSD
  • XAGUSD
  • WTI
  • USDX
Germania PIL finale trimestrale (SA) (Ottobre)

A:--

F: --

P: --

Stati Uniti d'America PMI di Chicago (Ottobre)

A:--

F: --

P: --

USDX
  • USDX
  • XAUUSD
  • XAGUSD
  • WTI
Canada Saldo di bilancio del governo federale (Agosto)

A:--

F: --

P: --

USDCAD
  • USDCAD
  • XAUUSD
  • XAGUSD
  • WTI
  • USDX
Stati Uniti d'America Perforazione totale settimanale

A:--

F: --

P: --

WTI
  • WTI
  • XAUUSD
  • XAGUSD
  • USDX
Stati Uniti d'America Trivellazione petrolifera totale settimanale

A:--

F: --

P: --

WTI
  • WTI
  • XAUUSD
  • XAGUSD
  • USDX
Cina, continente PMI non manifatturiero NBS (Ottobre)

A:--

F: --

P: --

XAUUSD
  • XAUUSD
  • XAGUSD
  • WTI
  • USDX
Cina, continente PMI manifatturiero NBS (Ottobre)

A:--

F: --

P: --

XAUUSD
  • XAUUSD
  • XAGUSD
  • WTI
  • USDX
Cina, continente PMI composito (Ottobre)

A:--

F: --

P: --

XAUUSD
  • XAUUSD
  • XAGUSD
  • WTI
  • USDX
Corea del Sud Bilancia commerciale preliminare (Ottobre)

--

F: --

P: --
Indonesia PMI manifatturiero IHS Markit (Ottobre)

--

F: --

P: --

Australia Permessi di costruire su base annua (SA) (Settembre)

--

F: --

P: --

Australia Permessi di costruire MoM (SA) (Settembre)

--

F: --

P: --

Australia Permessi di costruzione privati MoM (SA) (Settembre)

--

F: --

P: --

Giappone PMI manifatturiero finale (Ottobre)

--

F: --

P: --

Corea del Sud PMI manifatturiero IHS Markit (SA) (Ottobre)

--

F: --

P: --

Cina, continente PMI manifatturiero Caixin (SA) (Ottobre)

--

F: --

P: --

Indonesia Tasso di inflazione su base annua (Ottobre)

--

F: --

P: --

Indonesia Bilancia commerciale (Settembre)

--

F: --

P: --

Indonesia Inflazione core su base annua (Ottobre)

--

F: --

P: --

India HSBC Manufacturing PMI Finale (Ottobre)

--

F: --

P: --

Australia Prezzo delle materie prime su base annua (Ottobre)

--

F: --

P: --

Russia PMI manifatturiero IHS Markit (Ottobre)

--

F: --

P: --

Germania Vendite al dettaglio effettive su mese (Settembre)

--

F: --

P: --

Tacchino PMI manifatturiero (Ottobre)

--

F: --

P: --

Italia PMI manifatturiero (SA) (Ottobre)

--

F: --

P: --

Sud Africa PMI manifatturiero (Ottobre)

--

F: --

P: --

Zona Euro PMI manifatturiero finale (Ottobre)

--

F: --

P: --

UK PMI manifatturiero preliminare (Ottobre)

--

F: --

P: --

Canada Indice di fiducia economica nazionale

--

F: --

P: --

Canada PMI manifatturiero (SA) (Ottobre)

--

F: --

P: --

Stati Uniti d'America Finale PMI manifatturiero IHS Markit (Ottobre)

--

F: --

P: --

Stati Uniti d'America Indice di inventario ISM (Ottobre)

--

F: --

P: --

Stati Uniti d'America Spese di costruzione su base mensile (Settembre)

--

F: --

P: --

Stati Uniti d'America Indice della produzione ISM (Ottobre)

--

F: --

P: --

Stati Uniti d'America Indice ISM sull'occupazione manifatturiera (Ottobre)

--

F: --

P: --

Stati Uniti d'America PMI manifatturiero dell’ISM (Ottobre)

--

F: --

P: --

FAQ con gli esperti
    • Tutto
    • Chat
    • Gruppi
    • Amici
    Skylark flag
    5948210
    adolesencia
    @Visitor5948210hello visitor 👋 how are you doing today hope you are good welcome
    2460732 flag
    If any positive news about war comes before Monday market open is there a chance this can go back to 4000 levels, i am on long from 4000 levels and now. My account is 53% one more drop and my account is wiped. I can put some money if any chance of recovery.Any valuable suggestions.?
    Skylark flag
    suvam giri
    @EuroTraderits going to rain here
    @suvam girihello mate how are you doing today hope you are good welcome
    Trade With Jabo flag
    2460732
    If any positive news about war comes before Monday market open is there a chance this can go back to 4000 levels, i am on long from 4000 levels and now. My account is 53% one more drop and my account is wiped. I can put some money if any chance of recovery.Any valuable suggestions.?
    @Visitor2460732yes i shall help u sir
    Trade With Jabo flag
    IF Anyone need any help in trading send me friend reguest i shall help you
    Đinh Kiên flag
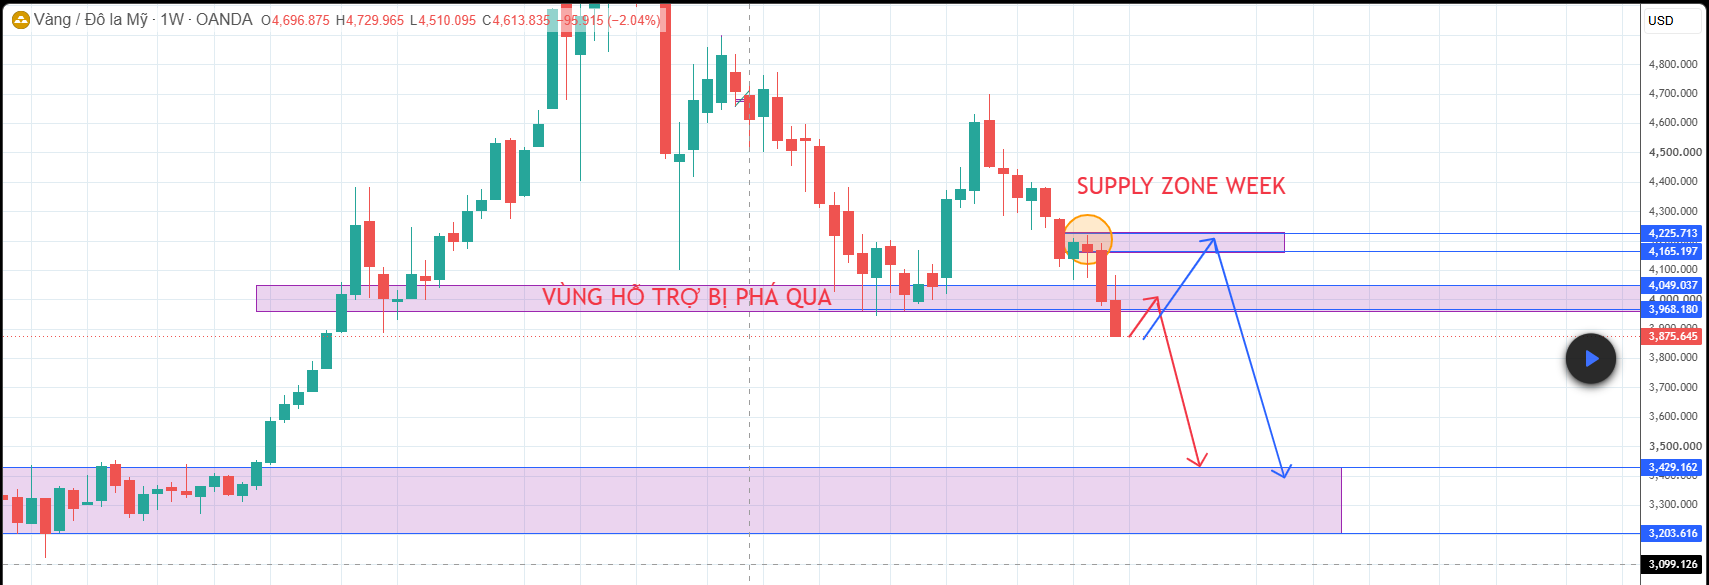
    2. Kịch bản VÀNG trong những tuần tiếp theo - Kịch bản 1 – Tiếp tục giảm trực tiếp: Ngay trong tuần tới, VÀNG có thể tiếp tục chịu áp lực bán và giảm thẳng về các vùng giá thấp hơn, mà không xuất hiện nhịp hồi đáng kể. - Kịch bản 2 – Hồi về vùng kháng cự gần: VÀNG có thể xuất hiện một nhịp hồi lên vùng 3.968 – 4.050. Đây là vùng hỗ trợ cũ đã bị phá vỡ và có khả năng chuyển thành kháng cự. Nếu giá phản ứng tại vùng này, VÀNG có thể tiếp tục quay đầu giảm. - Kịch bản 3 – Hồi sâu về Supply Zone: Trong trường hợp lực hồi mạnh hơn, VÀNG có thể tiếp tục tăng lên SUPPLY ZONE trên khung WEEK, vùng 4.165 – 4.225. Đây là vùng có thể xuất hiện lực bán trở lại. Nếu giá phản ứng và hình thành tín hiệu đảo chiều, xu hướng chính vẫn có thể tiếp tục là giảm. 3. Kết luận - Hiện tại, xu hướng trên khung WEEK vẫn đang nghiêng về phía giảm. Vì vậy, ưu tiên trong vài tuần tới là theo dõi các nhịp hồi lên vùng kháng cự/Supply Zone để tìm tín hiệu tiếp diễn xu hướng giảm, thay vì kỳ vọng VÀNG đảo chiều tăng ngay. - Vùng 3.968 – 4.050 là vùng cần theo dõi trước; nếu giá hồi sâu hơn, chú ý tiếp 4.165 – 4.225. Mục tiêu giảm phía dưới có thể hướng tới 3.200 – 3.400.
    Đinh Kiên flag
    Trade With Jabo flag
    IF Anyone need any help in trading send me friend reguest i shall help you
    Skylark flag
    2460732
    If any positive news about war comes before Monday market open is there a chance this can go back to 4000 levels, i am on long from 4000 levels and now. My account is 53% one more drop and my account is wiped. I can put some money if any chance of recovery.Any valuable suggestions.?
    Bro, I understand the pressure 53% that's heavy. About 4000 again — *nobody can guarantee it before Monday.* Yes, gold is very sensitive to war news. If there's a de-escalation / ceasefire headline over the weekend, we can see a sharp gap DOWN, not up. Gold pumps on fear. Positive war news (peace) usually dumps Gold. So if you're long from 4000, positive news is actually AGAINST your long. Negative war news / escalation would be what pushes Gold back up towards 4000. @Visitor2460732
    Skylark flag
    2460732
    If any positive news about war comes before Monday market open is there a chance this can go back to 4000 levels, i am on long from 4000 levels and now. My account is 53% one more drop and my account is wiped. I can put some money if any chance of recovery.Any valuable suggestions.?
    @Visitor2460732Don't add money to a losing trade just to avoid a margin call.* That's how accounts get fully wiped. Adding money doesn't change the chart, it just makes the loss bigger if it goes lower. Pros call it throwing good money after bad.
    Skylark flag
    2460732
    If any positive news about war comes before Monday market open is there a chance this can go back to 4000 levels, i am on long from 4000 levels and now. My account is 53% one more drop and my account is wiped. I can put some money if any chance of recovery.Any valuable suggestions.?
    @Visitor2460732What is your plan?* If it opens and drops another 1-2%, you said you're wiped. Is it worth risking more capital you can't afford to lose on hope? What most would do in your spot: - Cut the lot size / close half to save the account from liquidation and live to trade another day - Set a hard stop loss where you accept the loss, don't let broker liquidate you - Don't trade the weekend gap — Monday open can be wild with slippage
    Skylark flag
    2460732
    If any positive news about war comes before Monday market open is there a chance this can go back to 4000 levels, i am on long from 4000 levels and now. My account is 53% one more drop and my account is wiped. I can put some money if any chance of recovery.Any valuable suggestions.?
    Not financial advice — just risk management. If you're stressed, step away from the chart for a bit and talk to someone you trust. What was your original stop loss for this trade? @Visitor2460732
    "Trade With Jabo" ha ricordato un messaggio
    Trade With Jabo flag
    2460732
    If any positive news about war comes before Monday market open is there a chance this can go back to 4000 levels, i am on long from 4000 levels and now. My account is 53% one more drop and my account is wiped. I can put some money if any chance of recovery.Any valuable suggestions.?
    @Visitor2460732@Visitor2460732if u want i will help you sir i shall handle your account i shall change your loss into huge profit only i need your trust big loss recovery soon
    "Trade With Jabo" ha ricordato un messaggio
    5920320 flag
    Skylark
    Not financial advice — just risk management. If you're stressed, step away from the chart for a bit and talk to someone you trust. What was your original stop loss for this trade? @Visitor2460732
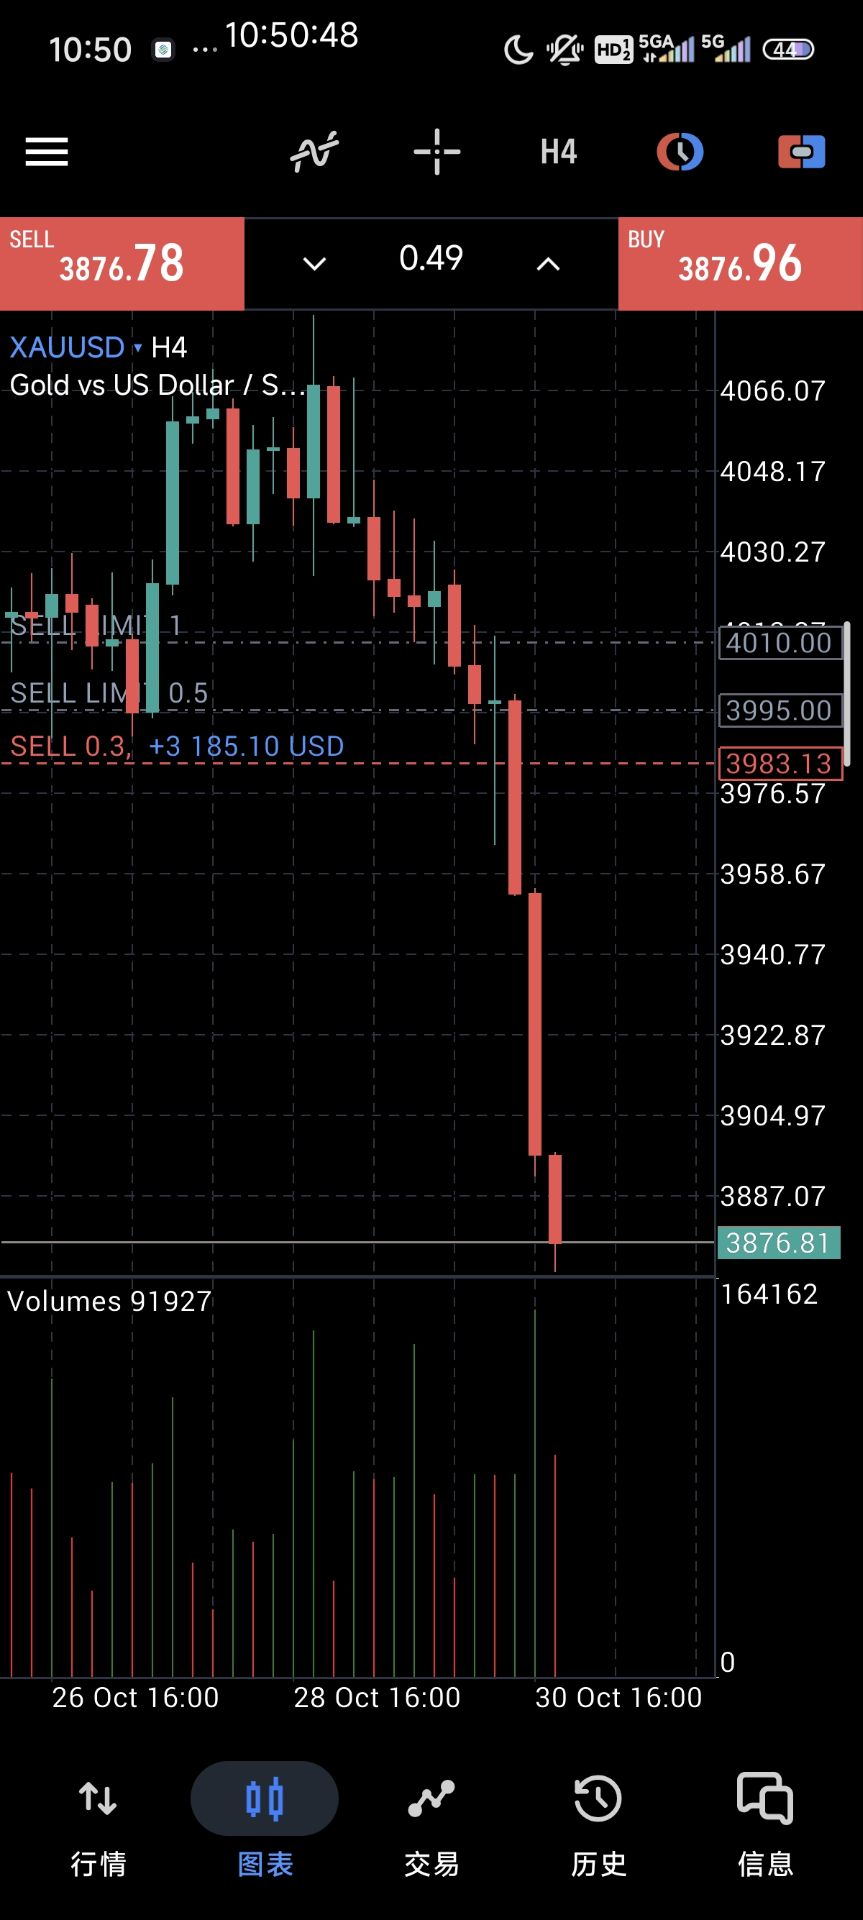
    @Skylark I did not have a stop loss for this trade, could not cut my fingers on time now I guess its time when the throat gets cut due to bad risk management. I get always caught in these big swings down, Down 9850.00 in this trade.
    fulltimetrader flag
    fulltimetrader flag
    5920320
    @Skylark I did not have a stop loss for this trade, could not cut my fingers on time now I guess its time when the throat gets cut due to bad risk management. I get always caught in these big swings down, Down 9850.00 in this trade.
    @游客5920320中国资管
    fulltimetrader flag
    fulltimetrader flag
    5920320
    @Skylark I did not have a stop loss for this trade, could not cut my fingers on time now I guess its time when the throat gets cut due to bad risk management. I get always caught in these big swings down, Down 9850.00 in this trade.
    @游客5920320翻译聊天记录,你就知道了
    Digitare qui...
    Aggiungi il nome o il codice della risorsa

      Nessun dato corrispondente

      Tutto
      Consiglia
      Azioni
      Criptovalute
      Banche centrali
      Aggiornamenti su Trump
      Notizie in evidenza
      • Tutto
      • Conflitto Russia-Ucraina
      • Punto di Tensione in Medio Oriente
      • Tutto
      • Conflitto Russia-Ucraina
      • Punto di Tensione in Medio Oriente
      Cerca
      Prodotto

      Grafico Gratis per sempre

      Chiacchierata FAQ con gli esperti
      Filtro Calendario economico Dati Strumenti
      FastBull VIP Caratteristiche
      Magazzino dati Tendenza di mercato Dati istituzionali Tassi di riferimento Macro

      Tendenza di mercato

      Sentimento speculativo Libro degli Ordini Correlazione

      Indicatori principali

      Grafico Gratis per sempre
      Mercato

      Notizie

      24/7 Analisi Educazione

      Ultime opinioni

      Ultimi aggiornamenti

      Segnale

      Copia Classifica Segnale dell'AI Diventa un fornitore di segnali Valutazione dell'IA
      Concorso
      Brokers

      Panoramica I broker Valutazione Classifiche Regolatori Notizia Reclami
      Elenco dei Broker Strumento di Comparazione dei Broker Forex Confronto degli Spread in Tempo Reale Truffa
      FAQ Reclamo Video di Avviso di Truffa Consigli per Rilevare Truffe
      Altro

      Attività commerciale
      Attività
      Reclutamento Chi siamo Pubblicità Centro assistenza

      Etichetta bianca

      Broker API

      API dati

      Plug-in Web

      Programma di affiliazione

      Premi Valutazione dell'Istituzione IB Seminar Evento del Salone Esposizione
      Vietnam Tailandia Singapore Dubai
      Incontro dei tifosi Sessione di Condivisione degli Investimenti
      Summit FastBull Expo BrokersView
      Ricerche recenti
        Principali ricerche
          Quotazioni
          Analisi
          Utente
          24/7
          Calendario economico
          Educazione
          Dati
          • Nome
          • Ultimo
          • Prec

          Visualizza tutti i risultati della ricerca

          Nessun dato

          Scansiona e scarica

          Faster Charts, Chat Faster!

          Scaricamento
          Italiano
          • English
          • Español
          • العربية
          • Bahasa Indonesia
          • Bahasa Melayu
          • Tiếng Việt
          • ภาษาไทย
          • Français
          • Italiano
          • Türkçe
          • Русский язык
          • 简中
          • 繁中
          Apri un Conto
          Cerca
          Prodotto
          Grafico Gratis per sempre
          Mercato
          Notizie
          Segnale

          Copia Classifica Segnale dell'AI Diventa un fornitore di segnali Valutazione dell'IA
          Concorso
          Brokers

          Panoramica I broker Valutazione Classifiche Regolatori Notizia Reclami
          Elenco dei Broker Strumento di Comparazione dei Broker Forex Confronto degli Spread in Tempo Reale Truffa
          FAQ Reclamo Video di Avviso di Truffa Consigli per Rilevare Truffe
          Altro

          Attività commerciale
          Attività
          Reclutamento Chi siamo Pubblicità Centro assistenza

          Etichetta bianca

          Broker API

          API dati

          Plug-in Web

          Programma di affiliazione

          Premi Valutazione dell'Istituzione IB Seminar Evento del Salone Esposizione
          Vietnam Tailandia Singapore Dubai
          Incontro dei tifosi Sessione di Condivisione degli Investimenti
          Summit FastBull Expo BrokersView

          Le 10 migliori azioni da dividendo del 2026: le migliori scelte per reddito e crescita

          zhan chen
          Resoconto:

          Scopri i 10 migliori titoli azionari con dividendi per il 2026, incluse le opzioni ad alto rendimento e quelle con dividendi in crescita. Confronta rendimenti, rischi e potenziale di reddito a lungo termine.

          Trovare i migliori titoli azionari da dividendo nel 2026 significa guardare oltre i rendimenti più elevati. Un dividendo generoso ha poco valore se l'azienda non è in grado di sostenerlo o se il prezzo delle sue azioni continua a scendere. Dai marchi di consumo affermati alle società energetiche e ai fondi immobiliari, diversi titoli offrono diverse modalità per generare reddito da dividendi. Ecco 10 titoli da tenere d'occhio.
          10 migliori azioni da dividendo 2026: le migliori scelte per reddito e crescita_1

          Sommario

          • 1. Le 10 migliori azioni con dividendi da acquistare nel 2026
          • 2. Migliori azioni con dividendi elevati vs. azioni con dividendi in crescita
          • 3. Come scegliere i migliori titoli azionari con dividendi nel 2026
          • 4. Quanto si può guadagnare con le azioni che distribuiscono dividendi?
          • 5. Le azioni con dividendi sono un buon investimento nel 2026?
          • 6. Quali sono i migliori titoli azionari con dividendi per il 2026?

          Le 10 migliori azioni con dividendi da acquistare nel 2026

          Le società con i dividendi più solidi combinano flussi di cassa affidabili, un debito gestibile e una comprovata capacità di remunerare gli azionisti. Alcune offrono un reddito immediato più elevato, mentre altre puntano a incrementare i dividendi nel tempo.

          I migliori titoli azionari con dividendi del 2026 in sintesi

          AziendaTickerSettoreProfilo dei dividendi
          Johnson JohnsonJNJAssistenza sanitariacrescita dei dividendi a lungo termine
          Procter GamblePGbeni di consumo essenzialireddito difensivo
          Coca-colaCHIBevandeCrescita costante dei dividendi
          PepsiCoPEPCibo e bevandeAzioni di consumo ad alto rendimento
          Reddito immobiliareILImmobiliareDividendi mensili
          ChevronCVXEnergiaEsposizione al reddito e alle materie prime
          Exxon MobilCRUDOEnergiaCrescita dei dividendi e flusso di cassa
          AbbVieABBVAssistenza sanitariaReddito farmaceutico
          McDonald'sMCDLasercrescita dei dividendi
          NextEra EnergyNATAServizi pubbliciReddito e crescita a lungo termine

          Si tratta di titoli da valutare, non di una classifica basata sui rendimenti attesi. I rendimenti da dividendi variano in base al prezzo delle azioni, pertanto gli investitori dovrebbero verificare i rendimenti attuali prima di acquistare.

          1. Johnson & Johnson (JNJ) – La migliore per stabilità a lungo termine

          Johnson & Johnson rimane un nome di spicco nel settore degli investimenti in dividendi. Le sue attività nel settore farmaceutico e delle tecnologie mediche offrono un'esposizione a mercati sanitari meno dipendenti dai cicli di spesa dei consumatori.

          La società ha dichiarato un dividendo trimestrale di 1,34 dollari per azione nell'ottobre 2026, equivalente a un dividendo annualizzato di 5,36 dollari per azione se mantenuto. La sua lunga storia di aumenti dei dividendi la rende attraente per gli investitori che privilegiano la stabilità.

          I rischi principali sono la scadenza dei brevetti, la concorrenza farmaceutica e le responsabilità legali. La domanda di assistenza sanitaria potrebbe essere resiliente, ma le vendite dei singoli farmaci possono variare rapidamente.

          Ideale per: investitori alla ricerca di un'esposizione consolidata al settore sanitario e di una crescita dei dividendi a lungo termine.

          2. Procter Gamble (PG) – Miglior titolo azionario difensivo con dividendi

          Procter & Gamble possiede marchi noti in diversi settori, tra cui detersivi, cura della persona, prodotti per la cura della persona e altre categorie di prodotti di uso quotidiano.

          I consumatori continuano ad acquistare prodotti essenziali anche quando la crescita economica rallenta, il che conferisce a PG un modello di business relativamente difensivo.

          La sua storia di crescita dei dividendi, che dura da decenni, riflette la forza dei suoi marchi e della sua rete di distribuzione.

          Tuttavia, gli investitori dovrebbero prestare attenzione alle valutazioni. Un'azienda affidabile può comunque generare rendimenti deludenti se acquistata a un prezzo elevato.

          Best for: Conservative investors who value business stability over maximum yield.

          3. Coca-Cola (KO) – Best for Consistent Dividend Growth

          Coca-Cola has built its business around globally recognized beverage brands and an extensive distribution network.

          Its recurring sales, pricing power, and asset-light bottling arrangements in many markets support cash generation.

          For dividend investors, the attraction is not necessarily a particularly high starting yield. It is the company's ability to maintain and gradually increase shareholder distributions.

          Risks include changing consumer preferences, currency fluctuations, and pressure from health-conscious purchasing trends.

          Best for: Long-term investors seeking predictable income growth.

          4. PepsiCo (PEP) – Best Consumer Stock for Higher Income

          PepsiCo offers exposure to both beverages and packaged foods, including brands such as Pepsi, Gatorade, Lay's, and Doritos.

          This diversification helps distinguish it from beverage-focused competitors.

          In July 2026, PepsiCo confirmed a quarterly dividend of $1.48 per share, representing an annualized rate of $5.92. The company also reported its 54th consecutive annual dividend increase.

          PepsiCo's yield has been relatively attractive among established consumer staples companies, although investors must consider slowing volume growth, input costs, and debt.

          Best for: Income-focused investors who want exposure to established consumer brands.

          5. Realty Income (O) – Best Monthly Dividend Stock

          Realty Income stands out because it distributes dividends monthly rather than quarterly.

          The real estate investment trust (REIT) owns a diversified portfolio of commercial properties leased to tenants under long-term agreements.

          Its rental income supports regular distributions, making the stock appealing to investors who prefer frequent payments.

          However, Realty Income is sensitive to borrowing costs and property valuations. Higher interest rates can make acquisitions more expensive and reduce the appeal of REIT shares relative to bonds.

          Tenant financial health also matters.

          Best for: Investors seeking monthly dividend income and real estate exposure.

          6. Chevron (CVX) – Best Energy Dividend Stock

          Chevron provides exposure to oil and natural gas production, refining, and related energy operations.

          Its integrated business model can help cushion fluctuations across different parts of the energy market.

          Dividend investors may appreciate Chevron's established payout record and potential to generate substantial cash flow when commodity markets are favorable.

          The drawback is unavoidable: oil and gas prices are volatile. Falling energy prices can reduce profits and limit dividend growth.

          Best for: Investors comfortable with commodity cycles who want energy-sector income.

          7. Exxon Mobil (XOM) – Best for Energy Cash Flow

          Exxon Mobil is another major energy company with a long dividend history.

          Its operations span oil production, natural gas, refining, chemicals, and other energy activities.

          Scale, diversified operations, and disciplined capital spending can support shareholder distributions through changing market conditions.

          Still, Exxon is not immune to weak commodity prices, expensive development projects, or regulatory pressure.

          Investors comparing Exxon and Chevron should examine free cash flow, capital expenditure commitments, and dividend coverage rather than choosing solely by yield.

          Best for: Long-term investors seeking energy exposure with an established dividend record.

          8. AbbVie (ABBV) – Best Pharmaceutical Dividend Stock

          AbbVie offers an income opportunity within the pharmaceutical industry.

          Its portfolio includes immunology, oncology, neuroscience, and other therapeutic areas.

          The company has worked to reduce reliance on Humira as newer medicines, including Skyrizi and Rinvoq, contribute more to its business.

          Future dividend growth depends partly on whether these products can offset competition and support continued earnings expansion.

          Drug pricing pressure, regulatory decisions, and research setbacks remain important risks.

          Best for: Investors seeking pharmaceutical exposure with income potential.

          9. McDonald's (MCD) – Best Dividend Stock for Global Brand Strength

          McDonald's operates one of the world's largest restaurant systems.

          Its heavily franchised model generates revenue from royalties, rent, and franchise-related payments, reducing its direct exposure to some restaurant operating costs.

          That structure helps support cash generation and long-term dividend payments.

          However, consumer spending pressure, rising operating costs for franchisees, and competition can affect sales.

          The stock's valuation also matters because investors often pay a premium for its established brand.

          Best for: Investors seeking dividend growth from a global consumer business.

          10. NextEra Energy (NEE) – Best for Utility Dividend Growth

          NextEra Energy combines regulated utility operations with a significant energy infrastructure and renewables business.

          Its regulated utility activities provide a relatively stable earnings foundation, while investments in electricity generation and infrastructure offer growth opportunities.

          That combination can appeal to investors who want more than a traditional high-yield utility.

          The trade-off is substantial capital spending. Financing costs, regulatory decisions, and project execution can influence future dividend growth.

          Best for: Investors seeking a combination of utility income and long-term growth.

          Best High-Yield Dividend Stocks vs. Dividend Growth Stocks

          Not every dividend investor wants the same thing.

          Someone relying on investment income today may prefer a higher starting yield. A younger investor reinvesting dividends may benefit more from companies that consistently increase payouts.

          Investment GoalStocks to ResearchMain Consideration
          Higher current incomeRealty Income, PepsiCoYield sustainability
          Dividend growthPG, Coca-Cola, McDonald'sValuation and growth
          Defensive incomeJohnson Johnson, PGEarnings stability
          Energy incomeChevron, Exxon MobilCommodity volatility
          Growth plus dividendsNextEra Energy, AbbVieCapital needs and execution

          A high yield is not automatically a bargain. Sometimes it rises because investors expect the company's financial position to deteriorate.

          For context, the SP 500 Dividend Aristocrats Index tracks companies that have increased dividends for at least 25 consecutive years. That history is useful when screening for established dividend payers, although it does not guarantee future payments.

          How to Choose the Best Dividend Stocks in 2026

          Dividend Yield and Payout Ratio

          Dividend yield shows how much annual income a stock pays relative to its current price.

          Dividend Yield = Annual Dividend per Share ÷ Stock Price × 100

          For example, a stock trading at $100 with a $4 annual dividend has a 4% yield.

          The payout ratio indicates how much of a company's earnings are distributed as dividends. An unusually high ratio may suggest limited room for future increases, although acceptable levels differ by industry.

          For REITs, funds from operations and adjusted funds from operations are generally more informative than ordinary earnings alone.

          Free Cash Flow and Debt

          Dividends ultimately require cash.

          Companies with consistent free cash flow, manageable debt, and reasonable capital spending obligations are generally better positioned to maintain distributions.

          A long dividend history is encouraging, but investors should still review the latest financial statements.

          Dividend Growth and Valuation

          A stock yielding 2.5% with strong dividend growth may eventually generate more income than a stock yielding 5% with no increases.

          But growth alone does not justify any purchase price.

          Investors should compare earnings multiples, cash flow, debt, and business prospects before buying.

          How Much Can You Earn From Dividend Stocks?

          Dividend income depends on the amount invested and the portfolio's average yield.

          The following examples assume a constant yield, no dividend reinvestment, and no taxes.

          Investment3% Yield4% Yield5% Yield
          $5,000$150$200$250
          $10,000$300$400$500
          $25,000$750$1,000$1,250
          $50,000$1,500$2,000$2,500
          $100,000$3,000$4,000$5,000

          These are hypothetical annual amounts, not forecasts. Actual dividends can increase, decrease, or stop entirely.

          Dividend reinvestment can increase the number of shares owned over time, potentially strengthening future income. However, it also increases exposure to the underlying stocks.

          Are Dividend Stocks a Good Investment in 2026?

          Dividend stocks can be attractive in 2026, particularly for investors seeking income without depending entirely on share-price appreciation.

          However, their relative appeal depends partly on interest rates and bond yields.

          Quando i titoli di Stato offrono rendimenti competitivi, gli investitori potrebbero richiedere rendimenti più elevati dalle azioni con dividendi per compensare il rischio azionario. Ciò può esercitare pressione sui prezzi delle azioni, in particolare tra le società di servizi pubblici e i REIT (Real Estate Investment Trust).

          Al contrario, costi di finanziamento inferiori possono avvantaggiare alcuni settori orientati al reddito.

          Gli investitori devono inoltre ricordare che i dividendi rappresentano solo una componente del rendimento totale.

          Un titolo azionario che rende il 6% ma perde il 15% del suo valore può comunque generare un rendimento complessivo negativo.

          La diversificazione è importante. Concentrarsi esclusivamente su REIT ad alto rendimento, società di servizi pubblici o aziende energetiche crea rischi specifici di settore.

          Quali sono i migliori titoli azionari con dividendi per il 2026?

          La scelta migliore dipende dal fatto che la priorità sia il reddito immediato, la crescita dei dividendi o una combinazione di entrambi.

          Per una maggiore stabilità a lungo termine, Johnson & Johnson, Procter & Gamble e Coca-Cola rimangono titoli interessanti da analizzare. PepsiCo e Realty Income potrebbero risultare più attraenti per gli investitori alla ricerca di un reddito corrente più elevato, mentre Chevron ed Exxon Mobil offrono un'esposizione al settore energetico.

          AbbVie, McDonald's e NextEra Energy offrono diverse combinazioni di crescita aziendale e distribuzione di dividendi agli azionisti.

          Anziché inseguire il rendimento da dividendi più elevato, concentratevi su aziende in grado di generare costantemente liquidità sufficiente a sostenere la distribuzione dei dividendi.

          In conclusione: i migliori titoli azionari da dividendo per il 2026 non sono necessariamente quelli che pagano di più oggi. Si tratta di aziende in grado di sostenere i dividendi proteggendo al contempo la propria salute finanziaria a lungo termine.

          Questo articolo ha scopo puramente informativo e non costituisce consulenza in materia di investimenti. I prezzi delle azioni, i rendimenti e la situazione finanziaria delle aziende possono variare.

          Avvertenza sui rischi ed esclusione di responsabilità sugli investimenti
          Comprendi e riconosci che esiste un alto grado di rischio coinvolto nel trading con strategie. Seguire qualsiasi strategia o metodologia di investimento è il potenziale di perdita. Il contenuto del sito viene fornito dai nostri collaboratori e analisti solo a scopo informativo. Tu solo sei l'unico responsabile di determinare se qualsiasi attività di negoziazione, o titolo, o strategia, o qualsiasi altro prodotto è adatto a te in base ai tuoi obiettivi di investimento e alla tua situazione finanziaria.
          Preferiti
          Condividi
          FastBull
          Diritto d'autore © 2026 FastBull Ltd

          728 RM B 7/F GEE LOK IND BLDG NO 34 HUNG TO RD KWUN TONG KLN HONG KONG

          TelegramInstagramTwitterfacebooklinkedin
          App Store Google Play Android Windows
          Prodotto
          Grafico

          Chiacchierata

          FAQ con gli esperti
          Filtro
          Calendario economico
          Dati
          Strumenti
          FastBull VIP
          Caratteristiche
          Funzione
          Quotazioni
          Copy Trading
          Segnale dell'AI
          Concorso
          24/7
          Analisi
          Educazione
          Azienda
          Reclutamento
          Chi siamo
          Contattaci
          Pubblicità
          Scaricamento FastBull
          Centro assistenza
          Feedback
          Accordo per gli utenti
          Politica sulla riservatezza
          Dichiarazione sulla Protezione delle Informazioni Personali di
          Attività commerciale

          Etichetta bianca

          Broker API

          API dati

          Plug-in Web

          Creatore di poster

          Programma di affiliazione

          Informativa sui rischi

          Il trading di strumenti finanziari come azioni, valute, materie prime, futures, obbligazioni, fondi o criptovalute è un'attività ad alto rischio, che include la perdita parziale o totale dell'importo dell'investimento, pertanto il trading non è adatto a tutti gli investitori.

          Quando prendi qualsiasi decisione finanziaria, dovresti condurre la tua due diligence, usare il tuo giudizio e consultare consulenti qualificati. Il contenuto di questo sito Web non è rivolto a te, né prendiamo in considerazione la tua situazione finanziaria o le tue esigenze. Le informazioni contenute in questo sito Web non sono necessariamente fornite in tempo reale, né sono necessariamente accurate. I prezzi forniti su questo sito possono essere forniti dai market maker anziché dalle borse. Qualsiasi decisione commerciale o altra decisione finanziaria presa è di esclusiva responsabilità dell'utente e non è possibile fare affidamento su alcuna informazione fornita tramite il sito Web. Non forniamo alcuna garanzia rispetto a qualsiasi informazione sul sito Web e non siamo responsabili per eventuali perdite commerciali che potrebbero derivare dall'uso di qualsiasi informazione sul sito Web.

          L'uso, la memorizzazione, la riproduzione, la visualizzazione, la modifica, la diffusione o la distribuzione dei dati contenuti in questo sito web sono vietati senza il consenso scritto di questo sito web. I fornitori e gli scambi che forniscono i dati contenuti in questo sito Web mantengono tutti i loro diritti di proprietà intellettuale.

          Accesso non effettuato

          Accedi per accedere a più funzionalità

          Connetti al Broker
          Diventa un fornitore di segnali
          Centro assistenza
          Assistenza clienti
          Modalità scura
          Colori di Salita/Discesa Prezzo

          Login

          Registrati

          Posizione
          Disposizione
          Schermo Intero
          Predefinito su Grafico
          La pagina del grafico si apre per impostazione predefinita quando visiti fastbull.com