• Commerce
  • Citations
  • Copie
  • Concours
  • 24/7
  • Calendrier
  • F&Q
  • Chat
Filtres
SYMBOLE
DERNIER
OFFRE
DEMANDER
HAUT
FAIBLE
CHANGEMENT NET.
%CHG.
SPREAD
SOURCE
SPX
S&P 500 Index
7722.60
7722.60
7722.60
7736.24
7677.16
+45.83
+ 0.60%
--
--
DJI
Dow Jones Industrial Average
52377.57
52377.57
52377.57
52477.91
52231.84
+15.99
+ 0.03%
--
--
IXIC
NASDAQ Composite Index
26477.80
26477.80
26477.80
26540.81
26219.31
+308.43
+ 1.18%
--
--
USDX
US Dollar Index
102.215
102.215
102.295
102.227
102.117
+0.045
+ 0.04%
--
--
EURUSD
Euro / US Dollar
1.11214
1.11214
1.11224
1.11317
1.11198
-0.00031
-0.03%
--
--
GBPUSD
Pound Sterling / US Dollar
1.32991
1.32991
1.33002
1.33122
1.32973
-0.00058
-0.04%
--
--
XAUUSD
Gold / US Dollar
4046.50
4046.50
4046.95
4070.62
4045.12
-13.41
-0.33%
--
--
WTI
Light Sweet Crude Oil
100.539
100.539
100.574
100.634
99.021
+1.032
+ 1.04%
--
--

Compte Communautaire

Comptes de signaux
--
Comptes de bénéfices
--
Comptes de pertes
--
Voir plus

Devenez un fournisseur de signaux

Vendez des signaux et obtenez des revenus

Voir plus

Guide du Copy Trading

Commencez facilement et en toute confiance

Voir plus

Comptes de Signaux pour Membres

Tous les Comptes de Signaux

Meilleur Retour
  • Meilleur Retour
  • Meilleur P/L
  • Meilleur MDD
Passé 1S
  • Passé 1S
  • Passé 1M
  • Passé 1A

All Contests

  • Tous
  • Recommander
  • Actions
  • Cryptomonnaies
  • Banques centrales
  • Mises à jour de Trump
  • Actualités en vedette
Actualités à la une uniquement
Partager

Les contrats à terme sur l'or à New York sont tombés sous la barre des 4 060 dollars l'once, en baisse de 0,36 % sur la journée.

Partager

Le contrat principal pour le fioul à faible teneur en soufre (LU) a augmenté de 2,00 % au cours de la journée, se négociant actuellement à 6346,00 yuans/tonne.

Partager

Le cours de l'or au comptant est tombé sous la barre des 4 050 dollars l'once, en baisse de 0,25 % sur la journée.

Partager

Le caoutchouc butadiène 2612 a progressé au cours de la séance, enregistrant une hausse de 3,26 %, pour atteindre un prix de 16 940 yuans/tonne. Le volume d'échanges s'est élevé à environ 10,629 milliards de yuans, tandis que près de 1 500 lots de positions ouvertes ont diminué au cours de la journée, confirmant ainsi la tendance du marché : les prix augmentent lorsque les positions ouvertes diminuent.

Partager

Le principal contrat à terme sur l'éthylène glycol a progressé de 3 % en séance, s'établissant actuellement à 5128,00 yuans.

Partager

Le rendement des obligations d'État japonaises à 10 ans a augmenté de 4 points de base pour atteindre 2,825 %.

Partager

Trump rencontrera les astronautes d'Artemis 3 à la Maison Blanche mercredi à 13h30, heure de l'Est.

Partager

Le prix du pétrole brut Brent a franchi la barre des 111 dollars le baril, en hausse de 1,46 % sur la journée.

Partager

Le principal contrat sur l'alumine a progressé de 2,00 % en séance, s'établissant actuellement à 2599 yuans/tonne.

Partager

Le dollar s'apprécie actuellement de 1 % face au shekel, s'échangeant à 3,084 ; les sondages de sortie des urnes israéliens indiquent que l'élection est serrée, laissant présager un revers pour Netanyahu.

Partager

Le principal contrat à terme sur le charbon à coke a progressé de 2,00 % en séance, s'établissant actuellement à 1930,50 yuans/tonne.

Partager

Le Premier ministre israélien Benjamin Netanyahu : La coalition au pouvoir restera en place. Je n’abandonnerai pas mes partenaires de coalition. Toute personne intéressée à nous rejoindre est la bienvenue, mais seulement si aucun accord n’est trouvé pour une alternance au poste de Premier ministre.

Partager

Le rendement des obligations d'État japonaises à 20 ans a augmenté de 4,0 points de base pour atteindre 3,635 %.

Partager

Le Premier ministre israélien Benjamin Netanyahu : Un gouvernement qui s’appuie sur des partis arabes antisionistes ne doit jamais être formé.

Partager

Lin Honghong, vice-président du Conseil chinois pour la promotion du commerce international, a rencontré Peter White, président du Conseil d'affaires Chine-Grande-Bretagne.

Partager

Le Premier ministre israélien Netanyahu : (À propos de l'Iran) Ce n'est que le début.

Partager

Netanyahu : Israël est confronté à une opportunité historique d'éliminer la menace iranienne.

Partager

Les contrats à terme sur le palladium ont progressé de 1 % aujourd'hui, s'établissant actuellement à 1 038,94 dollars l'once.

Partager

La Banque populaire de Chine (PBOC) a annoncé aujourd'hui avoir réalisé des opérations de rachat à sept jours d'un montant de 151 milliards de yuans, pour un total des offres et des offres retenues s'élevant à 151 milliards de yuans, à un taux d'intérêt de 1,40 %. Parallèlement, elle a mené des opérations de rachat au jour le jour d'un montant de 1 000 milliards de yuans.

Partager

Le Premier ministre israélien Benjamin Netanyahu a déclaré que le camp de droite détenait une nette majorité de sièges.

TEMPS
ACTE
FCST
PRÉCÉDENT
IMPACT
U.S. Commandes de biens durables MoM (Excl. Défense) (SA) (Septembre)

A:--

F: --

P: --
USDX
  • USDX
  • XAUUSD
  • XAGUSD
  • WTI
U.S. Weekly Redbook Commercial Retail Sales YoY (en anglais)

A:--

F: --

P: --

XAUUSD
  • XAUUSD
  • XAGUSD
  • WTI
  • USDX
U.S. Indice S&P/CS des prix des logements dans les 20 villes (Not SA) (Août)

A:--

F: --

P: --

USDX
  • USDX
  • XAUUSD
  • XAGUSD
  • WTI
U.S. Indice S&P/CS des prix des logements dans les 10 villes MoM (NOT SA) (Août)

A:--

F: --

P: --

USDX
  • USDX
  • XAUUSD
  • XAGUSD
  • WTI
U.S. Indice des prix des logements de la FHFA (Août)

A:--

F: --

P: --
USDX
  • USDX
  • XAUUSD
  • XAGUSD
  • WTI
U.S. FHFA Indice des prix des logements en glissement annuel (Août)

A:--

F: --

P: --
USDX
  • USDX
  • XAUUSD
  • XAGUSD
  • WTI
U.S. Indice S&P/CS des prix des logements dans les 10 villes en glissement annuel (Août)

A:--

F: --

P: --

USDX
  • USDX
  • XAUUSD
  • XAGUSD
  • WTI
U.S. Indice S&P/CS des prix des logements dans les 20 villes MoM (SA) (Août)

A:--

F: --

P: --

USDX
  • USDX
  • XAUUSD
  • XAGUSD
  • WTI
U.S. Indice des prix des logements S&P/CS 20-ville YoY (Not SA) (Août)

A:--

F: --

P: --

USDX
  • USDX
  • XAUUSD
  • XAGUSD
  • WTI
U.S. FHFA Indice des prix des logements MoM (Août)

A:--

F: --

P: --
USDX
  • USDX
  • XAUUSD
  • XAGUSD
  • WTI
U.S. Indice des prix des logements dans les 20 villes S&P/CS MoM (Not SA) (Août)

A:--

F: --

P: --

USDX
  • USDX
  • XAUUSD
  • XAGUSD
  • WTI
U.S. Indice de confiance des consommateurs du Conference Board (Octobre)

A:--

F: --

P: --
USDX
  • USDX
  • XAUUSD
  • XAGUSD
  • WTI
U.S. Ventes totales annuelles de logements neufs (Septembre)

A:--

F: --

P: --
USDX
  • USDX
  • XAUUSD
  • XAGUSD
  • WTI
U.S. Indice des revenus des services de la Fed de Richmond (Octobre)

A:--

F: --

P: --

USDX
  • USDX
  • XAUUSD
  • XAGUSD
  • WTI
U.S. Indice des livraisons manufacturières de la Fed de Richmond (Octobre)

A:--

F: --

P: --

USDX
  • USDX
  • XAUUSD
  • XAGUSD
  • WTI
U.S. Indice de confiance des consommateurs du Conference Board (Octobre)

A:--

F: --

P: --

USDX
  • USDX
  • XAUUSD
  • XAGUSD
  • WTI
U.S. Indice du statut des consommateurs du Conference Board (Octobre)

A:--

F: --

P: --

USDX
  • USDX
  • XAUUSD
  • XAGUSD
  • WTI
U.S. Ventes de logements neufs annualisées en glissement mensuel (Septembre)

A:--

F: --

P: --
USDX
  • USDX
  • XAUUSD
  • XAGUSD
  • WTI
U.S. Indice composite manufacturier de la Fed de Richmond (Octobre)

A:--

F: --

P: --

USDX
  • USDX
  • XAUUSD
  • XAGUSD
  • WTI
U.S. Vente aux enchères d'obligations à 5 ans Rendement moyen Rendement

A:--

F: --

P: --

XAUUSD
  • XAUUSD
  • XAGUSD
  • WTI
  • USDX
U.S. Stocks hebdomadaires de pétrole brut API Cushing

A:--

F: --

P: --

WTI
  • WTI
  • XAUUSD
  • XAGUSD
  • USDX
U.S. Stocks hebdomadaires de pétrole brut API

A:--

F: --

P: --

WTI
  • WTI
  • XAUUSD
  • XAGUSD
  • USDX
U.S. Stocks hebdomadaires de pétrole raffiné API

A:--

F: --

P: --

WTI
  • WTI
  • XAUUSD
  • XAGUSD
  • USDX
U.S. Stocks hebdomadaires d'essence API

A:--

F: --

P: --

WTI
  • WTI
  • XAUUSD
  • XAGUSD
  • USDX
Australie IPC pondéré en glissement annuel (Septembre)

A:--

F: --

P: --

Australie CPI QoQ (Troisième trimestre)

A:--

F: --

P: --

AUDUSD
  • AUDUSD
  • XAUUSD
  • XAGUSD
  • WTI
Australie IPC pondéré sur un an (SA) (Septembre)

A:--

F: --

P: --

Australie IPC MoM (SA) (Septembre)

A:--

F: --

P: --

Australie CPI YoY (Troisième trimestre)

A:--

F: --

P: --

AUDUSD
  • AUDUSD
  • XAUUSD
  • XAGUSD
  • WTI
Australie Moyenne trimestrielle de l'IPC de la RBA en glissement annuel (Troisième trimestre)

A:--

F: --

P: --

AUDUSD
  • AUDUSD
  • XAUUSD
  • XAGUSD
  • WTI
Allemagne Indice GfK de confiance des consommateurs (SA) (Novembre)

--

F: --

P: --

Turquie Balance commerciale (Septembre)

--

F: --

P: --

Italie PPI YoY (Septembre)

--

F: --

P: --

Inde Indice de la production industrielle en glissement annuel (Septembre)

--

F: --

P: --

Inde Production manufacturière MoM (Septembre)

--

F: --

P: --

Allemagne Rendement moyen des adjudications de Bunds à 10 ans Rendement

--

F: --

P: --

U.S. MBA Mortgage Application Activity Index WoW

--

F: --

P: --

France (Nord) Chômage classe A (SA) (Septembre)

--

F: --

P: --

U.S. Stocks de gros MoM (SA) (Septembre)

--

F: --

P: --

Le chancelier de l'Échiquier britannique, John Healy, a présenté son premier budget annuel au Parlement depuis sa prise de fonctions.
Canada Taux cible au jour le jour

--

F: --

P: --

Rapport sur la politique monétaire de la BOC
U.S. EIA - Variations hebdomadaires des stocks de mazout de chauffage

--

F: --

P: --

U.S. EIA - Importations hebdomadaires de pétrole brut Modifications

--

F: --

P: --

U.S. EIA hebdomadaire Gasoline Stocks Variation

--

F: --

P: --

U.S. Demande hebdomadaire de brut de l'EIA projetée par la production

--

F: --

P: --

U.S. EIA hebdomadaire Cushing, Oklahoma Crude Oil Stocks Variation

--

F: --

P: --

U.S. EIA hebdomadaire Crude Stocks Variation

--

F: --

P: --

Conférence de presse du COB
République dominicaine Taux de chômage (Septembre)

--

F: --

P: --

République dominicaine Chiffre d'affaires des ventes de détail en glissement annuel (Septembre)

--

F: --

P: --

U.S. Taux plafond du FOMC (ratio des réserves excédentaires)

--

F: --

P: --

U.S. Taux plancher du FOMC (taux des prises en pension au jour le jour)

--

F: --

P: --

Déclaration du FOMC
Conférence de presse du FOMC
F&Q avec des Experts
    • Tous
    • Salons de discussion
    • Groupes
    • Amis
    登峰造极 flag
    怎么看xau
    Tranny Lei flag
    still in long
    登峰造极 flag
    依然看涨 ?
    Tranny Lei flag
    guess so, you are planning on shorting?
    登峰造极 flag
    我有个空单不知道能不能解掉……
    登峰造极 flag
    不用解了,我已经做多了
    5892471 flag
    Still bullish?
    5920033 flag
    buy or sell?
    5920033 flag
    sorry i thought it was ai
    5920033 flag
    what is the best indicator for a rising stock?
    登峰造极 flag
    还是要跌下来
    登峰造极 flag
    5920033
    what is the best indicator for a rising stock?
    @5920033除非你是庄家,不然任何人都无法百分百预测股票上涨或者下跌,
    登峰造极 flag
    5920033
    what is the best indicator for a rising stock?
    @5920033你只能选择好的进场机会,带优秀的止盈止损策略去博弈
    fulltimetrader flag
    早上到78-85附近,砸盘,更准确的分析还要等中午,因为昨天的冲刺,现在结构还不够稳定。
    09153591054 flag
    Germany GfK Consumer Confidence Index (SA) (Nov)
    Act:--,Prev:-30.6,Fcst:-30.9
    Calendrier économique
    sonam flag
    hi everyone 👋
    sonam flag
    登峰造极
    还是要跌下来
    @登峰造极how are you bro
    sonam flag
    登峰造极
    @5920033除非你是庄家,不然任何人都无法百分百预测股票上涨或者下跌,
    I told you gold flying @登峰造极
    sonam flag
    5576803 flag
    sonam
    I told you gold flying @登峰造极
    @sonam Đó là quá khứ. Còn hiện tại thế nào? Vàng tăng hay giảm? @sonam
    Tapez ici...
    Ajouter un symbole ou un code

      Pas de données correspondantes

      Tous
      Recommander
      Actions
      Cryptomonnaies
      Banques centrales
      Mises à jour de Trump
      Actualités en vedette
      • Tous
      • Conflit Russie-Ukraine
      • Point de Tension au Moyen-Orient
      • Tous
      • Conflit Russie-Ukraine
      • Point de Tension au Moyen-Orient
      Recherche
      Produits

      Graphiques Gratuit pour toujours

      Chat F&Q avec des Experts
      Filtres Calendrier économique Données Outil

      FastBull VIP Fonctionnalités
      Entrepôt de données Tendances du marché Données institutionnelles Taux directeurs Macro

      Tendances du marché

      Sentiment spéculatif Carnet d'ordres Corrélation des symboles

      Principaux indicateurs

      Graphiques Gratuit pour toujours
      Marché

      Nouvelles

      24/7 Analyse Education

      Dernières vues

      Dernière mise à jour

      Signaux

      Copie Classement Signaux AI Devenez un fournisseur de signaux Évaluation de l'IA
      Concours
      Brokers

      Aperçu Courtiers Évaluation Classements Régulateurs Nouvelles Réclamations
      Liste des courtiers Outil de comparaison des courtiers Forex Comparaison des spreads en direct Arnaque
      F&Q Plainte Vidéos d'alerte aux arnaques Conseils pour détecter les arnaques
      Plus

      Entreprise
      Événements
      Embauche À propos de nous Publicité Centre d'aide

      Marque blanche

      Broker API

      API de données

      Plug-ins Web

      Programme d'affiliation

      Prix Évaluation de l'institution Séminaire de l'IB Événement Salon Exposition
      Vietnam Thaïland Singapour Dubaï
      Soirée des fans Session de partage d'investissements
      Sommet FastBull Expo BrokersView
      recherches récentes
        Principales recherches
          Citations
          Analyse
          Utilisateur
          24/7
          Calendrier économique
          Education
          Données
          • Des noms
          • Dernier
          • Précédent

          Tout voir

          Pas de données

          Scanner pour télécharger

          Faster Charts, Chat Faster!

          Télécharger
          Français
          • English
          • Español
          • العربية
          • Bahasa Indonesia
          • Bahasa Melayu
          • Tiếng Việt
          • ภาษาไทย
          • Français
          • Italiano
          • Türkçe
          • Русский язык
          • 简中
          • 繁中
          Ouvrir un compte
          Recherche
          Produits
          Graphiques Gratuit pour toujours
          Marché
          Nouvelles
          Signaux

          Copie Classement Signaux AI Devenez un fournisseur de signaux Évaluation de l'IA
          Concours
          Brokers

          Aperçu Courtiers Évaluation Classements Régulateurs Nouvelles Réclamations
          Liste des courtiers Outil de comparaison des courtiers Forex Comparaison des spreads en direct Arnaque
          F&Q Plainte Vidéos d'alerte aux arnaques Conseils pour détecter les arnaques
          Plus

          Entreprise
          Événements
          Embauche À propos de nous Publicité Centre d'aide

          Marque blanche

          Broker API

          API de données

          Plug-ins Web

          Programme d'affiliation

          Prix Évaluation de l'institution Séminaire de l'IB Événement Salon Exposition
          Vietnam Thaïland Singapour Dubaï
          Soirée des fans Session de partage d'investissements
          Sommet FastBull Expo BrokersView

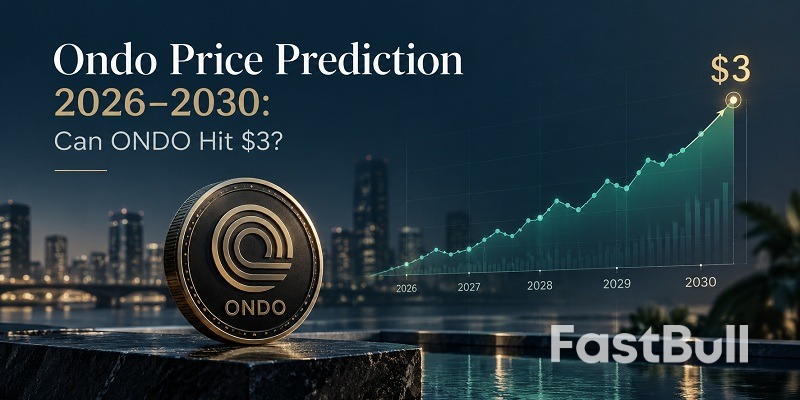
          Prévisions de prix de l'Ondo 2026-2030 : L'Ondo peut-il atteindre 3 $ ?

          zhan chen

          Crypto-monnaie

          Résumé:

          Prévisions de prix d'ONDO 2026-2030 : Peut-il atteindre 3 $ ? Découvrez les prévisions de prix année par année, le potentiel de croissance des actifs pondérés en fonction des risques (RWA), les déblocages de jetons et les principaux risques à venir.

          Prévisions de prix de l'Ondo 2026-2030 : L'Ondo peut-il atteindre 3 $ ?_1

          Ondo Finance transpose les actifs financiers traditionnels sur la blockchain, mais le prix de l'ONDO pourra-t-il suivre la croissance du marché des actifs du monde réel (RWA) ? Entre le déblocage de jetons, l'adoption institutionnelle et la volatilité du marché des cryptomonnaies, atteindre les 3 $ est loin d'être garanti. Cette prévision du prix de l'ONDO pour 2026-2030 explore des objectifs de prix réalistes, les catalyseurs potentiels et les risques que les investisseurs ne doivent pas négliger.

          Points clés à retenir

          • Prix ​​actuel de l'ONDO : environ 0,40 $ au 26 octobre 2026.
          • Prévision du prix pour 2026 : 0,35 $ à 0,55 $ dans un scénario neutre, avec un objectif haussier de 0,55 $ à 0,80 $.
          • Prévision du prix pour 2030 : 0,90 $ à 1,80 $ dans un scénario neutre, pouvant potentiellement atteindre 2,20 $ à 3,50 $ dans des conditions haussières.
          • L'ONDO peut-il atteindre 3 $ ? Oui, c'est possible d'ici 2030, mais cela nécessiterait une forte demande du marché et une adoption soutenue des actifs pondérés en fonction de la demande (RWA).

          Table des matières

          • 1. Qu'est-ce que la finance d'Ondo et quelles sont les performances d'Ondo ?
          • 2. Prévisions des prix de l'ONDO pour 2026-2030
          • 3. ONDO peut-il atteindre 3 milliards de dollars d'ici 2030 ?
          • 4. Facteurs clés susceptibles d'influencer le cours futur d'ONDO
          • 5. Risques d'investissement et perspectives à long terme d'ONDO
          • 6. FAQ sur les prévisions de prix à Ondo

          Qu’est-ce que la finance d’Ondo et quelles sont les performances de l’État d’Ondo ?

          Ondo Finance est une plateforme blockchain qui vise à intégrer les actifs financiers traditionnels à la finance décentralisée (DeFi). Son jeton natif, ONDO, a suscité l'intérêt des investisseurs souhaitant s'exposer au secteur en pleine croissance des actifs du monde réel (RWA). Cependant, la performance d'ONDO sur le marché reste étroitement liée aux tendances générales du marché des cryptomonnaies.

          Qu'est-ce qu'Ondo Finance et à quoi sert le jeton ONDO ?

          Fondée en 2021, Ondo Finance est spécialisée dans la tokenisation d'actifs traditionnels, notamment les bons du Trésor américain et les actions. Des produits comme USDY, OUSG et Ondo Stocks visent à intégrer les instruments financiers traditionnels aux réseaux blockchain.

          ONDO sert principalement de jeton de gouvernance pour l'Ondo DAO, permettant à ses détenteurs de participer aux décisions concernant les paramètres et les mises à jour du protocole. Son offre maximale est de 10 milliards de jetons, sans inflation prévue.

          Il est important de noter que la détention d'ONDO ne donne pas automatiquement droit aux revenus ou aux rendements générés par les produits financiers tokenisés d'Ondo. Sa valeur à long terme dépend notamment de la capacité de la croissance de l'écosystème à se traduire par une demande accrue pour le token.

          Cours actuel, plus haut historique et évolution récente du cours de l'ONDO

          Au 26 octobre 2026, ONDO se négocie à environ 0,40 $ , avec une capitalisation boursière d'environ 1,95 milliard de dollars et environ 4,87 milliards de jetons en circulation.

          ONDO a atteint son plus haut historique d'environ 2,14 $ en décembre 2024 , ce qui place son prix actuel environ 81 % en dessous de ce pic.

          L'évolution récente du cours a été faible, l'ONDO ayant perdu environ 25 % au cours du mois dernier. Cela reflète la volatilité persistante du marché et l'incertitude qui règne dans le secteur des cryptomonnaies.

          For investors evaluating the ONDO price prediction for 2026–2030, the key question is whether growing institutional adoption of real-world assets can support a sustained price recovery despite market volatility and future token unlocks.

          ONDO Price Prediction 2026–2030

          ONDO's future price will depend on how quickly the real-world asset (RWA) market expands, whether Ondo Finance attracts sustained institutional adoption, and how the cryptocurrency market responds to upcoming token unlocks.

          The following ONDO price predictions use three scenarios: bullish, neutral, and bearish. These estimates consider RWA market growth, ONDO's token release schedule, and broader crypto market cycles. They are illustrative price ranges rather than guaranteed targets or statistically calculated forecasts.

          ONDO Price Prediction for End of 2026: Bullish, Neutral, and Bearish Scenarios

          With just over two months remaining in 2026, ONDO's short-term outlook depends largely on market sentiment and whether its price can recover from recent weakness. Trading near $0.40 in late October, ONDO faces three possible year-end scenarios:

          • Bullish scenario ($0.55–$0.80): A broader crypto market recovery, improving RWA sentiment, and renewed buying interest could push ONDO above $0.55. Reaching $0.80 would require particularly strong momentum.
          • Neutral scenario ($0.35–$0.55): ONDO could trade within a relatively narrow range if institutional adoption continues but the wider crypto market remains uncertain. This is our central scenario for the remainder of 2026.
          • Bearish scenario ($0.22–$0.35): Continued selling pressure, weaker Bitcoin performance, or declining demand for altcoins could push ONDO below its current trading range.

          Overall, a year-end price between $0.35 and $0.55 appears more reasonable under neutral assumptions than an immediate return to ONDO's previous all-time high.

          ONDO Price Prediction 2027–2029

          2027: Token supply will be an important challenge. Approximately 1.71 billion ONDO tokens are scheduled to unlock in January 2027, potentially increasing the amount available for trading. Under a neutral scenario, ONDO could finish the year between $0.40 and $0.75. Strong institutional demand and a favorable crypto market could support a bullish range of $0.80–$1.40, while persistent selling pressure could keep prices around $0.18–$0.40.

          2028: If tokenized financial products gain wider adoption and demand for RWA-related crypto assets strengthens, ONDO could move toward $0.55–$1.10 in the neutral scenario. A stronger market cycle could lift prices to $1.20–$2.00, although further token releases and weak market conditions could limit ONDO to $0.18–$0.45.

          2029: With the current token vesting schedule expected to conclude in January 2029, investors may gain greater visibility into ONDO's long-term circulating supply. Under neutral conditions, ONDO could reach $0.70–$1.40. A sustained RWA expansion and strong crypto market could support $1.60–$2.70, while a bearish environment might keep the token near $0.20–$0.55.

          These projections assume that Ondo Finance continues developing its ecosystem. However, growing adoption of tokenized assets does not automatically increase demand for ONDO itself.

          ONDO Price Prediction 2030

          By 2030, ONDO's price could depend more heavily on whether tokenized securities and other real-world assets become established parts of mainstream financial markets.

          In a bullish scenario, ONDO could reach $2.20–$3.50, supported by large-scale RWA adoption, stronger institutional participation, and renewed investor interest in crypto infrastructure tokens.

          Under a neutral scenario, ONDO could trade between $0.90 and $1.80, reflecting steady ecosystem growth without a major speculative rally. In a bearish scenario, regulatory obstacles, competition, and weak token demand could keep prices between $0.25 and $0.70.

          Therefore, ONDO reaching $3 by 2030 is possible, but it is not our base-case forecast. Achieving that level would require substantial growth in the token's market valuation, particularly as more supply enters circulation.

          ONDO Price Prediction 2026–2030: Summary Table

          The table below summarizes our illustrative ONDO year-end price forecasts under different market conditions.

          YearBearish ScenarioNeutral ScenarioBullish Scenario
          2026$0.22–$0.35$0.35–$0.55$0.55–$0.80
          2027$0.18–$0.40$0.40–$0.75$0.80–$1.40
          2028$0.18–$0.45$0.55–$1.10$1.20–$2.00
          2029$0.20–$0.55$0.70–$1.40$1.60–$2.70
          2030$0.25–$0.70$0.90–$1.80$2.20–$3.50

          Note: All forecasts represent potential year-end trading ranges, not guaranteed outcomes or prices maintained throughout the year. The neutral scenario is the central planning assumption, not a statistically proven most likely outcome. Actual prices may fall outside these ranges.

          Market and token supply references: CoinGecko, DefiLlama, and RWA.xyz. Forecast ranges are independent scenario estimates as of October 26, 2026.

          Can ONDO Reach $3 by 2030?

          ONDO reaching $3 by 2030 isn't out of the question, but it won't be an easy climb. The growing real-world asset (RWA) market gives Ondo Finance room to expand, yet a bigger market doesn't necessarily mean a higher ONDO price. Much will depend on whether that growth translates into lasting demand for the token.

          How Much Growth and Market Cap Would ONDO Need to Hit $3?

          At around $0.40 in October 2026, ONDO would need to gain approximately 650%, or 7.5x its current price, to reach $3. That would also put it roughly 40% above its December 2024 all-time high of $2.14.

          But there's another important factor: token supply. ONDO has a maximum supply of 10 billion tokens, and more tokens are scheduled to enter circulation over time.

          Here's what a $3 price would mean for ONDO's valuation:

          • At the current circulating supply of approximately 4.87 billion ONDO: Market capitalization would be around $14.6 billion.
          • At the maximum supply of 10 billion ONDO: Fully diluted valuation (FDV) would reach $30 billion.

          With ONDO's existing token vesting schedule expected to finish in 2029, the $30 billion fully diluted valuation is particularly relevant when looking ahead to 2030. Actual market capitalization would depend on how many tokens are circulating at that point.

          In other words, ONDO would need enough buying demand to support a much higher valuation while absorbing additional token supply.

          What Could Drive ONDO to $3?

          Several developments could help ONDO move toward $3 over the next few years.

          • More institutional adoption: As banks and financial institutions explore tokenized U.S. Treasuries, stocks, and other assets, Ondo Finance could attract more users and business activity. Its partnerships with Chainlink and SBI Group also show how the project is working to expand its reach.
          • A growing RWA market: Tokenized assets are still a relatively small part of the financial system. If more investment platforms and institutions start using blockchain-based financial products, Ondo could benefit from that shift.
          • Another crypto bull market: ONDO could also get a boost from a broader cryptocurrency rally. Stronger Bitcoin performance and renewed interest in altcoins may bring more attention and investment to RWA-related tokens.

          Still, there's an important distinction. ONDO is primarily a governance token, so growth in Ondo Finance's products doesn't automatically mean more revenue for token holders or a higher token price.

          How Likely Is ONDO to Reach $3?

          A $3 ONDO price is possible by 2030, especially if the RWA sector continues expanding and the broader crypto market enters another strong growth cycle. But several things would need to go right, including stronger token demand and limited selling pressure from future unlocks.

          In our earlier projections, the bullish 2030 range of $2.20–$3.50 puts $3 within reach. The neutral range of $0.90–$1.80, however, suggests ONDO could still see meaningful growth without reaching that target.

          It's difficult to put a reliable percentage on the chances of ONDO reaching $3. The outcome will depend on market conditions, institutional adoption, and how investors respond to changes in token supply.

          For now, $3 looks like an ambitious but possible target for 2030, rather than a price investors should count on. Ondo Finance has opportunities in the RWA market, but ONDO still needs sustained demand to turn those opportunities into long-term price growth.

          Key Factors That Could Affect ONDO's Future Price

          ONDO's price isn't driven by Ondo Finance's progress alone. The growth of tokenized financial assets, upcoming token unlocks, and overall crypto market conditions could all influence where the token trades between 2026 and 2030. Here are three factors worth watching.

          RWA Market Growth and Institutional Partnerships

          The growing demand for tokenized real-world assets could be one of ONDO's biggest long-term opportunities. By bringing U.S. Treasuries, stocks, and other financial products onto blockchain networks, Ondo Finance is positioning itself in a market that increasingly attracts traditional financial institutions.

          According to RWA.xyz, the distributed value of tokenized stocks reached approximately $3.52 billion as of October 26, 2026. Ondo is one of the platforms competing for a share of this market.

          Institutional partnerships could help expand that reach. In July 2026, Ondo announced a partnership with Japan's SBI Group to bring Japanese equities onchain and distribute tokenized products through SBI's network. Its collaboration with Chainlink also supports the infrastructure needed to connect traditional financial assets with blockchain applications.

          These developments are encouraging, but announcements alone won't determine ONDO's price. What matters is whether they lead to more users, greater activity across Ondo's products, and stronger demand for its ecosystem.

          Token Unlocks and Circulating Supply Changes

          Token unlocks are another major factor ONDO investors shouldn't ignore. Although ONDO has a fixed maximum supply of 10 billion tokens, not all of them are currently circulating. As previously locked tokens become available, the additional supply could put pressure on prices if demand doesn't keep up.

          As of October 2026, approximately 4.87 billion ONDO tokens are circulating. According to Tokenomics.com, the next major unlock is scheduled for January 18, 2027, with roughly 1.71 billion ONDO set to be released, equivalent to 17.1% of the maximum supply.

          Further major unlocks are scheduled for 2028 and 2029. These releases involve tokens allocated to ecosystem growth, protocol development, and early investors.

          That doesn't mean every unlocked token will be sold immediately. Some may remain held or be used for ecosystem development. Still, large unlock events can make traders cautious, particularly when the broader market is already weak.

          For ONDO's long-term price outlook, the important question is whether demand can grow quickly enough to absorb the increasing supply without putting prolonged pressure on the token's value.

          Crypto Market Trends and Key Support and Resistance Levels

          Even with growing institutional interest, ONDO remains sensitive to the wider cryptocurrency market. Bitcoin price movements, investor risk appetite, and shifts in altcoin trading activity can all influence its short-term direction.

          With ONDO trading around $0.40 in late October 2026, several price levels are worth monitoring.

          On the downside, $0.39–$0.40 is an important near-term support area, where buyers may try to slow further declines. If ONDO falls below this zone, the next levels to watch are around $0.38 and $0.36.

          On the upside, $0.43 is a nearby resistance level, followed by the $0.45 area. A sustained move above these levels could signal improving momentum, although stronger buying volume would help confirm any recovery.

          These levels are based on daily technical indicators as of October 26, 2026, and can change as new price data becomes available. They are reference points rather than guaranteed turning points.

          Looking further ahead, ONDO's ability to recover will depend on more than technical patterns. A healthier crypto market could support a rally, while persistent selling pressure and weak altcoin demand could delay a meaningful recovery.

          ONDO Investment Risks and Long-Term Outlook

          Ondo Finance has established itself in the growing RWA sector, but that doesn't make ONDO a low-risk investment. Its future price still depends on market demand, regulatory developments, and how well the project handles competition and token supply changes. Investors should consider these risks before making long-term price assumptions.

          Regulatory, Competitive, and Tokenomics Risks

          Regulatory uncertainty remains a major challenge for tokenized financial assets. Unlike typical cryptocurrencies, products backed by stocks or government bonds must also comply with financial regulations. For example, Ondo Stocks is currently unavailable to U.S. users through its global platform, while OUSG has investor eligibility requirements. Changes in securities regulations could affect where and how Ondo's products operate.

          Competition is another concern. Ondo isn't the only company bringing traditional assets onto blockchain networks. Established financial firms such as BlackRock, working through Securitize, and Franklin Templeton are also active in tokenization. As more competitors enter the market, Ondo will need to keep attracting users and developing products that stand out.

          Tokenomics also matters. ONDO has a maximum supply of 10 billion tokens, but only about 4.87 billion are currently circulating. Around 1.71 billion additional tokens are scheduled to unlock in January 2027. If demand fails to keep pace with the growing supply, ONDO could face selling pressure even if Ondo Finance continues expanding.

          There's also the question of how much of Ondo's business growth benefits the token itself. ONDO is primarily used for governance, and holding it doesn't automatically give investors a share of the revenue or yields generated by Ondo's financial products.

          Is ONDO Better for Long-Term Holding or Short-Term Trading?

          Whether ONDO makes more sense as a long-term holding or a short-term trade depends on an investor's goals and tolerance for volatility.

          For long-term investors, the main attraction is Ondo's position in the RWA market. If tokenized financial assets become more widely used over the next several years, Ondo Finance could benefit. However, investors also need to consider future token unlocks, competition, and whether growing product adoption will create more demand for ONDO.

          For short-term traders, ONDO's price volatility can create opportunities, particularly around major crypto market moves, partnership announcements, and token unlock events. But those same price swings can lead to substantial losses. Monitoring trading volume, support and resistance levels, and broader market sentiment is especially important.

          Neither approach guarantees better returns. Long-term holders may have to sit through extended price declines, while active traders face the risk of mistiming the market.

          ONDO remains an interesting token to watch as traditional finance moves further onto the blockchain. Still, its long-term success as an investment will depend on more than Ondo Finance's growth alone.

          Disclaimer: This article is for informational purposes only and does not constitute financial advice. Cryptocurrency investments are highly volatile, and investors should conduct their own research before making decisions.

          FAQs about Ondo Price Prediction

          How High Can ONDO Go by the End of 2026?

          ONDO could reach $0.55–$0.80 by the end of 2026 in a bullish market, while a more neutral scenario suggests $0.35–$0.55. Its performance will largely depend on broader crypto market trends and demand for RWA tokens.

          Is It Too Late to Buy ONDO?

          Il n'est pas forcément trop tard pour acheter des ONDO, car le token reste bien en deçà de son précédent record historique et le secteur des actifs pondérés en fonction des risques (RWA) a encore du potentiel de croissance. Cependant, les prochains déblocages de tokens et la volatilité du marché des cryptomonnaies pourraient engendrer des risques de baisse supplémentaires.

          Comment ONDO se compare-t-il aux autres jetons RWA ?

          ONDO se concentre sur la gouvernance au sein d'un écosystème proposant des titres du Trésor américain et des actions tokenisés, tandis que Maple Finance (SYRUP) est lié aux prêts sur la blockchain et Polymesh (POLYX) prend en charge l'infrastructure blockchain pour les actifs réglementés. Chaque token a des usages et des facteurs de risque différents.

          Jusqu'où le cours de l'ONDO pourrait-il monter lors de la prochaine hausse boursière ? Pourrait-il atteindre 5 ou 10 $ ?

          Dans un contexte de marché haussier marqué, ONDO pourrait dépasser son précédent record historique de 2,14 $, notre scénario optimiste pour 2030 prévoyant un cours entre 2,20 $ et 3,50 $. Des prix de 5 $ ou 10 $ sont beaucoup plus spéculatifs, impliquant des valorisations entièrement diluées de 50 milliards de dollars et 100 milliards de dollars, respectivement.

          ONDO est-il un bon investissement à long terme ?

          ONDO pourrait constituer un investissement prometteur, mais risqué, à long terme pour ceux qui anticipent une croissance continue des actifs tokenisés du monde réel. Toutefois, le déblocage des tokens, l'incertitude réglementaire et les avantages économiques directs limités du token demeurent des risques importants.

          Avertissements sur les risques et avertissements en matière d'investissement
          Vous comprenez et reconnaissez que le trading avec des stratégies comporte un degré élevé de risque. Suivre des stratégies ou des méthodologies d’investissement entraîne un risque de perte. Le contenu du site est fourni par nos contributeurs et analystes à titre informatif uniquement. Vous êtes seul responsable de déterminer si des actifs de négociation, des titres, une stratégie ou tout autre produit vous conviennent en fonction de vos objectifs d'investissement et de votre situation financière.
          Favoris
          Partager
          FastBull
          Droits d'auteur © 2026 FastBull Ltd

          728 RM B 7/F GEE LOK IND BLDG NO 34 HUNG TO RD KWUN TONG KLN HONG KONG

          TelegramInstagramTwitterfacebooklinkedin
          App Store Google Play Android Windows
          Produits
          Graphiques

          Chat

          F&Q avec des Experts
          Filtres
          Calendrier économique
          Données
          Outil
          FastBull VIP
          Fonctionnalités
          Fonction
          Citations
          Copy Trading
          Signaux AI
          Concours
          24/7
          Analyse
          Education
          Société
          Embauche
          À propos de nous
          Contactez-nous
          Publicité
          Télécharger FastBull
          Centre d'aide
          Commentaires
          Accord d'utilisation
          Politique de confidentialité
          Déclaration de Protection des Informations Personnelles de
          Entreprise

          Marque blanche

          Broker API

          API de données

          Plug-ins Web

          Créateur d'affiches

          Programme d'affiliation

          Divulgation des risques

          Le risque de perte dans la négociation d'instruments financiers tels que les actions, les devises, les matières premières, les contrats à terme, les obligations, les ETF et les crypto-monnaies peut être substantiel. Vous pouvez subir une perte totale des fonds que vous déposez auprès de votre courtier. Par conséquent, vous devez examiner attentivement si ce type de négociation vous convient, compte tenu de votre situation et de vos ressources financières.

          Aucune décision d'investissement ne doit être prise sans avoir procédé soi-même à une vérification préalable approfondie ou sans avoir consulté ses conseillers financiers. Le contenu de notre site peut ne pas vous convenir car nous ne connaissons pas votre situation financière et vos besoins en matière d'investissement. Nos informations financières peuvent avoir un temps de latence ou contenir des inexactitudes, de sorte que vous devez être entièrement responsable de vos décisions en matière de négociation et d'investissement. La société ne sera pas responsable de vos pertes en capital.

          Sans l'autorisation du site web, vous n'êtes pas autorisé à copier les graphiques, les textes ou les marques du site web. Les droits de propriété intellectuelle sur le contenu ou les données incorporées dans ce site web appartiennent à ses fournisseurs et marchands d'échange.

          Non connecté

          Se connecter pour accéder à d'autres fonctionnalités

          Se connecter au Broker
          Devenez un fournisseur de signaux
          Centre d'aide
          service client
          Mode sombre
          Couleurs prix

          Se connecter

          S'inscrire

          Position
          Mise en page
          Plein écran
          Par défaut sur le graphique
          La page du graphique s'ouvre par défaut lors de la visite de fastbull.com