


Котировки
Новости
Анализ
Пользователь
24/7
Экономический Календарь
Обучение
Данные
- Имена
- Последний
- Пред.


Quarterly earnings results are a good time to check in on a company’s progress, especially compared to its peers in the same sector. Today we are looking at Coherent and the best and worst performers in the electronic components & manufacturing industry.
The sector could see higher demand as the prevalence of advanced electronics increases in industries such as automotive, healthcare, aerospace, and computing. The high-performance components and contract manufacturing expertise required for autonomous vehicles and cloud computing datacenters, for instance, will benefit companies in the space. However, headwinds include geopolitical risks, particularly U.S.-China trade tensions that could disrupt component sourcing and production as the Trump administration takes an increasingly antagonizing stance on foreign relations. Additionally, stringent environmental regulations on e-waste and emissions could force the industry to pivot in potentially costly ways.
The 10 electronic components & manufacturing stocks we track reported a strong Q2. As a group, revenues beat analysts’ consensus estimates by 4.7% while next quarter’s revenue guidance was in line.
Thankfully, share prices of the companies have been resilient as they are up 6.3% on average since the latest earnings results.
Created through the 2022 rebranding of II-VI Incorporated, a company with roots dating back to 1971, Coherent develops and manufactures advanced materials, lasers, and optical components for applications ranging from telecommunications to industrial manufacturing.
Coherent reported revenues of $1.53 billion, up 16.4% year on year. This print exceeded analysts’ expectations by 1.4%. Overall, it was a satisfactory quarter for the company with a beat of analysts’ EPS estimates but revenue guidance for next quarter slightly missing analysts’ expectations.
Jim Anderson, CEO, said, “We delivered a strong fiscal 2025 with revenue growth of 23% and non-GAAP EPS expansion of 191%. We believe we are well positioned to continue to drive strong revenue and profit growth over the long-term given our exposure to key growth drivers such as AI datacenters. We also continue to optimize and focus our portfolio with the recently announced agreement to sell our Aerospace and Defense business. As we enter a new fiscal year, we are excited about the growth opportunities ahead of us.”
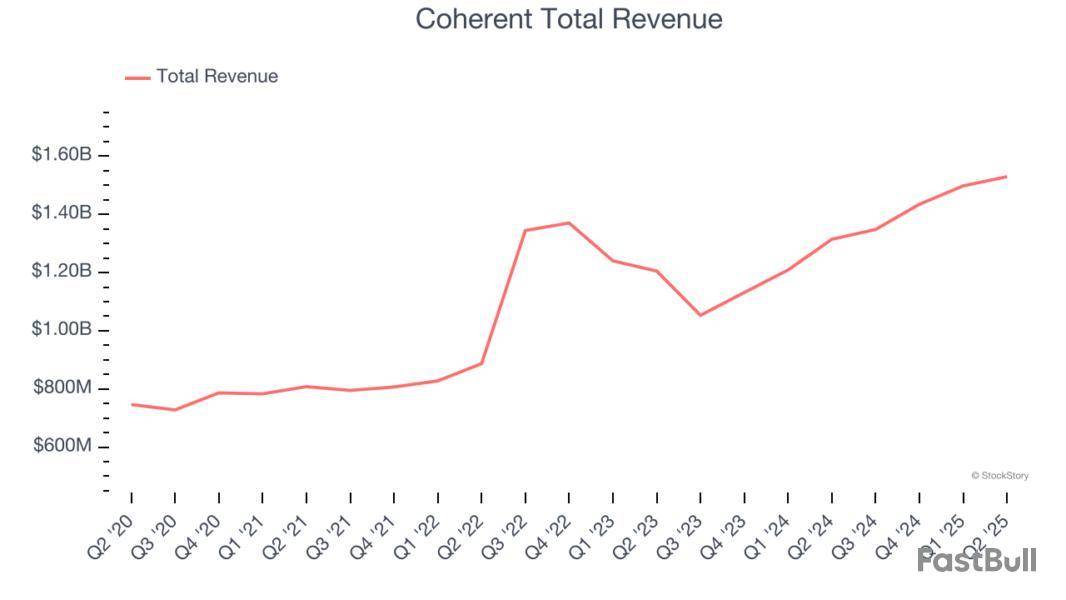
Unsurprisingly, the stock is down 10.6% since reporting and currently trades at $102.
Is now the time to buy Coherent? Access our full analysis of the earnings results here, it’s free.
As one of the world's largest printed circuit board manufacturers with facilities spanning North America and Asia, TTM Technologies manufactures printed circuit boards (PCBs) and radio frequency (RF) components for aerospace, defense, automotive, and telecommunications industries.
TTM Technologies reported revenues of $730.6 million, up 20.7% year on year, outperforming analysts’ expectations by 9%. The business had an exceptional quarter with a solid beat of analysts’ EPS guidance for next quarter estimates and a beat of analysts’ EPS estimates.
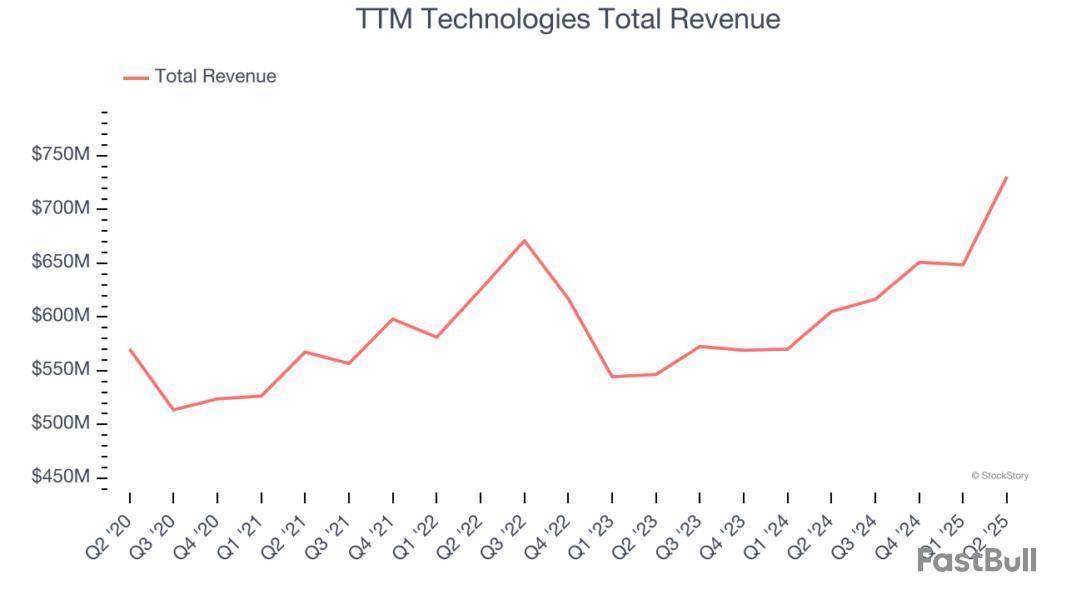
Although it had a fine quarter compared its peers, the market seems unhappy with the results as the stock is down 2% since reporting. It currently trades at $47.78.
Is now the time to buy TTM Technologies? Access our full analysis of the earnings results here, it’s free.
With roots dating back to 1832, making it one of America's oldest continuously operating companies, Rogers designs and manufactures specialized engineered materials and components used in electric vehicles, telecommunications, renewable energy, and other high-performance applications.
Rogers reported revenues of $202.8 million, down 5.3% year on year, exceeding analysts’ expectations by 2%. Still, it was a slower quarter as it posted a significant miss of analysts’ EPS guidance for next quarter estimates and a significant miss of analysts’ EPS estimates.
Interestingly, the stock is up 21% since the results and currently trades at $79.38.
Read our full analysis of Rogers’s results here.
Operating as a critical behind-the-scenes partner for complex technology products since 1979, Benchmark Electronics provides advanced manufacturing, engineering, and technology solutions for original equipment manufacturers across aerospace, medical, industrial, and technology sectors.
Benchmark reported revenues of $642.3 million, down 3.5% year on year. This result surpassed analysts’ expectations by 0.6%. Aside from that, it was a mixed quarter as it also produced a narrow beat of analysts’ EPS guidance for next quarter estimates but revenue guidance for next quarter slightly missing analysts’ expectations.
The stock is flat since reporting and currently trades at $39.02.
Read our full, actionable report on Benchmark here, it’s free.
With over 20,000 team members across 26 global facilities, Plexus designs, manufactures, and services complex electronic products for companies in aerospace/defense, healthcare, and industrial sectors.
Plexus reported revenues of $1.02 billion, up 6% year on year. This print met analysts’ expectations. Overall, it was a strong quarter as it also logged a beat of analysts’ EPS estimates and a decent beat of analysts’ EPS guidance for next quarter estimates.
Plexus had the weakest performance against analyst estimates among its peers. The stock is up 2% since reporting and currently trades at $136.51.
Read our full, actionable report on Plexus here, it’s free.
Market Update
As a result of the Fed’s rate hikes in 2022 and 2023, inflation has come down from frothy levels post-pandemic. The general rise in the price of goods and services is trending towards the Fed’s 2% goal as of late, which is good news. The higher rates that fought inflation also didn't slow economic activity enough to catalyze a recession. So far, soft landing. This, combined with recent rate cuts (half a percent in September 2024 and a quarter percent in November 2024) have led to strong stock market performance in 2024. The icing on the cake for 2024 returns was Donald Trump’s victory in the U.S. Presidential Election in early November, sending major indices to all-time highs in the week following the election. Still, debates around the health of the economy and the impact of potential tariffs and corporate tax cuts remain, leaving much uncertainty around 2025.
728 RM B 7/F GEE LOK IND BLDG NO 34 HUNG TO RD KWUN TONG KLN HONG KONG


Риск потерь при торговле такими финансовыми инструментами, как акции, валюта, сырьевые товары, фьючерсы, облигации, ETF и криптовалюты, может быть значительным. Вы можете полностью потерять средства, размещенные у брокера. Поэтому вам следует тщательно взвесить, подходит ли вам такая торговля с учетом ваших обстоятельств и финансовых ресурсов.
Ни одно решение об инвестировании не должно приниматься без проведения тщательной проверки самостоятельно или без консультации с вашими финансовыми консультантами. Наш веб-контент может не подойти вам, поскольку мы не знаем ваших финансовых условий и инвестиционных потребностей. Наша финансовая информация может иметь задержку или содержать неточности, поэтому вы должны нести полную ответственность за любые ваши торговые и инвестиционные решения. Компания не несет ответственности за потерю вашего капитала.
Без разрешения сайта запрещается копировать графику, тексты или торговые марки сайта. Права интеллектуальной собственности на содержание или данные, включенные в этот сайт, принадлежат его поставщикам и торговцам.
Не вошли в систему
Войдите в систему, чтобы получить доступ к дополнительным функциям

Участник FastBull
Пока нет
Покупка


Войти
Зарегистрироваться


