• Trade
  • Markets
  • Copy
  • Contests
  • 24/7
  • Calendar
  • Q&A
  • Chats
Screeners
SYMBOL
LAST
BID
ASK
HIGH
LOW
NET CHG.
%CHG.
SPREAD
SOURCE
SPX
S&P 500 Index
7473.48
7473.48
7473.48
7506.32
7463.29
+27.75
+ 0.37%
--
--
DJI
Dow Jones Industrial Average
50579.69
50579.69
50579.69
50830.24
50434.65
+294.04
+ 0.58%
--
--
IXIC
NASDAQ Composite Index
26343.96
26343.96
26343.96
26504.55
26309.80
+50.87
+ 0.19%
--
--
USDX
US Dollar Index
99.190
99.190
99.270
99.340
99.080
+0.050
+ 0.05%
--
--
EURUSD
Euro / US Dollar
1.16014
1.16014
1.16051
1.16210
1.15880
-0.00153
-0.13%
--
--
GBPUSD
Pound Sterling / US Dollar
1.34278
1.34278
1.34323
1.34625
1.34129
-0.00007
-0.01%
--
--
XAUUSD
Gold / US Dollar
4509.66
4509.66
4509.66
4545.94
4491.55
-33.22
-0.73%
--
--
WTI
Light Sweet Crude Oil
96.068
96.068
96.163
98.439
93.817
-1.115
-1.15%
--
--

Community Accounts

Signal Accounts
--
Profit Accounts
--
Loss Accounts
--
View More

Become a signal provider

Sell trading signals to earn additional income

View More

Guide to Copy Trading

Get started with ease and confidence

View More

Signal Accounts for Members

All Signal Accounts

Best Return
  • Best Return
  • Best P/L
  • Best MDD
Past 1W
  • Past 1W
  • Past 1M
  • Past 1Y

All Contests

  • All
  • Recommend
  • Stocks
  • Cryptocurrencies
  • Central Banks
  • Trump Updates
  • Featured News
Top News Only
Share

Ukraine Says It Struck A Russian Oil Pumping Station

Share

According To Fox News, Citing U.S. Government Officials, The U.S. Government Will Consider Easing Sanctions If Tehran Makes Concessions On Uranium Enrichment

Share

According To Fox News, Citing A Senior U.S. Official: "We Have Observed That Iran Has Made Serious And Unprecedented Concessions On The Issue Of Uranium Enrichment."

Share

Israeli Prime Minister Netanyahu: US President Trump Reiterated Israel's Right To Defend Its Security In All Aspects, Including In Lebanon

Share

Bond Strategists Warn That Yields Will Remain Elevated Even If The Iran Conflict Ends

Share

US President Trump: Negotiations Are Proceeding In An Orderly And Constructive Manner. I Have Informed My Representatives Not To Rush Into A Deal, Because Time Is On Our Side. The (maritime) Blockade Will Remain In Full Force Until An Agreement Is Reached, Certified, And Signed. Both Sides Must Proceed Slowly And Without Any Mistakes

Share

[A Certain Whale Longed 25x The Value Of $12.6 Million In Gold] May 24th, According To Onchain Lens Monitoring, A Whale Went Long 25x On 2700 Ounces Of Gold, Worth $12.6 Million.The Whale Also Holds A 20x Leveraged Short Position On Crude Oil, Currently With Unrealized Gains Of Over $324,000

Share

[Railgun Token RAIL Briefly Surged Above $4.7 Before Retracing, Posting A More Than 73% Gain In The Last 24 Hours] May 24th, According To HTX Market Data, The Privacy Protocol Railgun's Token RAIL Briefly Surged Above $4.7 Before Falling Back, Now Trading At $4.01, Up Over 73% In The Past 24 Hours

Share

Indian Foreign Minister: Discussed Key Minerals, Artificial Intelligence And Nuclear Energy With US Secretary Of State Rubio

Share

Navigation Warning: Live-Fire Exercises In The Southern Yellow Sea

Share

Three Government Departments Have Dispatched 10,000 Pieces Of Central Disaster Relief Supplies To Chongqing To Support Local Disaster Relief And Assistance Efforts

Share

Market News: Turkish Riot Police Fired Tear Gas And Stormed The Headquarters Of The Main Opposition Party, Expelling The Ousted Leadership

Share

Russia Stated That Its Strikes On Ukraine That Day Targeted Only Military Objectives And Did Not Involve Civilian Infrastructure

Share

The Azerbaijani Consul General In Tabriz, Iran, Died In A Car Accident

Share

According To The Bahrain News Agency, A Bahraini Court Sentenced Nine Defendants To Life Imprisonment For "collaborating With The Iranian Revolutionary Guard."

Share

German Chancellor Merkel: Russia Has Once Again Used The S-300 Missile System To Strike Ukraine. The German Government Strongly Condemns This Reckless Escalation

Share

German Chancellor Merz: Russia Has Once Again Used The Hazel Missile System To Attack Ukraine. The German Government Strongly Condemns This Reckless Escalation

Share

China Will Release, In Due Course, Foreign Trade Data For The Guangdong-Hong Kong-Macao Greater Bay Area As A Whole

Share

German Foreign Minister: Russia's Missile Attacks On Ukraine Are Shocking; The Use Of Iskander Missiles Marks Yet Another Escalation

Share

German Foreign Minister: Russia’s Missile Attack On Ukraine Is Shocking; The Use Of Hazel Missiles Marks Yet Another Escalation

TIME
ACT
FCST
PREV
IMPACT
U.S. Weekly Treasuries Held by Foreign Central Banks

A:--

F: --

P: --

USDX
  • USDX
  • XAUUSD
  • XAGUSD
  • WTI
U.K. GfK Consumer Confidence Index (May)

A:--

F: --

P: --

GBPUSD
  • GBPUSD
  • XAUUSD
  • XAGUSD
  • WTI
Japan CPI MoM (Apr)

A:--

F: --

P: --

USDJPY
  • USDJPY
  • XAUUSD
  • XAGUSD
  • WTI
  • USDX
Japan National CPI MoM (Apr)

A:--

F: --

P: --

USDJPY
  • USDJPY
  • XAUUSD
  • XAGUSD
  • WTI
Japan National CPI YoY (Apr)

A:--

F: --

P: --

USDJPY
  • USDJPY
  • XAUUSD
  • XAGUSD
  • WTI
Japan National Core CPI YoY (Apr)

A:--

F: --

P: --

USDJPY
  • USDJPY
  • XAUUSD
  • XAGUSD
  • WTI
Japan National CPI MoM (Not SA) (Apr)

A:--

F: --

P: --

USDJPY
  • USDJPY
  • XAUUSD
  • XAGUSD
  • WTI
ECB Chief Economist Lane Speaks
U.K. Retail Sales MoM (SA) (Apr)

A:--

F: --

P: --

GBPUSD
  • GBPUSD
  • XAUUSD
  • XAGUSD
  • WTI
  • USDX
U.K. Retail Sales YoY (SA) (Apr)

A:--

F: --

P: --
GBPUSD
  • GBPUSD
  • XAUUSD
  • XAGUSD
  • WTI
  • USDX
Germany GfK Consumer Confidence Index (SA) (Jun)

A:--

F: --

P: --
EURUSD
  • EURUSD
  • XAUUSD
  • XAGUSD
  • WTI
  • USDX
U.K. Core Retail Sales YoY (SA) (Apr)

A:--

F: --

P: --
GBPUSD
  • GBPUSD
  • XAUUSD
  • XAGUSD
  • WTI
  • USDX
ECB Chief Economist Lane Speaks
Turkey Capacity Utilization (May)

A:--

F: --

P: --

XAUUSD
  • XAUUSD
  • XAGUSD
  • WTI
  • USDX
Turkey Trade Balance (Apr)

A:--

F: --

P: --

XAUUSD
  • XAUUSD
  • XAGUSD
  • WTI
  • USDX
Germany Ifo Current Business Situation Index (SA) (May)

A:--

F: --

P: --

EURUSD
  • EURUSD
  • XAUUSD
  • XAGUSD
  • WTI
  • USDX
Germany Ifo Business Expectations Index (SA) (May)

A:--

F: --

P: --
EURUSD
  • EURUSD
  • XAUUSD
  • XAGUSD
  • WTI
  • USDX
Germany IFO Business Climate Index (SA) (May)

A:--

F: --

P: --
EURUSD
  • EURUSD
  • XAUUSD
  • XAGUSD
  • WTI
  • USDX
Mexico Economic Activity Index YoY (Mar)

A:--

F: --

P: --

XAUUSD
  • XAUUSD
  • XAGUSD
  • WTI
  • USDX
Canada Industrial Product Price Index YoY (Apr)

A:--

F: --

P: --
USDCAD
  • USDCAD
  • XAUUSD
  • XAGUSD
  • WTI
  • USDX
Canada Retail Sales MoM (SA) (Mar)

A:--

F: --

P: --

USDCAD
  • USDCAD
  • XAUUSD
  • XAGUSD
  • WTI
  • USDX
Canada Industrial Product Price Index MoM (Apr)

A:--

F: --

P: --
USDCAD
  • USDCAD
  • XAUUSD
  • XAGUSD
  • WTI
  • USDX
Canada Core Retail Sales MoM (SA) (Mar)

A:--

F: --

P: --
USDCAD
  • USDCAD
  • XAUUSD
  • XAGUSD
  • WTI
  • USDX
U.S. Conference Board Leading Economic Index MoM (Apr)

A:--

F: --

P: --

USDX
  • USDX
  • XAUUSD
  • XAGUSD
  • WTI
U.S. Conference Board Leading Economic Index (Apr)

A:--

F: --

P: --

USDX
  • USDX
  • XAUUSD
  • XAGUSD
  • WTI
U.S. Conference Board Coincident Economic Index MoM (Apr)

A:--

F: --

P: --

USDX
  • USDX
  • XAUUSD
  • XAGUSD
  • WTI
U.S. Conference Board Lagging Economic Index MoM (Apr)

A:--

F: --

P: --

USDX
  • USDX
  • XAUUSD
  • XAGUSD
  • WTI
U.S. Weekly Total Rig Count

A:--

F: --

P: --

WTI
  • WTI
  • XAUUSD
  • XAGUSD
  • USDX
U.S. Weekly Total Oil Rig Count

A:--

F: --

P: --

WTI
  • WTI
  • XAUUSD
  • XAGUSD
  • USDX
Argentina Retail Sales YoY (Mar)

A:--

F: --

P: --

XAUUSD
  • XAUUSD
  • XAGUSD
  • WTI
  • USDX
Turkey Economic Sentiment Indicator (May)

--

F: --

P: --

Canada National Economic Confidence Index

--

F: --

P: --

Mexico Trade Balance (Apr)

--

F: --

P: --

U.K. BRC Shop Price Index YoY (May)

--

F: --

P: --

U.K. CBI Retail Sales Expectations Index (May)

--

F: --

P: --

U.K. CBI Distributive Trades (May)

--

F: --

P: --

Brazil Current Account (Apr)

--

F: --

P: --

U.S. Chicago Fed National Activity Index (Apr)

--

F: --

P: --

U.S. S&P/CS 20-City Home Price Index YoY (Not SA) (Mar)

--

F: --

P: --

U.S. S&P/CS 20-City Home Price Index MoM (SA) (Mar)

--

F: --

P: --

U.S. FHFA House Price Index MoM (Mar)

--

F: --

P: --

U.S. FHFA House Price Index (Mar)

--

F: --

P: --

U.S. FHFA House Price Index YoY (Mar)

--

F: --

P: --

U.S. S&P/CS 10-City Home Price Index MoM (Not SA) (Mar)

--

F: --

P: --

U.S. S&P/CS 10-City Home Price Index YoY (Mar)

--

F: --

P: --

U.S. S&P/CS 20-City Home Price Index (Not SA) (Mar)

--

F: --

P: --

U.S. S&P/CS 20-City Home Price Index MoM (Not SA) (Mar)

--

F: --

P: --

U.S. Conference Board Consumer Expectations Index (May)

--

F: --

P: --

U.S. Conference Board Consumer Confidence Index (May)

--

F: --

P: --

U.S. Conference Board Present Situation Index (May)

--

F: --

P: --

U.S. Dallas Fed General Business Activity Index (May)

--

F: --

P: --

U.S. Dallas Fed New Orders Index (May)

--

F: --

P: --

U.S. 2-Year Note Auction Avg. Yield

--

F: --

P: --

Australia Westpac Leading Index MoM (Apr)

--

F: --

P: --
China, Mainland Industrial Profit YoY (YTD) (Apr)

--

F: --

P: --

Australia Construction Work Done YoY (Q1)

--

F: --

P: --

Australia RBA Trimmed Mean CPI YoY (Q2)

--

F: --

P: --

Australia Construction Work Done QoQ (SA) (Q1)

--

F: --

P: --

France Unemployment Class-A (Apr)

--

F: --

P: --

U.S. MBA Mortgage Application Activity Index WoW

--

F: --

P: --

Q&A with Experts
    • All
    • Chatrooms
    • Groups
    • Friends
    EuroTrader flag
    2169832
    @EuroTradervery true
    @Visitor2169832Yeah, many failed to know that and they burn out easily because the market didn't meet their expectations
    EuroTrader flag
    2169832
    @EuroTradervery true
    @Visitor2169832Hey friend, hope you are preparing for the week?
    JABO GOLD TRADER flag
    hello guys
    EuroTrader flag
    JABO GOLD TRADER
    hello guys
    @JABO GOLD TRADER Hello mate, welcome back, how are you doing today?
    JABO GOLD TRADER flag
    EuroTrader
    @JABO GOLD TRADER Hello mate, welcome back, how are you doing today?
    @EuroTraderfine brother and you
    EuroTrader flag
    JABO GOLD TRADER
    @EuroTraderfine brother and you
    @JABO GOLD TRADER I'm doing okay, thanks for asking, hope you are preparing for the week?
    JABO GOLD TRADER flag
    EuroTrader
    @JABO GOLD TRADER I'm doing okay, thanks for asking, hope you are preparing for the week?
    @EuroTraderyes brother I am ready to kill gold
    EuroTrader flag
    JABO GOLD TRADER
    @EuroTraderyes brother I am ready to kill gold
    @JABO GOLD TRADER wow that's really good, it's gonna be an interesting week trust me .
    EuroTrader flag
    JABO GOLD TRADER
    @EuroTraderyes brother I am ready to kill gold
    @JABO GOLD TRADER So tell me friend, which side are you pushing gold when the market opens?
    JABO GOLD TRADER flag
    EuroTrader
    @JABO GOLD TRADER So tell me friend, which side are you pushing gold when the market opens?
    @EuroTraderfirst gold can touch 4528 Then gold will big fall my target 4465
    JABO GOLD TRADER flag
    EuroTrader
    @JABO GOLD TRADER So tell me friend, which side are you pushing gold when the market opens?
    @EuroTradertomorrow only sell brother
    EuroTrader flag
    JABO GOLD TRADER
    @EuroTraderfirst gold can touch 4528 Then gold will big fall my target 4465
    @JABO GOLD TRADER wow that's really good, I've seen a lot of people projecting gold to buy tomorrow
    EuroTrader flag
    JABO GOLD TRADER
    @EuroTradertomorrow only sell brother
    @JABO GOLD TRADER Yeah I'm seeing that too, even on the EURUSD, the structure is looking bearish
    JABO GOLD TRADER flag
    EuroTrader
    @JABO GOLD TRADER wow that's really good, I've seen a lot of people projecting gold to buy tomorrow
    @EuroTraderaccording to my experience gold will big fall brother
    EuroTrader flag
    JABO GOLD TRADER
    @EuroTraderaccording to my experience gold will big fall brother
    @JABO GOLD TRADER That's good, do you have any fundamentals backing this up?
    EuroTrader flag
    JABO GOLD TRADER
    @EuroTraderaccording to my experience gold will big fall brother
    @JABO GOLD TRADER I believe people take a look at the fundamentals too and not just technicals, what do you think?
    JABO GOLD TRADER flag
    gold vip signal group available guys
    JABO GOLD TRADER flag
    gold vip signal room available guys
    john flag
    this might give the market the reason to buy tomorrow
    john flag
    Type here...
    Add Symbol or Code

      No matching data

      All
      Recommend
      Stocks
      Cryptocurrencies
      Central Banks
      Trump Updates
      Featured News
      • All
      • Russia-Ukraine Conflict
      • Middle East Flashpoint
      • All
      • Russia-Ukraine Conflict
      • Middle East Flashpoint
      Search
      Products

      Charts Free Forever

      Chats Q&A with Experts
      Screeners Economic Calendar Data Tools
      Membership Features
      Data Warehouse Market Trends Institutional Data Policy Rates Macro

      Market Trends

      Market Sentiment Order Book Forex Correlations

      Top Indicators

      Charts Free Forever
      Markets

      News

      24/7 Analysis Education

      Latest Views

      Latest Update

      Signals

      Copy Rankings Latest Signals Become a signal provider AI Rating
      Contests
      Brokers

      Overview Brokers Assessment Rankings Regulators News Claims
      Broker listing Forex Brokers Comparison Tool Live Spread Comparison Scam
      Q&A Complaint Scam Alert Videos Tips to Detect Scam
      More

      Business
      Events
      Careers About Us Advertising Help Center

      White Label

      Broker API

      Data API

      Web Plug-ins

      Affiliate Program

      Awards Institution Evaluation IB Seminar Salon Event Exhibition
      Vietnam Thailand Singapore Dubai
      Fans Party Investment Sharing Session
      FastBull Summit BrokersView Expo
      Recent Searches
        Top Searches
          Markets
          Analysis
          User
          24/7
          Economic Calendar
          Education
          Data
          • Names
          • Latest
          • Prev

          View All

          No data

          Scan to Download

          Faster Charts, Chat Faster!

          Download App
          English
          • English
          • Español
          • العربية
          • Bahasa Indonesia
          • Bahasa Melayu
          • Tiếng Việt
          • ภาษาไทย
          • Français
          • Italiano
          • Türkçe
          • Русский язык
          • 简中
          • 繁中
          Open Account
          Search
          Products
          Charts Free Forever
          Markets
          News
          Signals

          Copy Rankings Latest Signals Become a signal provider AI Rating
          Contests
          Brokers

          Overview Brokers Assessment Rankings Regulators News Claims
          Broker listing Forex Brokers Comparison Tool Live Spread Comparison Scam
          Q&A Complaint Scam Alert Videos Tips to Detect Scam
          More

          Business
          Events
          Careers About Us Advertising Help Center

          White Label

          Broker API

          Data API

          Web Plug-ins

          Affiliate Program

          Awards Institution Evaluation IB Seminar Salon Event Exhibition
          Vietnam Thailand Singapore Dubai
          Fans Party Investment Sharing Session
          FastBull Summit BrokersView Expo

          Elements of Fundamental Analysis: 3 Key Components for Investors

          zhan chen
          Summary:

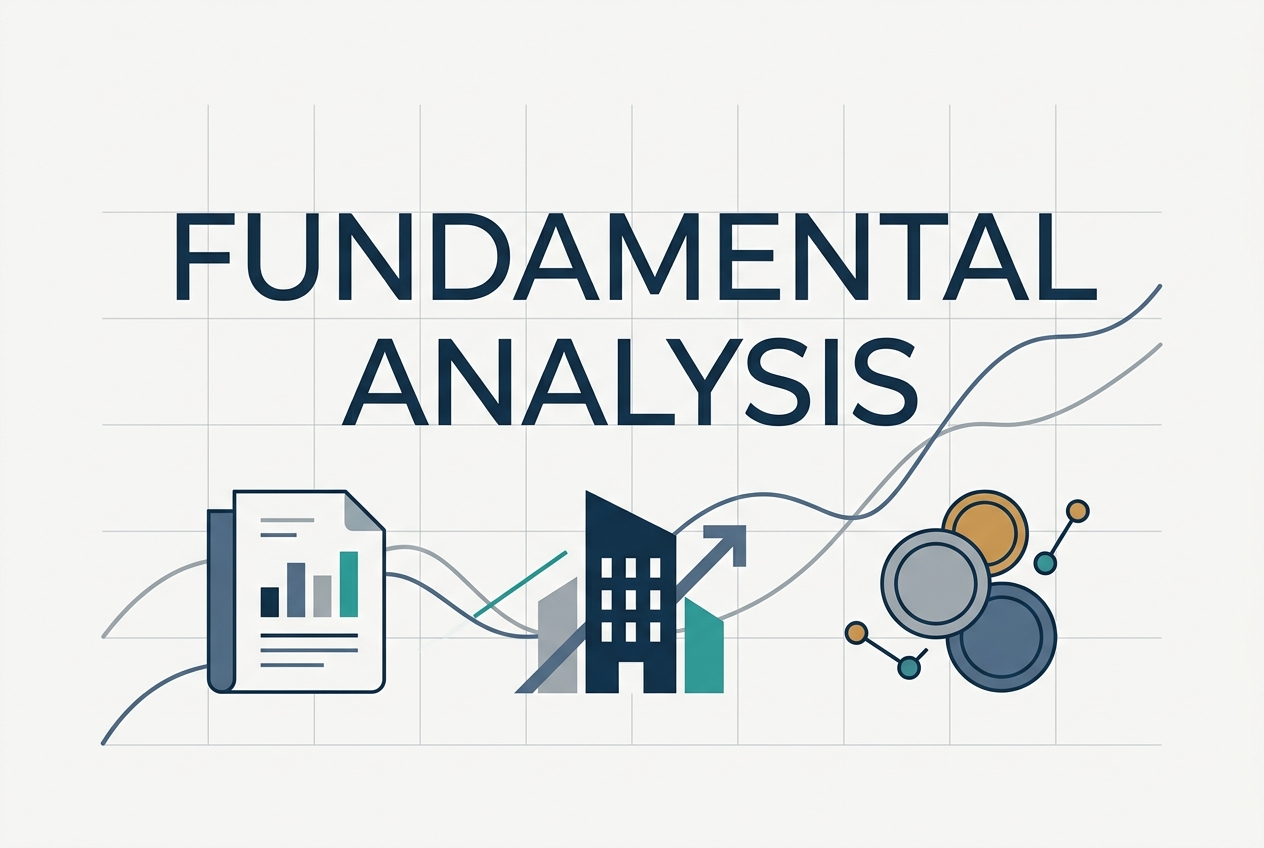
          Master the elements of fundamental analysis to find intrinsic value. We synthesize quantitative metrics, qualitative moats, and macroeconomic trends.

          Navigating the stock market requires more than just reacting to daily price movements; it demands a structured method for uncovering a company's true worth. Fundamental analysis provides investors with a rigorous framework to separate market noise from underlying business reality. By examining a blend of financial metrics, intangible business strengths, and macroeconomic conditions, investors can systematically assess whether an asset is mispriced. This guide explores these core components, how they interact within practical valuation models, and the optimal sequence for applying them across different investment strategies.

          Elements of Fundamental Analysis: 3 Key Components for Investors

          What Are the Key Dimensions of Fundamental Analysis?

          The three components of fundamental analysis divide the evaluation of a company’s intrinsic value into measurable financial performance, intangible business advantages, and broader macroeconomic conditions. Together, these elements form a comprehensive framework used in investment management to separate current market price from underlying business reality.

          Qualitative Factors: What the Numbers Can't Tell You

          Qualitative factors assess the sustainability of a company's competitive advantage and the integrity of its leadership. While these elements lack direct numerical values, they dictate whether historical revenue and profit margins will persist into the future. Analysts structure qualitative assessments around three distinct areas:

          • Economic Moats: Coined by Warren Buffett and standardized by Morningstar's methodology, a moat represents structural advantages that prevent competitors from eroding market share. These manifest as high switching costs (e.g., enterprise software integration), network effects (e.g., global payment processors), or intangible assets like patents and regulatory monopolies.
          • Corporate Governance: Analysts evaluate the board of directors and executive compensation structures to verify alignment with shareholder interests. Strong governance features high insider equity ownership and executive bonuses tied to Return on Invested Capital (ROIC) rather than sheer revenue volume.
          • Business Model Resilience: A firm's vulnerability to disruption dictates its risk profile. A company generating recurring subscription revenue carries structurally lower qualitative risk than one reliant on cyclical hardware sales, even if their current earnings match.

          Quantitative Factors: Reading Financial Statements and Ratios

          Quantitative analysis derives a company's financial health and valuation directly from its SEC filings (10-K and 10-Q). This is the mechanical core of the process, requiring analysts to extract raw data from the three primary financial statements and convert it into standardized metrics for cross-industry comparison. Locating the best undervalued stocks to buy now relies heavily on identifying disconnects between these calculated ratios and current market pricing.

          Financial StatementPrimary FunctionKey Valuation & Efficiency Ratios
          Income StatementTracks revenue, operating expenses, and net profitability over a specific period.Price-to-Earnings (P/E), Gross Margin, Earnings Per Share (EPS).
          Balance SheetSnapshots total assets, liabilities, and shareholder equity at an exact point in time.Debt-to-Equity (D/E), Price-to-Book (P/B), Return on Equity (ROE).
          Cash Flow StatementReconciles net income to actual cash entering and exiting the business operations.Free Cash Flow (FCF) Yield, Price-to-Free-Cash-Flow (P/FCF).

          Ratios carry no weight in a vacuum. A historically low P/E ratio might indicate a mispriced bargain, or it might signal a value trap where earnings are structurally deteriorating. Rigorous quantitative analysis requires tracking these metrics across a 5-to-10-year horizon to smooth out cyclical anomalies and isolate genuine growth or decline.

          Economic and Market Context: Why the Bigger Picture Matters

          Changes in macroeconomic conditions directly dictate corporate profitability and the valuation multiples investors are willing to pay for future earnings. A company does not operate independently of its environment; external variables routinely override strong internal execution.

          The risk-free rate—typically the 10-year U.S. Treasury yield—anchors the weighted average cost of capital (WACC) for every public company. As interest rates rise, the discount rate applied to a company's future cash flows increases. This mechanism mathematically compresses equity valuations, hitting high-growth technology companies hardest because the bulk of their projected cash flows sit years in the future.

          Inflationary pressure forces analysts to evaluate pricing power. Companies with inelastic demand can pass rising supply chain and labor costs to consumers, defending their gross margins. Conversely, highly commoditized businesses must absorb the costs, suffering immediate margin compression.

          Sector life cycles also constrain individual company ceilings. Investors screening for the best dividend stocks to buy now for long term holding naturally gravitate toward mature, low-growth sectors like utilities or consumer staples, which offer stable, counter-cyclical cash flows. Alternatively, analyzing growth equities requires mapping the expansion of the Total Addressable Market (TAM) within emerging industries, where macroeconomic secular tailwinds provide a runway for prolonged revenue expansion.

          How Do These Elements Work Together in Practice?

          The three components of fundamental analysis do not operate in isolation; rather, they are applied across different levels of the market—typically categorized into economic, industry, and company evaluations. They form a sequential analytical funnel that filters macroeconomic reality down to individual corporate cash flows. Analysts typically integrate these elements using a top-down approach, moving from global aggregate demand down to specific equities, or a bottom-up approach, identifying structurally sound businesses and stress-testing them against macro and sector headwinds.

          Combining These Dimensions to Assess a Stock's True Value

          Assessing intrinsic value requires translating qualitative research across the three elements into quantitative model inputs. A dominant company operating in a high-growth sector will still destroy shareholder wealth if macroeconomic contraction crushes its end-market demand or raises its cost of debt to unsustainable levels.

          The convergence of these distinct variables generally takes place within a Discounted Cash Flow (DCF) model. To accurately calculate intrinsic value, an analyst must isolate how each fundamental element alters specific mathematical assumptions.

          Analysis ElementPrimary Analytical FocusDirect Impact on Valuation Model
          MacroeconomicInterest rates, inflation, GDP growth, currency strengthDictates the risk-free rate and equity risk premium, directly forming the Weighted Average Cost of Capital (WACC).
          IndustryTotal Addressable Market (TAM), competitive rivalry, regulatory environmentDefines the terminal growth rate ceiling and limits the duration of a company's competitive advantage period.
          CompanyPricing power, cost structure, capital allocation efficiencyDetermines operating margin forecasts, actual Free Cash Flow (FCF) generation, and Return on Invested Capital (ROIC).

          If a stock's modeled intrinsic value is significantly higher than its current market price—and the analyst has rigorously tested the assumptions across all three dimensions—it presents a margin of safety. This synthesis is exactly how institutional investors screen for the best undervalued stocks to buy now.

          A Simple Example: Applying the Framework to a Real Company

          Consider how an equity analyst applies this framework to Microsoft (MSFT) to determine whether the stock is trading at a discount or a premium. The analysis moves systematically through the top-down layers to build a cohesive thesis.

          1. Macroeconomic Layer: With central bank policy rates hovering around 5%, the risk-free rate is elevated compared to the previous decade. This macro reality increases Microsoft's discount rate, meaning its future cash flows are penalized more heavily in today's terms. However, strong corporate capital expenditure metrics across the broader economy signal that enterprise buyers are not freezing their tech budgets.
          2. Industry Layer: The cloud infrastructure and generative AI markets feature massive barriers to entry. Because scaling server architecture is highly capital-intensive, the threat of new entrants under Porter's Five Forces is strictly limited. The analyst projects the industry's Total Addressable Market will compound at a double-digit rate over the next five years, providing structural tailwinds independent of the broader economy.
          3. Company Layer: Microsoft leverages its deep enterprise software lock-in to maintain robust pricing power. The company consistently converts industry tailwinds into actual profit, generating operating margins above 40% and producing tens of billions in annual free cash flow. Management's aggressive reinvestment in AI capabilities demonstrates high return on invested capital.

          To reach a final decision, the analyst aggregates these findings. The macro environment dictates a stricter WACC, acting as a downward force on valuation. However, the industry's oligopolistic structure and the company's elite operating margins provide enough cash flow expansion to offset the macro drag. By feeding these precise margin and discount rate adjustments into a model, the analyst establishes a price target grounded in integrated evidence rather than isolated metrics.

          Which Dimension Should You Focus on First as an Investor?

          While integrating these dimensions is crucial for a final valuation, the order in which you evaluate them can streamline the research process. Sequencing the elements of fundamental analysis depends entirely on the company's lifecycle stage, its industry structure, and your specific screening strategy. Quantitative data leads when filtering broad universes for mature, cash-generating assets, while qualitative factors must precede financial modeling when evaluating early-stage growth, binary outcomes, or structural turnarounds.

          Choosing the wrong starting point results in analytical dead ends. Running a discounted cash flow (DCF) model on a pre-revenue startup yields arbitrary valuations, just as assessing the brand power of a regional bank is useless without first verifying its Tier 1 capital ratios.

          Sequencing Fundamental Analysis: Quant-First vs. Qual-First

          Investment StrategyOptimal Starting DimensionPrimary Catalyst for ReturnsKey First-Pass Focus Areas
          Value / Deep ValueQuantitativeMargin reversion, asset liquidationP/B < 1, FCF yield, Debt-to-Equity
          Dividend GrowthQuantitativePayout sustainability, yield compoundingPayout ratio, Interest coverage > 5x
          Venture / Hyper-GrowthQualitativeMarket capture, product commercializationTotal Addressable Market (TAM), IP
          Biotech / PharmaQualitativeRegulatory approval, patent defenseFDA Phase data, pipeline depth

          When Qualitative Factors Should Lead Your Analysis

          Begin with qualitative analysis when a company's current financial statements do not accurately reflect its future earnings power. In industries undergoing rapid technological shifts or companies in early commercialization stages, historical trailing twelve-month (TTM) data is a lagging indicator that obscures the actual investment thesis.

          In these scenarios, the primary risk is not valuation multiple compression, but business model obsolescence or failure to reach scale. You must establish the structural viability of the enterprise before projecting its cash flows.

          • Binary Regulatory Outcomes: In the biotechnology and pharmaceutical sectors, the balance sheet is secondary to the pipeline. Assessing FDA Phase 2 or 3 clinical trial efficacy, patent exclusivity windows, and the competitive landscape for specific therapeutic indications dictates the probability of future revenue.
          • Disruptive Technologies and Moat-Building: When evaluating early-stage software or hardware platforms, current net income is often negative due to high customer acquisition costs. Analysis must start with qualitative metrics: switching costs, ecosystem lock-in, and network effects. A high gross retention rate in a SaaS business signals product-market fit long before the operating margin turns positive.
          • Management Turnarounds and Governance: If a mature company has suffered chronic underperformance, the thesis hinges entirely on capital allocation shifts. Evaluating a new CEO’s track record of cost rationalization or divestitures provides the basis for forecasting future margin expansion.

          When Quantitative Data Is the Better Starting Point

          Quantitative data acts as the mandatory first filter when evaluating mature industries, asset-heavy businesses, and established dividend payers where historical financial mechanics reliably dictate baseline survival and future stability. In these categories, qualitative narratives often distract from deteriorating balance sheets or systemic overvaluation.

          By leading with hard metrics, you eliminate companies structurally incapable of meeting your hurdle rates, reducing a universe of thousands of equities down to a manageable shortlist.

          • Value Screening: Searching for the best undervalued stocks to buy now requires programmatic filtering. A quantitative screener set for a Price-to-Book (P/B) ratio under 1.2, Return on Invested Capital (ROIC) above 15%, and debt-to-equity below 0.5 instantly removes businesses destroying shareholder value. Only after this mathematical baseline is established does qualitative moat analysis begin.
          • Yield Strategies: For investors structuring portfolios around the best dividend stocks to buy now for long term compounding, the initial analysis is purely defensive math. The starting points are payout ratios below 60%, consecutive years of dividend growth, and Free Cash Flow (FCF) comfortably exceeding dividend obligations. A strong brand cannot sustain a dividend if operating cash flow structurally declines.
          • Commodity and Financial Sectors: In highly regulated or commoditized markets, financial ratios define the competitive edge. You cannot evaluate a regional bank’s qualitative market position without first dissecting its net interest margin (NIM), loan-to-deposit ratio, and non-performing loan provisions. Similarly, analyzing an energy producer starts with its break-even cost per barrel—if this figure sits above current macroeconomic spot prices, the qualitative strategy is irrelevant.

          What Are the Limitations of Fundamental Analysis Investors Should Know?

          Even when applied in the optimal sequence, however, this analytical framework is not foolproof. Fundamental analysis maps intrinsic value, but it carries four structural weaknesses: it relies on backward-looking data, generates valuations highly sensitive to subjective assumptions, distorts modern intangible assets, and completely ignores market timing.

          While mastering the key elements of fundamental analysis is non-negotiable for long-term capital allocation, relying on it exclusively exposes investors to the following blind spots:

          • Structural Data Lag: Markets price assets based on forward expectations, yet fundamental metrics rely on historical reporting. Public companies have up to 45 days after a quarter ends to file a 10-Q. By the time an analyst processes the balance sheet, macroeconomic variables—such as benchmark interest rates, supply chain disruptions, or commodity spikes—may have fundamentally altered the company's operating reality.
          • The Illusion of Precision in Valuation Models: Discounted Cash Flow (DCF) models project mathematical certainty but rest on highly subjective inputs. The terminal value calculation routinely accounts for 60% to 80% of a company’s total projected intrinsic value. Modifying the Weighted Average Cost of Capital (WACC) or the perpetual growth rate by just 50 basis points can swing a stock's target price by 20% or more. This sensitivity allows analysts to easily reverse-engineer models to justify preexisting biases.
          • Blind Spots in Modern Accounting Rules: Strict reliance on Generally Accepted Accounting Principles (GAAP) can distort the valuation of asset-light, knowledge-based companies. Because GAAP mandates that internal Research and Development (R&D) be expensed immediately rather than capitalized, near-term earnings for software and biotech firms are often artificially depressed. Consequently, traditional fundamental valuation tools like the Price-to-Book (P/B) ratio lose predictive power when evaluating firms whose primary assets are intellectual property rather than physical infrastructure.
          • The Value Trap and Timing Disconnect: Fundamental analysis dictates what to buy, but provides zero mechanical guidance on when to execute the trade. A company trading at a deep discount to its intrinsic value can languish in that state for years without a distinct catalyst—such as a management change, activist intervention, or dividend initiation—to force price discovery. Because fundamental metrics cannot quantify institutional fund flows, momentum, or shifts in retail sentiment, they offer limited protection against sustained market irrationality.

          FAQs about elements of fundamental analysis

          What are the key elements of fundamental analysis?

          Fundamental analysis evaluates an asset's intrinsic value by examining three main categories of data. Quantitative elements involve analyzing financial statements, such as balance sheets and income statements, to measure a company's historical profitability and financial health. Qualitative elements focus on non-numerical factors like management quality and competitive advantage, while macroeconomic elements assess broader factors like interest rates, GDP, and industry trends.

          What are the 5 key principles of fundamental analysis?

          The five key principles begin with analyzing financial statements to evaluate a company's overall health and performance. Next, analysts evaluate broader economic conditions and assess the competence of the company's management team. Finally, the approach requires understanding market sentiment and applying valuation techniques to determine if an asset is overvalued or undervalued.

          What is the difference between qualitative and quantitative fundamental analysis?

          Quantitative fundamental analysis relies on objective, measurable data such as revenue, return on equity, and price-to-earnings ratios found in financial statements. In contrast, qualitative analysis evaluates subjective, non-numerical factors that influence a company's long-term success. These qualitative factors often include brand loyalty, competitive advantage, corporate governance, and the strength of the business model.

          What are the three levels of top-down fundamental analysis?

          The top-down approach to fundamental analysis follows a three-step framework known as EIC: Economy, Industry, and Company. It starts with an economic analysis to evaluate broad macroeconomic factors like GDP, inflation, and interest rates. Analysts then conduct an industry analysis to identify sectors positioned for growth, followed by a company analysis to select individual stocks with strong fundamentals within those promising sectors.

          Conclusion

          Mastering the components of fundamental analysis equips investors with a reliable system for identifying mispriced assets and navigating complex market environments. By synthesizing quantitative financial data, qualitative business strengths, and macroeconomic trends, you can ground your investment decisions in measurable reality rather than speculation. While this methodology carries inherent limitations—such as relying on lagging historical data and offering no market timing guidance—it remains a robust defense against value traps and emotional trading. Applying these analytical dimensions systematically ensures a more disciplined, evidence-based approach to long-term capital allocation.

          Risk Warnings and Disclaimers
          You understand and acknowledge that there is a high degree of risk involved in trading. Following any strategies or investment methods may lead to potential losses. The content on the site is provided by our contributors and analysts for information purposes only. You are solely responsible for determining whether any trading assets, securities, strategy, or any other product is suitable for investing based on your own investment objectives and financial situation.
          Add to Favorites
          Share
          FastBull
          Copyright © 2026 FastBull Ltd

          728 RM B 7/F GEE LOK IND BLDG NO 34 HUNG TO RD KWUN TONG KLN HONG KONG

          TelegramInstagramTwitterfacebooklinkedin
          App Store Google Play Google Play
          Products
          Charts

          Chats

          Q&A with Experts
          Screeners
          Economic Calendar
          Data
          Tools
          Membership
          Features
          Function
          Markets
          Copy Trading
          Latest Signals
          Contests
          24/7
          Analysis
          Education
          Company
          Careers
          About Us
          Contact Us
          Advertising
          Help Center
          Feedback
          User Agreement
          Privacy Policy
          Personal Information Protection Statement
          Business

          White Label

          Broker API

          Data API

          Web Plug-ins

          Poster Maker

          Affiliate Program

          Risk Disclosure

          The risk of loss in trading financial instruments such as stocks, FX, commodities, futures, bonds, ETFs and crypto can be substantial. You may sustain a total loss of the funds that you deposit with your broker. Therefore, you should carefully consider whether such trading is suitable for you in light of your circumstances and financial resources.

          No decision to invest should be made without thoroughly conducting due diligence by yourself or consulting with your financial advisors. Our web content might not suit you since we don't know your financial conditions and investment needs. Our financial information might have latency or contain inaccuracy, so you should be fully responsible for any of your trading and investment decisions. The company will not be responsible for your capital loss.

          Without getting permission from the website, you are not allowed to copy the website's graphics, texts, or trademarks. Intellectual property rights in the content or data incorporated into this website belong to its providers and exchange merchants.

          Not Logged In

          Log in to access more features

          Connect Broker
          Become a signal provider
          Help Center
          Customer Service
          Dark Mode
          Price Up/Down Colors

          Log In

          Sign Up

          Position
          Layout
          Fullscreen
          Default to Chart
          The chart page opens by default when you visit fastbull.com