• Trade
  • Markets
  • Copy
  • Contests
  • News
  • 24/7
  • Calendar
  • Q&A
  • Chats
Trending
Screeners
SYMBOL
LAST
BID
ASK
HIGH
LOW
NET CHG.
%CHG.
SPREAD
SPX
S&P 500 Index
6870.39
6870.39
6870.39
6895.79
6858.28
+13.27
+ 0.19%
--
DJI
Dow Jones Industrial Average
47954.98
47954.98
47954.98
48133.54
47871.51
+104.05
+ 0.22%
--
IXIC
NASDAQ Composite Index
23578.12
23578.12
23578.12
23680.03
23506.00
+72.99
+ 0.31%
--
USDX
US Dollar Index
98.950
99.030
98.950
99.060
98.740
-0.030
-0.03%
--
EURUSD
Euro / US Dollar
1.16426
1.16443
1.16426
1.16715
1.16277
-0.00019
-0.02%
--
GBPUSD
Pound Sterling / US Dollar
1.33312
1.33342
1.33312
1.33622
1.33159
+0.00041
+ 0.03%
--
XAUUSD
Gold / US Dollar
4197.91
4197.91
4197.91
4259.16
4191.87
-9.26
-0.22%
--
WTI
Light Sweet Crude Oil
59.809
60.061
59.809
60.236
59.187
+0.426
+ 0.72%
--

Community Accounts

Signal Accounts
--
Profit Accounts
--
Loss Accounts
--
View More

Become a signal provider

Sell trading signals to earn additional income

View More

Guide to Copy Trading

Get started with ease and confidence

View More

Signal Accounts for Members

All Signal Accounts

Best Return
  • Best Return
  • Best P/L
  • Best MDD
Past 1W
  • Past 1W
  • Past 1M
  • Past 1Y

All Contests

  • All
  • Trump Updates
  • Recommend
  • Stocks
  • Cryptocurrencies
  • Central Banks
  • Featured News
Top News Only
Share

Government Spokesperson: Fourteen Arrested Over Benin Coup Attempt

Share

French President Macron: Nigeria Seeks French Help To Combat Insecurity

Share

Industry Source: EU Commission May Announce Package To Support Auto Industry On December 16

Share

Israel Foreign Currency Reserves $231.425 Billion In November Versus$231.954 Billion In October -Bank Of Israel

Share

[Moodeng Surges Over 43% In The Last 24 Hours, With A Current Market Cap Of $104 Million.] December 7Th, According To Gmgn Market Data, The Solana-Based Meme Coin Moodeng Surged Over 43% In The Past 24 Hours, With A Market Capitalization Currently Standing At 104 Million USD

Share

Jerusalem-German Chancellor Merz: We Have Not Discussed A Visit To Germany By Israeli Prime Minister Benjamin Netanyahu, Not An Issue At The Moment

Share

Israeli Prime Minister Netanyahu: We're Close To The Second Phase Of Trump's Gaza Plan

Share

West Africa's ECOWAS Bloc: 'Strongly Condemns' Attempted Military Coup In Benin

Share

Israeli Prime Minister Netanyahu: Political Annexation Of The West Bank Remains A Subject Of Discussion

Share

Israeli Prime Minister Netanyahu: Sovereign Power Of Security From The Jordan River To The Mediterranean Will Always Remain In Israel's Hands

Share

Israeli Prime Minister Netanyahu: We Believe There Is A Path To A Workable Peace With Our Palestinian Neighbors

Share

Israeli Prime Minister Netanyahu: I Will Meet Trump This Month

Share

Egypt's Net Foreign Reserves Rise To $50.216 Billion In November From $50.071 Billion In October

Share

Uganda Opposition Candidate Says He Was Beaten By Security Forces

Share

Benin's Foreign Minister Bakari:Large Part Of The Army And National Guard Still Loyalist And Are Controlling The Situation

Share

Russian Defence Ministry: Russian Troops Complete Capture Of Rivne In Ukraine's Donetsk Region

Share

Russian Defence Ministry: Russian Troops Carried Out Group Strike Overnight On Ukraine's Transport Infrastructure Facilities, Fuel And Energy Complexes, And Long-Range Drone Complexes

Share

Russian Defence Ministry: Russian Forces Capture Kucherivka In Ukraine's Kharkiv Region

Share

US Envoy Kellogg Says Ukraine Peace Deal Is Really Close

Share

US Embassy In India- US Under Secretary Of State For Political Affairs Allison Hooker Will Visit New Delhi And Bengaluru, India, From December 7 To 11

TIME
ACT
FCST
PREV
Euro Zone Employment YoY (SA) (Q3)

A:--

F: --

P: --

Euro Zone GDP Final YoY (Q3)

A:--

F: --

P: --

Euro Zone GDP Final QoQ (Q3)

A:--

F: --

P: --

Euro Zone Employment Final QoQ (SA) (Q3)

A:--

F: --

P: --

Euro Zone Employment Final (SA) (Q3)

A:--

F: --

P: --
Brazil PPI MoM (Oct)

A:--

F: --

P: --

Mexico Consumer Confidence Index (Nov)

A:--

F: --

P: --

Canada Unemployment Rate (SA) (Nov)

A:--

F: --

P: --

Canada Labor Force Participation Rate (SA) (Nov)

A:--

F: --

P: --

Canada Employment (SA) (Nov)

A:--

F: --

P: --

Canada Part-Time Employment (SA) (Nov)

A:--

F: --

P: --

Canada Full-time Employment (SA) (Nov)

A:--

F: --

P: --

U.S. Personal Income MoM (Sept)

A:--

F: --

P: --

U.S. PCE Price Index YoY (SA) (Sept)

A:--

F: --

P: --

U.S. PCE Price Index MoM (Sept)

A:--

F: --

P: --

U.S. Personal Outlays MoM (SA) (Sept)

A:--

F: --

P: --

U.S. Core PCE Price Index MoM (Sept)

A:--

F: --

P: --

U.S. Core PCE Price Index YoY (Sept)

A:--

F: --

P: --

U.S. UMich 5-Year-Ahead Inflation Expectations Prelim YoY (Dec)

A:--

F: --

P: --

U.S. Real Personal Consumption Expenditures MoM (Sept)

A:--

F: --

P: --

U.S. 5-10 Year-Ahead Inflation Expectations (Dec)

A:--

F: --

P: --

U.S. UMich Current Economic Conditions Index Prelim (Dec)

A:--

F: --

P: --

U.S. UMich Consumer Sentiment Index Prelim (Dec)

A:--

F: --

P: --

U.S. UMich 1-Year-Ahead Inflation Expectations Prelim (Dec)

A:--

F: --

P: --

U.S. UMich Consumer Expectations Index Prelim (Dec)

A:--

F: --

P: --

U.S. Weekly Total Rig Count

A:--

F: --

P: --

U.S. Weekly Total Oil Rig Count

A:--

F: --

P: --

U.S. Unit Labor Cost Prelim (SA) (Q3)

--

F: --

P: --

U.S. Consumer Credit (SA) (Oct)

A:--

F: --

P: --

China, Mainland Foreign Exchange Reserves (Nov)

A:--

F: --

P: --

China, Mainland Exports YoY (USD) (Nov)

--

F: --

P: --

China, Mainland Imports YoY (CNH) (Nov)

--

F: --

P: --

China, Mainland Imports YoY (USD) (Nov)

--

F: --

P: --

China, Mainland Imports (CNH) (Nov)

--

F: --

P: --

China, Mainland Trade Balance (CNH) (Nov)

--

F: --

P: --

China, Mainland Exports (Nov)

--

F: --

P: --

Japan Wages MoM (Oct)

--

F: --

P: --

Japan Trade Balance (Oct)

--

F: --

P: --

Japan Nominal GDP Revised QoQ (Q3)

--

F: --

P: --

Japan Trade Balance (Customs Data) (SA) (Oct)

--

F: --

P: --

Japan GDP Annualized QoQ Revised (Q3)

--

F: --

P: --
China, Mainland Exports YoY (CNH) (Nov)

--

F: --

P: --

China, Mainland Trade Balance (USD) (Nov)

--

F: --

P: --

Germany Industrial Output MoM (SA) (Oct)

--

F: --

P: --

Euro Zone Sentix Investor Confidence Index (Dec)

--

F: --

P: --

Canada Leading Index MoM (Nov)

--

F: --

P: --

Canada National Economic Confidence Index

--

F: --

P: --

U.S. Dallas Fed PCE Price Index YoY (Sept)

--

F: --

P: --

U.S. 3-Year Note Auction Yield

--

F: --

P: --

U.K. BRC Overall Retail Sales YoY (Nov)

--

F: --

P: --

U.K. BRC Like-For-Like Retail Sales YoY (Nov)

--

F: --

P: --

Australia Overnight (Borrowing) Key Rate

--

F: --

P: --

RBA Rate Statement
RBA Press Conference
Germany Exports MoM (SA) (Oct)

--

F: --

P: --

U.S. NFIB Small Business Optimism Index (SA) (Nov)

--

F: --

P: --

Mexico Core CPI YoY (Nov)

--

F: --

P: --

Mexico 12-Month Inflation (CPI) (Nov)

--

F: --

P: --

Mexico PPI YoY (Nov)

--

F: --

P: --

Mexico CPI YoY (Nov)

--

F: --

P: --

U.S. Weekly Redbook Index YoY

--

F: --

P: --

Q&A with Experts
    • All
    • Chatrooms
    • Groups
    • Friends
    Connecting
    .
    .
    .
    Type here...
    Add Symbol or Code

      No matching data

      All
      Trump Updates
      Recommend
      Stocks
      Cryptocurrencies
      Central Banks
      Featured News
      • All
      • Russia-Ukraine Conflict
      • Middle East Flashpoint
      • All
      • Russia-Ukraine Conflict
      • Middle East Flashpoint
      Search
      Products

      Charts Free Forever

      Chats Q&A with Experts
      Screeners Economic Calendar Data Tools
      Membership Features
      Data Warehouse Market Trends Institutional Data Policy Rates Macro

      Market Trends

      Market Sentiment Order Book Forex Correlations

      Top Indicators

      Charts Free Forever
      Markets

      News

      News Analysis 24/7 Columns Education
      From Institutions From Analysts
      Topics Columnists

      Latest Views

      Latest Views

      Trending Topics

      Top Columnists

      Latest Update

      Signals

      Copy Rankings Latest Signals Become a signal provider AI Rating
      Contests
      Brokers

      Overview Brokers Assessment Rankings Regulators News Claims
      Broker listing Forex Brokers Comparison Tool Live Spread Comparison Scam
      Q&A Complaint Scam Alert Videos Tips to Detect Scam
      More

      Business
      Events
      Careers About Us Advertising Help Center

      White Label

      Data API

      Web Plug-ins

      Affiliate Program

      Awards Institution Evaluation IB Seminar Salon Event Exhibition
      Vietnam Thailand Singapore Dubai
      Fans Party Investment Sharing Session
      FastBull Summit BrokersView Expo
      Recent Searches
        Top Searches
          Markets
          News
          Analysis
          User
          24/7
          Economic Calendar
          Education
          Data
          • Names
          • Latest
          • Prev

          View All

          No data

          Scan to Download

          Faster Charts, Chat Faster!

          Download App
          English
          • English
          • Español
          • العربية
          • Bahasa Indonesia
          • Bahasa Melayu
          • Tiếng Việt
          • ภาษาไทย
          • Français
          • Italiano
          • Türkçe
          • Русский язык
          • 简中
          • 繁中
          Open Account
          Search
          Products
          Charts Free Forever
          Markets
          News
          Signals

          Copy Rankings Latest Signals Become a signal provider AI Rating
          Contests
          Brokers

          Overview Brokers Assessment Rankings Regulators News Claims
          Broker listing Forex Brokers Comparison Tool Live Spread Comparison Scam
          Q&A Complaint Scam Alert Videos Tips to Detect Scam
          More

          Business
          Events
          Careers About Us Advertising Help Center

          White Label

          Data API

          Web Plug-ins

          Affiliate Program

          Awards Institution Evaluation IB Seminar Salon Event Exhibition
          Vietnam Thailand Singapore Dubai
          Fans Party Investment Sharing Session
          FastBull Summit BrokersView Expo

          World Will Overshoot 1.5C Climate Goal, UN Says

          Devin

          Economic

          Summary:

          By Kate Abnett and Simon Jessop SAO PAULO (Reuters) -The world has failed to meet its main climate change target of limiting the rise in global temperatures to 1.5 degrees Celsius, and will likely br...

          The world has failed to meet its main climate change target of limiting the rise in global temperatures to 1.5 degrees Celsius, and will likely breach this threshold in the next decade, the United Nations' Environment Programme said on Tuesday.

          The annual Emissions Gap report said because of countries' slow action to reduce planet-heating greenhouse gas emissions, it was now clear that the world would exceed the core target of the 2015 Paris Agreement - at least temporarily.

          "This will be difficult to reverse – requiring faster and bigger additional reductions in greenhouse gas emissions to minimize overshoot," UNEP said.

          'WE CAN NO LONGER TOTALLY AVOID IT'

          Lead report author Anne Olhoff said deep emissions cuts now could delay when the overshoot happens, "but we can no longer totally avoid it".

          The 2015 Paris Agreement commits countries to limit the global average temperature rise to 2°C above pre-industrial levels, and to aim for 1.5°C.

          Yet governments' latest pledges to cut emissions in future, if met, would see the world face 2.3-2.5°C of warming, UNEP said.

          That's around 0.3°C less warming than the U.N.'s projection a year ago - indicating that new emissions-cutting plans announced this year by countries including top CO2 emitter China have failed to substantially close the gap.

          China pledged in September to cut emissions by 7-10% from their peak by 2035. Analysts note the country tends to set modest targets and exceed them.

          FINDINGS ADD PRESSURE TO COP30 CLIMATE SUMMIT

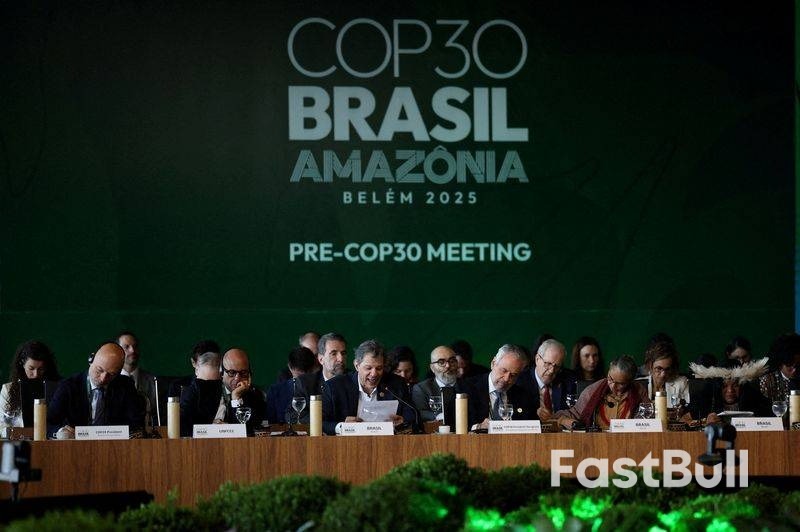
          The findings add pressure to the U.N.'s COP30 climate summit this month, where countries will debate how to kick-start and finance faster action to rein in global warming.

          The Paris Agreement temperature goals were based on scientific assessments of how each increment of global warming fuels worse heatwaves, droughts and wildfires. For example, 2°C of warming would more than double the share of the population exposed to extreme heat, compared with 1.5°C . Warming of 1.5°C would destroy at least 70% of coral reefs, versus 99% at 2°C.

          Current policies - the ones countries already have in place - would lead to even more warming, of around 2.8°C, UNEP said.

          The world has made some progress. A decade ago, when the Paris Agreement was signed, the planet was on course for around a 4°C temperature rise.

          But heat-trapping CO2 emissions continue to rise, as countries burn coal, oil and gas to power their economies.

          Global greenhouse gas emissions increased by 2.3% in 2024, to 57.7 gigatonnes of CO2 equivalent, UNEP said.

          Source: Investing

          To stay updated on all economic events of today, please check out our Economic calendar
          Risk Warnings and Disclaimers
          You understand and acknowledge that there is a high degree of risk involved in trading. Following any strategies or investment methods may lead to potential losses. The content on the site is provided by our contributors and analysts for information purposes only. You are solely responsible for determining whether any trading assets, securities, strategy, or any other product is suitable for investing based on your own investment objectives and financial situation.
          Add to Favorites
          Share

          Democratic Louisiana Mayor Indicted For Using City Funds To Solicit Prostitute, Pay Off Personal Legal Debts

          Winkelmann

          Political

          Economic

          A Washington Parish grand jury in Louisiana has indicted Democratic Bogalusa, Louisiana Mayor Tyrin Z. Truong on charges of malfeasance in office, public intimidation, and theft, according to the Bogalusa Daily News.

          The indictment is part of what officials describe as an ongoing multi-agency investigation involving federal, state, and local authorities. Prosecutors allege Truong intentionally carried out his official duties unlawfully and knowingly allowed other city employees to ignore theirs. His arraignment is scheduled for November 10, 2025.

          According to prosecutors, the case centers on claims that Truong misused Bogalusa taxpayer funds to pay a personal legal debt from a 2023 Louisiana public records lawsuit in which a judge ruled that Truong personally owed attorney fees and penalties after refusing to release public documents.

          When the Bogalusa City Council denied his request to use public money, prosecutors say Truong threatened retaliation, vowing to overwhelm council members with records requests. Investigators allege he then pressured a city insurance vendor to issue a check labeled as a "reimbursement," had it deposited into a city account, and ordered another check for the same amount to be written to himself.

          The Daily News writes that the indictment details additional alleged misconduct, including accepting unauthorized salary and leave payments, forcing a city contractor to pay another contractor who did no work, purchasing illegal narcotics from known drug dealers and failing to report the activity, attempting to solicit a bribe from a local business — a move that allegedly cost the city a major development project — and ordering city workers to perform plumbing repairs at his mother's home using city materials.

          Prosecutors also accuse Truong of using city funds to solicit a prostitute at an Airbnb in Atlanta.

          The charges follow Truong's January 2025 arrest by the Louisiana State Police during a drug-trafficking investigation. At the time, State Police said Truong "organized entertainment with a prostitute" during a mayors' conference in Atlanta and paid for the Airbnb using public funds, while also being accused of purchasing drugs in Louisiana. Investigators allege a Bogalusa-based drug ring was selling opioids, high-grade marijuana, THC products, and MDMA, with profits used to purchase firearms later connected to local crimes.

          Sims emphasized that the probe continues and involves cooperation from multiple agencies. He said, "This case reflects the ongoing commitment to ensuring accountability and integrity in public office." Truong remains presumed innocent until proven guilty in a court of law.

          Source: Zero Hedge

          To stay updated on all economic events of today, please check out our Economic calendar
          Risk Warnings and Disclaimers
          You understand and acknowledge that there is a high degree of risk involved in trading. Following any strategies or investment methods may lead to potential losses. The content on the site is provided by our contributors and analysts for information purposes only. You are solely responsible for determining whether any trading assets, securities, strategy, or any other product is suitable for investing based on your own investment objectives and financial situation.
          Add to Favorites
          Share

          EUR/USD: US Dollar Strength, Political Gridlock Set to Keep Pair Under Pressure

          Adam

          Forex

          The EUR/USD pair has been moving lower at a steady pace since mid-September, forming part of a broader sideways trend. The US dollar has strengthened, helped by calmer relations between Beijing and Washington and lower expectations of another Fed rate cut in December, which markets had earlier considered likely.
          In Europe, the European Central Bank kept interest rates unchanged last week, matching market expectations. The decision was based on inflation staying near the ECB’s target and showing signs of stability in the short to medium term.
          Meanwhile, the ongoing US government shutdown has kept economic activity quiet, and we may not get labor market data this week as a result.

          Falling Fed Rate Cut Chances in December

          Just a few weeks ago, markets were confident that the Fed would cut interest rates by at least 50 basis points before the end of the year, likely spread across the October and December meetings. Now, that outlook has shifted. The odds of a cut and a pause are nearly balanced, with a slight tilt toward a cut. However, recent cautious remarks from Fed officials, combined with the lack of new economic data, suggest they may wait until year-end before making any move.
          EUR/USD: US Dollar Strength, Political Gridlock Set to Keep Pair Under Pressure_1
          The key question now is whether the political deadlock will ease this month, allowing the release of pending macroeconomic data. Based on recent public remarks, that seems unlikely, as both parties continue to trade blame and hold their ground. A more favorable environment for negotiations could emerge after the upcoming local elections in the US. The most closely watched contest is the New York mayoral race, where the Democratic candidate currently holds a lead in the polls.

          Is this the End of the Downgrade Cycle in the Eurozone?

          With its latest decision and statement, the ECB has signaled that it considers the current level of interest rates suitable for the eurozone’s present economic conditions. Christine Lagarde and her team appear confident that policy settings are aligned with the region’s macroeconomic outlook.
          EUR/USD: US Dollar Strength, Political Gridlock Set to Keep Pair Under Pressure_2
          At the same time, the ECB emphasized that it will keep monitoring incoming data but will avoid reacting to one-off spikes in inflation unless there are clear signs of lasting growth. Markets are also watching whether Germany’s proposed stimulus package goes through, as its scale and design could have a significant impact on the broader European economy.
          EUR/USD Struggles to Move Below 1.15
          The current decline in EUR/USD has slowed around the 1.15 level, but the overall trend still points downward. If the pair falls below 1.15, sellers will likely aim for the next key support level near 1.1440.
          EUR/USD: US Dollar Strength, Political Gridlock Set to Keep Pair Under Pressure_3
          Breaking through this area could be a clear signal of sellers’ dominance at least in the short term, and if the FED holds off on cuts in December, then the way is open for an attack on levels as low as 1.12.

          Source: investing

          Risk Warnings and Disclaimers
          You understand and acknowledge that there is a high degree of risk involved in trading. Following any strategies or investment methods may lead to potential losses. The content on the site is provided by our contributors and analysts for information purposes only. You are solely responsible for determining whether any trading assets, securities, strategy, or any other product is suitable for investing based on your own investment objectives and financial situation.
          Add to Favorites
          Share

          The gold correction is technical and temporary, and the next target is $4,200 - UBS

          Adam

          Commodity

          The current pullback in the gold market is only temporary, and the yellow metal’s price is still on track to reach $4,200 per ounce, with an upside scenario of intensifying geopolitical or market risks driving it as high as $4,700, according to analysts at UBS.
          “The much-anticipated correction has taken a breather,” UBS said in a research note on Monday. “Outside technical factors, we see no fundamental reason for the sell-off.”
          The Swiss banking giant noted that “fading price momentum triggered a second leg down in futures open interest,” but they emphasized that underlying demand remains strong.
          UBS analysts also cited the World Gold Council’s Q3 Gold Demand Trends report, which confirmed “very strong and accelerating buying” from both central banks and individual investors.
          “Central bank purchases of 634 metric tons this year have been slower than last year’s pace but are picking up in Q4, in line with our forecast of 900–950 metric tons for 2025,” they wrote.
          ETF inflows of 222 metric tons and bar and coin demand above 300 metric tons for the fourth consecutive quarter demonstrate that investor appetite has also strengthened. “Jewellery demand was also not as weak as feared,” UBS noted.
          “We like to buy the dip in gold,” the analysts said, adding they continue to believe that investors “remain underallocated” to the metal. UBS recommends a mid-single-digit allocation to gold within investor portfolios.
          On Oct. 20, Sagar Khandelwal, strategist at UBS Global Wealth Management, said lower real interest rates, a weaker dollar, rising government debt, and geopolitical turmoil could push the yellow metal to $4,700 per ounce by Q1 2026, and mining stocks will do even better.
          “While the scale and speed of the gold rally may mean volatility could pick up from here, we maintain the view that gold is a valuable component of a resilient investment strategy,” he wrote.
          Khandelwal warned that U.S. real interest rates could well fall into negative territory as the Federal Reserve cuts interest rates amid still-sticky inflation.
          “We believe this will further undermine the appeal of the US dollar and therefore boost investment flows into bullion,” he said. “In fact, global gold ETFs recorded their largest monthly inflow in September (USD 17bn), according to the World Gold Council, making the USD 26bn in inflows over the three months to September the strongest quarter on record.”
          UBS believes investment demand can strengthen even further. “[C]oupled with still-elevated central bank purchases, global gold demand this year should, in our view, reach around 4,850 metric tons, the highest level since 2011,” Khandelwal wrote. “If private investors begin diversifying US Treasury holdings into gold, which has been a trend among central banks, spot prices could be pushed even higher.”
          “Finally, as economic, geopolitical, and policy uncertainties remain, we expect continued flows into the yellow metal, which could spur additional gains toward our upside case of USD 4,700/oz,” he said. “Given the precious metal’s low correlation with equities and bonds, especially during periods of market stress, we favor a mid-single-digit exposure to gold in a well-diversified portfolio.”
          “Separately, investors can also consider equity exposure to select gold miners as their cash flow could rise faster than gold prices in the next six months,” Khandelwal added.
          Gold prices are continuing to trade on either side of the $4,000 per ounce level on Monday after twice topping out at the session high of $4,030, most recently just after 10 am EST.
          The gold correction is technical and temporary, and the next target is $4,200 - UBS_1
          Spot gold last traded at $4,000.97 per ounce for a gain of 0.05% on the session.

          Source: kitco

          Risk Warnings and Disclaimers
          You understand and acknowledge that there is a high degree of risk involved in trading. Following any strategies or investment methods may lead to potential losses. The content on the site is provided by our contributors and analysts for information purposes only. You are solely responsible for determining whether any trading assets, securities, strategy, or any other product is suitable for investing based on your own investment objectives and financial situation.
          Add to Favorites
          Share

          Goldman, Morgan Stanley CEOs Warn Of Equity Markets Heading Towards Correction

          Daniel Carter

          Stocks

          Chief executives of Morgan Stanley and Goldman Sachs cautioned on Tuesday that the global equity markets could be heading towards a correction, underscoring a growing concern that investor optimism has driven valuations to sky-high levels.
          Fears of a market bubble come as the benchmark S&P 500 continues its meteoric climb, repeatedly hitting record highs and evoking memories of the dot-com boom.
          "We should welcome the possibility that there would be drawdowns, 10% to 15%, that are not driven by some sort of macro cliff effect," Morgan Stanley CEO Ted Pick said at the Global Financial Leaders' Investment Summit in Hong Kong.
          Markets have so far largely brushed aside concerns about inflation, elevated interest rates, policy uncertainty from shifting trade dynamics, and the ongoing federal government shutdown, now in its fifth week.
          "When you have these cycles, things can run for a period of time. But there are things that will change sentiment and will create drawdowns, or change the perspective on the growth trajectory, and none of us are smart enough to see them until they actually occur," Goldman CEO David Solomon said at the summit.
          Earlier this week, the co-chief investment officers of hedge fund Bridgewater Associates had also warned that investors are overlooking mounting risks to the current market stability and the limits of the artificial intelligence boom, particularly in the U.S.

          Source: Yahoo Finance

          Risk Warnings and Disclaimers
          You understand and acknowledge that there is a high degree of risk involved in trading. Following any strategies or investment methods may lead to potential losses. The content on the site is provided by our contributors and analysts for information purposes only. You are solely responsible for determining whether any trading assets, securities, strategy, or any other product is suitable for investing based on your own investment objectives and financial situation.
          Add to Favorites
          Share

          Solar Stocks: Navigating Growth and Value in a Shifting Market

          Adam

          Stocks

          Investor enthusiasm for solar stocks is being tested once again. As the sector faces volatile sentiment, evolving policy signals, and a sharper focus on profitability, the key challenge lies in balancing growth potential with valuation discipline and margin resilience.
          Following a phase of exuberance and correction, the solar industry is recalibrating. Investors are now seeking companies that can combine scale with sound profitability and compelling valuations. Using our Stock Screener, we identified solar stocks meeting the following criteria: a market capitalization above $500 million, a three-year compound annual growth rate (CAGR) above 10%, an EBITDA margin of at least 15% in the latest fiscal year, and an enterprise value-to-EBITDA multiple no higher than 15 times. We also emphasized a strong short-term outlook, based on our Trader Rating universe.
          This screening surfaced three names that embody today’s trade-offs between growth, value, and operational quality: Xinyi Energy Holdings, ReNew Energy Global, and Array Technologies.
          Solar Stocks: Navigating Growth and Value in a Shifting Market_1

          Efficiency and value: Xinyi Energy’s disciplined edge

          Sector: Utilities
          Xinyi Energy Holdings stands out for its exceptional profitability and operational efficiency. Focused on managing solar farms in China, the company reported an EBITDA margin of 91.5%, far above the screened universe’s weighted average of 41.8%. Its EV/EBITDA ratio of 5.9x also sits comfortably below the peer average of 7.8x, underscoring its valuation appeal.
          The stock has gained 47.7% over the past year and 38.0% over six months, though its three-year return remains negative at -40.4%. Revenue has grown at a 13.5% CAGR, meeting the screen’s growth threshold but lagging the group average.
          Our MarketScreener Investor Rating is 4.5★, reflecting solid fundamentals, while the Trader Rating ranks at the top of our range, signaling favorable short-term sentiment. With EBITDA, EBIT, and net margins all in the upper decile, Xinyi combines high profitability, attractive valuation, and recent price momentum—an appealing mix for investors seeking stability in the solar utility segment.
          Key Dates: No upcoming events disclosed.
          Solar Stocks: Navigating Growth and Value in a Shifting Market_2

          Growth at a price: ReNew’s high-powered expansion

          Sector: Utilities
          ReNew Energy Global, one of India’s renewable energy leaders, offers a contrasting profile—strong growth and margins, paired with higher leverage risk. The company posted an EBITDA margin of 81.6%, more than double the screen’s average, and trades at an EV/EBITDA multiple of 10.5x, still below peers. Its three-year revenue CAGR of 19.1% surpasses both Xinyi and the group average.
          The stock is up 10.4% year-to-date and 19.5% over six months, though it fell 10.8% last year. Over three years, the total return is 27.2%. Profitability and growth metrics remain strong, but gearing and leverage ratios rank at the lower end of our universe, highlighting balance-sheet risk.
          Our Investor Rating is neutral at 1.5★, yet the Trader Rating remains in the upper range, suggesting constructive short-term sentiment. ReNew’s ability to sustain strong margins and rapid expansion—despite capital intensity—makes it a choice for investors willing to embrace higher risk in pursuit of growth.
          Key Dates: No upcoming events disclosed.
          Solar Stocks: Navigating Growth and Value in a Shifting Market_3

          Recovery in motion: Array’s cyclical comeback

          Sector: Energy
          Array Technologies, a key provider of solar tracker systems, represents a turnaround story built on improving execution and sentiment. The company posted a 19.0% EBITDA margin, modestly below the screen average but comfortably above the minimum threshold, with an EV/EBITDA multiple of 7.1x—attractive both relative to peers and its five-year history.
          Momentum has returned. In Q2 2025, net income reached $28.5 million, beating consensus by 147.3%, while EPS of $0.19 exceeded expectations by 169.1%. Quarterly net sales hit $362.2 million, 25.4% above forecasts, and EBITDA of $63.6 million surpassed estimates by 19.1%. This marks a sharp turnaround from the prior year’s $296.1 million net loss and -$1.95 EPS.
          The stock has rebounded 39.2% year-to-date and 25.5% over the past year, after plunging 64.1% in 2024. Analyst sentiment is now “OUTPERFORM”, with an average target price of $10.22, implying a 21.5% upside. Our Investor Rating is neutral at 2.0★, and the Trader Rating sits in the upper range, reflecting improving visibility and renewed momentum.
          Key Dates: November 5, 2025 – Q3 2025 Earnings Release.
          Solar Stocks: Navigating Growth and Value in a Shifting Market_4

          A sector finding its balance

          Xinyi Energy Holdings leads with profitability and valuation discipline, ReNew Energy Global delivers faster growth with higher risk, and Array Technologies is regaining its footing through operational improvement. Each story illustrates a different way to navigate the solar sector’s evolving balance between growth, value, and risk. By applying rigorous filters for scale, profitability, and valuation, investors can pinpoint opportunities that stand to benefit as the industry enters its next phase of maturity.

          Source: marketscreener

          Risk Warnings and Disclaimers
          You understand and acknowledge that there is a high degree of risk involved in trading. Following any strategies or investment methods may lead to potential losses. The content on the site is provided by our contributors and analysts for information purposes only. You are solely responsible for determining whether any trading assets, securities, strategy, or any other product is suitable for investing based on your own investment objectives and financial situation.
          Add to Favorites
          Share

          Goldman, Morgan Stanley CEOs Warn Of Pullback In Global Equity Markets

          Justin

          Stocks

          CEOs of Wall Street heavyweights Morgan Stanley and Goldman Sachs on Tuesday cautioned that equity markets could be heading toward a drawdown, underscoring growing concerns over sky-high valuations.

          Fears of a market bubble come as the benchmark S&P 500 continues its meteoric climb, repeatedly hitting record highs and evoking memories of the dot-com boom.

          "We should welcome the possibility that there would be drawdowns, 10% to 15%, that are not driven by some sort of macro cliff effect," Morgan Stanley CEO Ted Pick said at the Global Financial Leaders' Investment Summit in Hong Kong.

          Markets have so far largely brushed aside concerns about inflation, elevated interest rates, policy uncertainty from shifting trade dynamics and the ongoing federal government shutdown, now in its fifth week.

          "When you have these cycles, things can run for a period of time. But there are things that will change sentiment and will create drawdowns, or change the perspective on the growth trajectory, and none of us are smart enough to see them until they actually occur," Goldman CEO David Solomon said at the summit.

          U.S. MARKET FUTURES FALL

          Futures tracking Wall Street's main indexes slipped early on Tuesday, while the VIX, Wall Street's "fear gauge," hovered near a two-week high.

          At 07:08 a.m., Dow E-minis fell 356 points, or 0.75%, S&P 500 E-minis shed 75 points, or 1.09%, and Nasdaq 100 E-minis lost 360.25 points, or 1.37%.

          "Technology multiples are full," Solomon said, but added that the same does not hold true for the broader market.

          His remarks echo the mood among seasoned Wall Street executives, who have front-row seats to market trends. Positioning a pullback as healthy also underscores the degree of exuberance in markets.

          Last month, banking giant JPMorgan Chase's CEO Jamie Dimon had warned of a heightened risk of a significant correction in the U.S. stock market within the next six months to two years.

          "I am far more worried about that than others," Dimon said, according to the BBC, adding there were a "lot of things out there" creating an atmosphere of uncertainty, pointing to risk factors, including geopolitical tensions, fiscal spending and global remilitarization.

          Earlier this week, the co-chief investment officers of hedge fund Bridgewater Associates had said that investors are overlooking mounting risks.

          AI BOOM OR BUBBLE?

          The surge in enthusiasm for generative AI has drawn comparisons to the dot-com bubble, as investors pour billions into technology firms amid soaring valuations and expectations of transformative growth.

          In September, Citigroup said it expects AI-related infrastructure spending by tech giants to surpass $2.8 trillion through 2029, higher than the $2.3 trillion it estimated earlier.

          The frenzy is evident across corporate dealmaking. On Monday, OpenAI inked a seven-year, $38 billion agreement to purchase cloud services from Amazon.com.

          The dot-com bubble of the late 1990s was fueled by speculative investment in internet-based companies, leading to a surge in tech stock valuations that eventually collapsed in 2000, wiping out trillions in market value.

          Still, some analysts say the current AI boom differs from the dot-com era, as the leading companies driving it are supported by solid earnings and tangible business performance.

          Last month, Nvidia made history as the first company to reach $5 trillion in market value.

          Source: Yahoo Finance

          Risk Warnings and Disclaimers
          You understand and acknowledge that there is a high degree of risk involved in trading. Following any strategies or investment methods may lead to potential losses. The content on the site is provided by our contributors and analysts for information purposes only. You are solely responsible for determining whether any trading assets, securities, strategy, or any other product is suitable for investing based on your own investment objectives and financial situation.
          Add to Favorites
          Share
          FastBull
          Copyright © 2025 FastBull Ltd

          728 RM B 7/F GEE LOK IND BLDG NO 34 HUNG TO RD KWUN TONG KLN HONG KONG

          TelegramInstagramTwitterfacebooklinkedin
          App Store Google Play Google Play
          Products
          Charts

          Chats

          Q&A with Experts
          Screeners
          Economic Calendar
          Data
          Tools
          Membership
          Features
          Function
          Markets
          Copy Trading
          Latest Signals
          Contests
          News
          Analysis
          24/7
          Columns
          Education
          Company
          Careers
          About Us
          Contact Us
          Advertising
          Help Center
          Feedback
          User Agreement
          Privacy Policy
          Business

          White Label

          Data API

          Web Plug-ins

          Poster Maker

          Affiliate Program

          Risk Disclosure

          The risk of loss in trading financial instruments such as stocks, FX, commodities, futures, bonds, ETFs and crypto can be substantial. You may sustain a total loss of the funds that you deposit with your broker. Therefore, you should carefully consider whether such trading is suitable for you in light of your circumstances and financial resources.

          No decision to invest should be made without thoroughly conducting due diligence by yourself or consulting with your financial advisors. Our web content might not suit you since we don't know your financial conditions and investment needs. Our financial information might have latency or contain inaccuracy, so you should be fully responsible for any of your trading and investment decisions. The company will not be responsible for your capital loss.

          Without getting permission from the website, you are not allowed to copy the website's graphics, texts, or trademarks. Intellectual property rights in the content or data incorporated into this website belong to its providers and exchange merchants.

          Not Logged In

          Log in to access more features

          FastBull Membership

          Not yet

          Purchase

          Become a signal provider
          Help Center
          Customer Service
          Dark Mode
          Price Up/Down Colors

          Log In

          Sign Up

          Position
          Layout
          Fullscreen
          Default to Chart
          The chart page opens by default when you visit fastbull.com