• Trade
  • Markets
  • Copy
  • Contests
  • News
  • 24/7
  • Calendar
  • Q&A
  • Chats
Trending
Screeners
SYMBOL
LAST
BID
ASK
HIGH
LOW
NET CHG.
%CHG.
SPREAD
SPX
S&P 500 Index
6870.39
6870.39
6870.39
6895.79
6858.28
+13.27
+ 0.19%
--
DJI
Dow Jones Industrial Average
47954.98
47954.98
47954.98
48133.54
47871.51
+104.05
+ 0.22%
--
IXIC
NASDAQ Composite Index
23578.12
23578.12
23578.12
23680.03
23506.00
+72.99
+ 0.31%
--
USDX
US Dollar Index
98.950
99.030
98.950
99.060
98.740
-0.030
-0.03%
--
EURUSD
Euro / US Dollar
1.16426
1.16443
1.16426
1.16715
1.16277
-0.00019
-0.02%
--
GBPUSD
Pound Sterling / US Dollar
1.33312
1.33342
1.33312
1.33622
1.33159
+0.00041
+ 0.03%
--
XAUUSD
Gold / US Dollar
4197.91
4197.91
4197.91
4259.16
4191.87
-9.26
-0.22%
--
WTI
Light Sweet Crude Oil
59.809
60.061
59.809
60.236
59.187
+0.426
+ 0.72%
--

Community Accounts

Signal Accounts
--
Profit Accounts
--
Loss Accounts
--
View More

Become a signal provider

Sell trading signals to earn additional income

View More

Guide to Copy Trading

Get started with ease and confidence

View More

Signal Accounts for Members

All Signal Accounts

Best Return
  • Best Return
  • Best P/L
  • Best MDD
Past 1W
  • Past 1W
  • Past 1M
  • Past 1Y

All Contests

  • All
  • Trump Updates
  • Recommend
  • Stocks
  • Cryptocurrencies
  • Central Banks
  • Featured News
Top News Only
Share

Government Spokesperson: Fourteen Arrested Over Benin Coup Attempt

Share

French President Macron: Nigeria Seeks French Help To Combat Insecurity

Share

Industry Source: EU Commission May Announce Package To Support Auto Industry On December 16

Share

Israel Foreign Currency Reserves $231.425 Billion In November Versus$231.954 Billion In October -Bank Of Israel

Share

[Moodeng Surges Over 43% In The Last 24 Hours, With A Current Market Cap Of $104 Million.] December 7Th, According To Gmgn Market Data, The Solana-Based Meme Coin Moodeng Surged Over 43% In The Past 24 Hours, With A Market Capitalization Currently Standing At 104 Million USD

Share

Jerusalem-German Chancellor Merz: We Have Not Discussed A Visit To Germany By Israeli Prime Minister Benjamin Netanyahu, Not An Issue At The Moment

Share

Israeli Prime Minister Netanyahu: We're Close To The Second Phase Of Trump's Gaza Plan

Share

West Africa's ECOWAS Bloc: 'Strongly Condemns' Attempted Military Coup In Benin

Share

Israeli Prime Minister Netanyahu: Political Annexation Of The West Bank Remains A Subject Of Discussion

Share

Israeli Prime Minister Netanyahu: Sovereign Power Of Security From The Jordan River To The Mediterranean Will Always Remain In Israel's Hands

Share

Israeli Prime Minister Netanyahu: We Believe There Is A Path To A Workable Peace With Our Palestinian Neighbors

Share

Israeli Prime Minister Netanyahu: I Will Meet Trump This Month

Share

Egypt's Net Foreign Reserves Rise To $50.216 Billion In November From $50.071 Billion In October

Share

Uganda Opposition Candidate Says He Was Beaten By Security Forces

Share

Benin's Foreign Minister Bakari:Large Part Of The Army And National Guard Still Loyalist And Are Controlling The Situation

Share

Russian Defence Ministry: Russian Troops Complete Capture Of Rivne In Ukraine's Donetsk Region

Share

Russian Defence Ministry: Russian Troops Carried Out Group Strike Overnight On Ukraine's Transport Infrastructure Facilities, Fuel And Energy Complexes, And Long-Range Drone Complexes

Share

Russian Defence Ministry: Russian Forces Capture Kucherivka In Ukraine's Kharkiv Region

Share

US Envoy Kellogg Says Ukraine Peace Deal Is Really Close

Share

US Embassy In India- US Under Secretary Of State For Political Affairs Allison Hooker Will Visit New Delhi And Bengaluru, India, From December 7 To 11

TIME
ACT
FCST
PREV
Euro Zone Employment YoY (SA) (Q3)

A:--

F: --

P: --

Euro Zone GDP Final YoY (Q3)

A:--

F: --

P: --

Euro Zone GDP Final QoQ (Q3)

A:--

F: --

P: --

Euro Zone Employment Final QoQ (SA) (Q3)

A:--

F: --

P: --

Euro Zone Employment Final (SA) (Q3)

A:--

F: --

P: --
Brazil PPI MoM (Oct)

A:--

F: --

P: --

Mexico Consumer Confidence Index (Nov)

A:--

F: --

P: --

Canada Unemployment Rate (SA) (Nov)

A:--

F: --

P: --

Canada Labor Force Participation Rate (SA) (Nov)

A:--

F: --

P: --

Canada Employment (SA) (Nov)

A:--

F: --

P: --

Canada Part-Time Employment (SA) (Nov)

A:--

F: --

P: --

Canada Full-time Employment (SA) (Nov)

A:--

F: --

P: --

U.S. Personal Income MoM (Sept)

A:--

F: --

P: --

U.S. PCE Price Index YoY (SA) (Sept)

A:--

F: --

P: --

U.S. PCE Price Index MoM (Sept)

A:--

F: --

P: --

U.S. Personal Outlays MoM (SA) (Sept)

A:--

F: --

P: --

U.S. Core PCE Price Index MoM (Sept)

A:--

F: --

P: --

U.S. Core PCE Price Index YoY (Sept)

A:--

F: --

P: --

U.S. UMich 5-Year-Ahead Inflation Expectations Prelim YoY (Dec)

A:--

F: --

P: --

U.S. Real Personal Consumption Expenditures MoM (Sept)

A:--

F: --

P: --

U.S. 5-10 Year-Ahead Inflation Expectations (Dec)

A:--

F: --

P: --

U.S. UMich Current Economic Conditions Index Prelim (Dec)

A:--

F: --

P: --

U.S. UMich Consumer Sentiment Index Prelim (Dec)

A:--

F: --

P: --

U.S. UMich 1-Year-Ahead Inflation Expectations Prelim (Dec)

A:--

F: --

P: --

U.S. UMich Consumer Expectations Index Prelim (Dec)

A:--

F: --

P: --

U.S. Weekly Total Rig Count

A:--

F: --

P: --

U.S. Weekly Total Oil Rig Count

A:--

F: --

P: --

U.S. Unit Labor Cost Prelim (SA) (Q3)

--

F: --

P: --

U.S. Consumer Credit (SA) (Oct)

A:--

F: --

P: --

China, Mainland Foreign Exchange Reserves (Nov)

A:--

F: --

P: --

China, Mainland Exports YoY (USD) (Nov)

--

F: --

P: --

China, Mainland Imports YoY (CNH) (Nov)

--

F: --

P: --

China, Mainland Imports YoY (USD) (Nov)

--

F: --

P: --

China, Mainland Imports (CNH) (Nov)

--

F: --

P: --

China, Mainland Trade Balance (CNH) (Nov)

--

F: --

P: --

China, Mainland Exports (Nov)

--

F: --

P: --

Japan Wages MoM (Oct)

--

F: --

P: --

Japan Trade Balance (Oct)

--

F: --

P: --

Japan Nominal GDP Revised QoQ (Q3)

--

F: --

P: --

Japan Trade Balance (Customs Data) (SA) (Oct)

--

F: --

P: --

Japan GDP Annualized QoQ Revised (Q3)

--

F: --

P: --
China, Mainland Exports YoY (CNH) (Nov)

--

F: --

P: --

China, Mainland Trade Balance (USD) (Nov)

--

F: --

P: --

Germany Industrial Output MoM (SA) (Oct)

--

F: --

P: --

Euro Zone Sentix Investor Confidence Index (Dec)

--

F: --

P: --

Canada Leading Index MoM (Nov)

--

F: --

P: --

Canada National Economic Confidence Index

--

F: --

P: --

U.S. Dallas Fed PCE Price Index YoY (Sept)

--

F: --

P: --

U.S. 3-Year Note Auction Yield

--

F: --

P: --

U.K. BRC Overall Retail Sales YoY (Nov)

--

F: --

P: --

U.K. BRC Like-For-Like Retail Sales YoY (Nov)

--

F: --

P: --

Australia Overnight (Borrowing) Key Rate

--

F: --

P: --

RBA Rate Statement
RBA Press Conference
Germany Exports MoM (SA) (Oct)

--

F: --

P: --

U.S. NFIB Small Business Optimism Index (SA) (Nov)

--

F: --

P: --

Mexico Core CPI YoY (Nov)

--

F: --

P: --

Mexico 12-Month Inflation (CPI) (Nov)

--

F: --

P: --

Mexico PPI YoY (Nov)

--

F: --

P: --

Mexico CPI YoY (Nov)

--

F: --

P: --

U.S. Weekly Redbook Index YoY

--

F: --

P: --

Q&A with Experts
    • All
    • Chatrooms
    • Groups
    • Friends
    Connecting
    .
    .
    .
    Type here...
    Add Symbol or Code

      No matching data

      All
      Trump Updates
      Recommend
      Stocks
      Cryptocurrencies
      Central Banks
      Featured News
      • All
      • Russia-Ukraine Conflict
      • Middle East Flashpoint
      • All
      • Russia-Ukraine Conflict
      • Middle East Flashpoint
      Search
      Products

      Charts Free Forever

      Chats Q&A with Experts
      Screeners Economic Calendar Data Tools
      Membership Features
      Data Warehouse Market Trends Institutional Data Policy Rates Macro

      Market Trends

      Market Sentiment Order Book Forex Correlations

      Top Indicators

      Charts Free Forever
      Markets

      News

      News Analysis 24/7 Columns Education
      From Institutions From Analysts
      Topics Columnists

      Latest Views

      Latest Views

      Trending Topics

      Top Columnists

      Latest Update

      Signals

      Copy Rankings Latest Signals Become a signal provider AI Rating
      Contests
      Brokers

      Overview Brokers Assessment Rankings Regulators News Claims
      Broker listing Forex Brokers Comparison Tool Live Spread Comparison Scam
      Q&A Complaint Scam Alert Videos Tips to Detect Scam
      More

      Business
      Events
      Careers About Us Advertising Help Center

      White Label

      Data API

      Web Plug-ins

      Affiliate Program

      Awards Institution Evaluation IB Seminar Salon Event Exhibition
      Vietnam Thailand Singapore Dubai
      Fans Party Investment Sharing Session
      FastBull Summit BrokersView Expo
      Recent Searches
        Top Searches
          Markets
          News
          Analysis
          User
          24/7
          Economic Calendar
          Education
          Data
          • Names
          • Latest
          • Prev

          View All

          No data

          Scan to Download

          Faster Charts, Chat Faster!

          Download App
          English
          • English
          • Español
          • العربية
          • Bahasa Indonesia
          • Bahasa Melayu
          • Tiếng Việt
          • ภาษาไทย
          • Français
          • Italiano
          • Türkçe
          • Русский язык
          • 简中
          • 繁中
          Open Account
          Search
          Products
          Charts Free Forever
          Markets
          News
          Signals

          Copy Rankings Latest Signals Become a signal provider AI Rating
          Contests
          Brokers

          Overview Brokers Assessment Rankings Regulators News Claims
          Broker listing Forex Brokers Comparison Tool Live Spread Comparison Scam
          Q&A Complaint Scam Alert Videos Tips to Detect Scam
          More

          Business
          Events
          Careers About Us Advertising Help Center

          White Label

          Data API

          Web Plug-ins

          Affiliate Program

          Awards Institution Evaluation IB Seminar Salon Event Exhibition
          Vietnam Thailand Singapore Dubai
          Fans Party Investment Sharing Session
          FastBull Summit BrokersView Expo

          US Manufacturing Surveys Mixed In October; Prices Down, Production Up

          Devin

          Economic

          Summary:

          "...lift the hood and the picture is not so healthy."

          Amid the month-long vacuum of macro data, thanks to the shutdown, 'soft' survey data has become almost the only leg left standing to judge the economy by (absent the housing data).

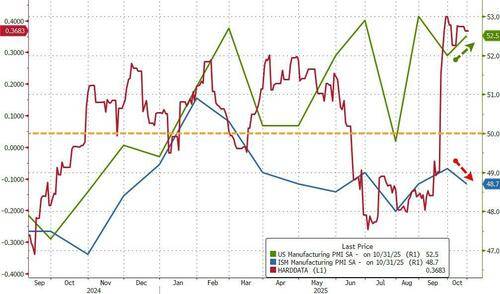
          Following better-than-expected prints across Europe, and beats in Brazil and Canada, this morning's S&P Global US Manufacturing PMI rose more than expected to 52.5 (52.2 exp), up from 52.0 - tracking hard data higher.

          That signaled a third successive month that the S&P Global PMI has posted above the critical 50.0 no-change mark and indicative of a solid improvement in operating conditions that was in line with the survey's trend pace.

          The PMI was supported in October by concurrent and accelerated gains in both output and new orders.

          Production was increased at a solid pace, whilst the gain in new orders was the best recorded in 20 months. Growth in new work has been registered consistently throughout the year to date, albeit to varying degrees, and panelists noted in October an uplift in market demand and success in securing new contracts. However, October's growth was increasingly reliant on the domestic market as new export orders faltered.

          BUT...

          ...as usual in the baffle 'em with bullshit world, ISM's US Manufacturing PMI missed expectations, falling from 49.1 to 48.7 (worse than the 49.5 exp) - the 8th straight month of contraction (below 50)

          Source: Bloomberg

          "US manufacturers reported a solid start to the fourth quarter with production rising at an increased rate in response to an encouragingly robust jump in new orders," according to Chris Williamson, Chief Business Economist at S&P Global Market Intelligence.

          "However, lift the hood and the picture is not so healthy."

          "Most worrying is the unprecedented rise in unsold stock reported in October, widely linked to weaker than anticipated sales to customers, especially in export markets, which could trigger a downshifting of production in the coming months unless demand revives.

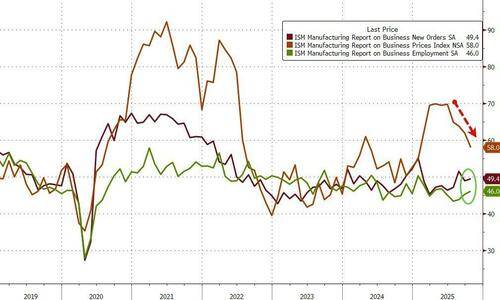
          Indeed, ISM shows prices falling fast and new orders and employment improving MoM (though both below 50 - contracting).

          The index of prices paid for raw materials fell 3.9 points to 58, the lowest since the start of the year. Since a recent peak in April, during the height of the tariffs rollout, the price gauge has dropped nearly 12 points...

          Source: Bloomberg

          Companies have also become less optimistic about the year ahead, with sentiment back down close to the gloomy levels seen around the April tariff announcements.

          "US trade policy uncertainties are again a big factor in dampening business spirits, with tariff policies being increasingly blamed both on rising export losses and import supply chain disruptions.

          These export and import worries are being exacerbated by more domestically focused political concerns, including the federal shutdown, which are manifesting themselves most prominently in consumer-focused industries."

          Tariffs remained a key source of higher input costs during October with S&P Global's latest data showing another round of historically elevated inflation – albeit the lowest since February.

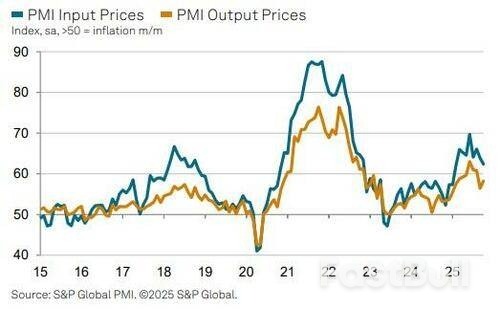
          Selling prices were raised markedly in response, and to a quicker degree than September's recent low.

          Finally, Williamson notes that business confidence among producers of consumer goods is now down to its lowest for two years "as firms growing increasingly worried about household spending in the US and falling sales to consumers in export markets."

          Source: Zero Hedge

          To stay updated on all economic events of today, please check out our Economic calendar
          Risk Warnings and Disclaimers
          You understand and acknowledge that there is a high degree of risk involved in trading. Following any strategies or investment methods may lead to potential losses. The content on the site is provided by our contributors and analysts for information purposes only. You are solely responsible for determining whether any trading assets, securities, strategy, or any other product is suitable for investing based on your own investment objectives and financial situation.
          Add to Favorites
          Share

          Ex-ISIS Envoy Who Killed Americans In Iraq To Be Hosted At White House This Month

          Justin

          Political

          President Donald Trump is set to host Syria's self-appointed interim leader later this month for talks in Washington, marking the first ever visit by a Syrian head of state to the US capitol. Abu Mohammad al-Jolani, who once fought alongside foreign fighters while killing American soldiers in Iraq, will enjoy his red carpet reception in Washington on November 10.

          This will also mark the first time a former ISIS member will be hosted in the Oval Office, an absurdity which would have been hard to believe a mere decade ago. But the US-Saudi-Israel axis reached its regime change goal in Damascus, which overthrew the secular Arab nationalist leader Bashar al-Assad, which resulted in the Islamist Hayat Tahrir al-Sham (HTS) taking over.

          The HTS leader Abu Mohammad al-Jolani, who was even earlier this year still on the US terrorism list, quickly reverted to his birth name of Ahmed al-Sharaa. The US had promptly removed the $10 million bounty on his head just before President Trump met with him in Riyadh last May.

          "President Ahmed al-Sharaa will be at the White House at the start of November," Syria's foreign minister said in speech in Bahrain. "Of course, this is a historic visit. It is the first visit by a Syrian president to the White House in more than 80 years."

          "There will be many issues on the table, starting with the lifting of sanctions and opening of a new chapter between the United States and Syria. We want to establish a very strong partnership between the two countries."

          One area of proposed cooperation is in fighting terrorism, ironically enough, and the US and Syria under Jolani are expected to sign an agreement joining a US-led international coalition against ISIS during the visit, which is somewhat laughable given ISIS patches have recently been seen among HTS ranks.

          Despite attempts to distance his group from extremist organizations, the United States still designated his new group a terror organization and targeted members of HTS who once fought for Al Qaeda, proving his rebranding attempts a failure.

          And NBC too underscored Jolani's ISIS pedigree soon after he ousted Assad in December 2024:

          Born in Syria in 1982, he joined other foreign fighters in Iraq after the 2003 U.S.-led invasion, and was detained by the American military, according to The Associated Press.

          When Syria's vicious civil war erupted in 2011, Abu Bakr al-Baghdadi, leader of the Islamic State of Iraq (ISI), sent Jolani to Syria to establish the Al-Nusra Front, a branch of Al Qaeda.

          Their conflict escalated two years later. Jolani rejected Baghdadi's calls to dissolve the Nusra Front and merge it with ISI to form ISIS. Instead, he pledged allegiance to Al Qaeda, which later disassociated itself from ISIS. The Nusra Front then became Al Qaeda's Syria affiliate and later battled ISIS for supremacy in the battle against Assad.

          His aforementioned ruling Islamist faction HTS has since taking control in Damascus been conducting sectarian attacks on ethno-religious minorities in Syria. Thousands of Alawites, Druze, and Christians have been killed and/or driven from their homes.

          All the while, Sharraa has sought to claim before international cameras that he'll ensure equality for non-Muslims as well as women, but the actions of his HTS gangs are the opposite.

          Source: Zero Hedge

          Risk Warnings and Disclaimers
          You understand and acknowledge that there is a high degree of risk involved in trading. Following any strategies or investment methods may lead to potential losses. The content on the site is provided by our contributors and analysts for information purposes only. You are solely responsible for determining whether any trading assets, securities, strategy, or any other product is suitable for investing based on your own investment objectives and financial situation.
          Add to Favorites
          Share

          Gold: 2-Week Slide Tests Market’s Faith in This Critical Support Zone

          Adam

          Commodity

          Gold ended lower for the second consecutive week and has made a cautious start to this week’s action. Prices have been stuck around the $4,000 area in the last few trading days, hurt by a dollar recovery and loss of prior momentum.
          The key question now is whether we have already seen a top or if this two-week drop is merely a blip. Much will depend on whether we will see continued central bank buying and the direction of the US dollar. But the weakness was long overdue, and in that regard, it is no surprise.

          Gold’s Loss of Momentum

          Over the past couple of weeks, the bearish momentum on gold has been evident following the reversal from those historic, extremely overbought levels. Some key levels have since been taken out, including most importantly, that psychological $4,000 mark.
          While the initial breakdown below this level triggered a wave of technical selling and liquidation of long positions, the fact that prices have since recovered to climb back above here - albeit without any further upside yet – is mildly positive.
          The key question is whether more losses will be on the way or whether prices will form a base around the $4K level now. The de-escalation in the US–China trade war is clearly a negative outcome for gold, while signs that inflation is slowing is also a reason why traders have been taking profit on their long positions.
          The fact that the Fed chair said a rate cut in December is not a forgone conclusion that too is also a mildly negative influence on gold prices. The fact that global indices have recently hit new all-time highs, this too has also taken some shine off safe-haven assets like gold.

          China’s Gold Buying Cools, but Demand Persists

          Much of the strong Q3 central bank buying was driven by heightened geopolitical tensions, high inflationary pressures, and uncertainty around global trade policy, all of which fuelled appetite for safe-haven assets like gold. Some central banks like the PBOC, also wanted to diversify away from US debt.
          While demand for gold has been clearly strong, the elevated prices we have seen consistently throughout this year might be a limiting factor for further central bank purchases.
          Indeed, there was an apparent slowdown in Chinese gold imports recently. Last week’s data from Hong Kong showed that September’s net exports to China fell 17.6% month-on-month, signalling softer demand from the People’s Bank of China. However, with imports still above 22 tonnes, this moderation may suggest that the PBOC feels these high prices might have gotten too high, too quickly, rather than a fundamental shift in China’s reserve strategy.
          One month’s data is hardly conclusive, and with official PBoC figures due in the next week or so, markets will soon have a clearer view of the central bank’s intentions.

          Can Gold Make a Base Around $4K Handle?

          Technically, the long-term chart of gold is still bullish. So, despite the recent drop, I’d wait to see what happens next before calling a top here, as betting against this rally has not worked well over the past year or so. If prices can hold above $4,000 for a while, that would be a strong bullish signal, suggesting the long-term uptrend remains intact.
          But if gold struggles here and starts to head find itself more into the negative side of $4000, then it’s fair to say a short-term top might be in place, and we could see further selling until prices look attractive again… or until risk sentiment turns, and investors start looking for safety.
          Gold: 2-Week Slide Tests Market’s Faith in This Critical Support Zone_1
          Some key short-term resistance levels to watch include $4045, then the underside of the broken trend line at around $4,100.
          In terms of support below $4,000, well, the $3,970 level is the initial support, then last week’s low of $3,886 comes into play next. Below that, there are no obvious support levels apart from round handles like $3,800, $3,700, etc., until we potentially get all the way down to the April high of $3,500, now the most important long-term support.

          Source : investing

          Risk Warnings and Disclaimers
          You understand and acknowledge that there is a high degree of risk involved in trading. Following any strategies or investment methods may lead to potential losses. The content on the site is provided by our contributors and analysts for information purposes only. You are solely responsible for determining whether any trading assets, securities, strategy, or any other product is suitable for investing based on your own investment objectives and financial situation.
          Add to Favorites
          Share

          US Manufacturing Shrinks For Eighth Month On Sluggish Demand

          Daniel Carter

          Economic

          The Institute for Supply Management's manufacturing index eased 0.4 point to 48.7, according to data released Monday. Readings below 50 indicate contraction, and the measure has been stuck in a narrow range for most of this year.
          The group's production index slid 2.8 points to 48.2, marking the second month in the last three that output has contracted. The weakness is keeping headcounts depressed. The ISM's employment gauge shrank for a ninth straight month, albeit at a slightly slower pace than in September.
          Meanwhile, inflationary pressures continued to ease. The index of prices paid for raw materials fell 3.9 points to 58, the lowest since the start of the year. Since a recent peak in April, during the height of the tariffs rollout, the price gauge has dropped nearly 12 points.
          Economists and policymakers are relying more on private reports such as the ISM survey for clues on the economy and job market in the absence of official data because of the US government shutdown. Friday's scheduled employment report is also poised to be delayed as a result.
          A dozen manufacturing industries contracted in October, led by textiles, apparel and furniture. Six industries, including primary metals and transportation equipment, reported growth.
          The survey illustrates general malaise among the nation's manufacturers who are contending with lingering uncertainty around trade policy. Producers are navigating evolving supply chains as they source materials. The ISM measure of supplier deliveries rose to a four-month high, indicating longer lead times.
          Bookings shrank for a second month in October, though at a slower pace, the ISM report showed. Order backlogs, another indicator of demand, also contracted.
          Inventories at manufacturers shrank by the most in a year. Customers' stockpiles also remained low, suggesting some scope for orders to pick up and support production.

          Source: Bloomberg Europe

          To stay updated on all economic events of today, please check out our Economic calendar
          Risk Warnings and Disclaimers
          You understand and acknowledge that there is a high degree of risk involved in trading. Following any strategies or investment methods may lead to potential losses. The content on the site is provided by our contributors and analysts for information purposes only. You are solely responsible for determining whether any trading assets, securities, strategy, or any other product is suitable for investing based on your own investment objectives and financial situation.
          Add to Favorites
          Share

          Market navigator: week of 3 November 2025

          Adam

          Economic

          What happened last week

          US-China diplomatic breakthrough yields temporary reprieve: Trump and Xi reached an accord in Busan, halving fentanyl-related tariffs to bring effective rates on Chinese imports to 47%. China committed to postponing rare earth mineral export restrictions for one year while pledging to procure US agricultural products. Equity markets remained muted given the arrangement's temporary nature.
          Strategic APAC partnerships: President Trump conducted bilateral meetings with Japanese Prime Minister Takaichi and South Korean President Lee, consolidating trade frameworks. The US formalised a rare earth supply agreement with Japan and finalised South Korea's $350 billion US investment plan.
          Central bank policy trajectories diverge: The Federal Reserve (Fed) cut rates by 25 basis points but signalled December uncertainty, with market expectations for further easing declining from 90% to 70%. The Bank of Japan (BoJ) held rates steady, requiring additional time to assess the 15% US tariff impact and preliminary momentum from forthcoming wage negotiations. The European Central Bank (ECB) similarly held unchanged, noting diminished downside risks in the economy.
          Chinese manufacturing activity contracts further: The official manufacturing purchasing managers' index (PMI) registered 49.0, marking six consecutive contractionary months. The National Bureau of Statistics attributed this decline to Golden Week holiday disruptions and elevated global economic uncertainty. The non-manufacturing PMI improved marginally to 50.1, barely entering expansionary territory.
          Markets in focus
          US equities continue the winning streak
          The S&P 500 index concluded October with gains of 2.3%, marking the sixth consecutive month of positive returns. The technology-concentrated Nasdaq 100 advanced 4.8%, while the Dow Jones Industrial Average appreciated 2.5%. Despite this broad-based positive performance, concerning indicators of diminishing market breadth have emerged. The proportion of S&P 500 constituents trading above their 20-day moving average (MA) contracted from 62% at the previous Monday's close to merely 39%. A similar decline occurred at the 200-day MA level, suggesting that recent gains have been increasingly concentrated amongst a narrow cohort of market leaders.
          Earnings season has progressed substantially, with 63% of S&P 500 constituents having reported. The blended earnings growth rate stands at 13.8% so far, surpassing the second quarter's 12% growth trajectory. Five members of the Magnificent Seven cohort released results during the week. Alphabet shares appreciated 2% following revenue of $102 billion that exceeded analyst estimates, propelled by robust cloud infrastructure growth of 34%. Microsoft similarly beat both earnings and revenue projections with Azure expanding 40%, though shares declined 4% as investors focused on accelerating capital expenditure growth. Meta plunged 14% despite surpassing revenue forecasts, after disclosing a $15.9 billion one-time tax charge that resulted in an earnings per share miss alongside upward revisions to capital expenditure guidance. Apple and Amazon both exceeded expectations in Thursday trading, with Apple shares unchanged as strong iPhone 17 demand offset revenue contraction in China, while Amazon surged 10% as AWS cloud business accelerated to 20% growth – the fastest pace since 2022.
          From a technical analytical perspective, beyond the deterioration in market breadth, the Relative Strength Index (RSI) of the US Tech 100 exhibits bearish divergence characteristics, with lower peaks forming while prices continue establishing record highs. Both indicators suggest weakening bullish momentum. Nevertheless, the index retains potential to reach 26,830, representing a 50% extension of Wave 1 to 3 within the Elliott Wave framework. The 20-day MA near 25,200 should provide downside support.
          Figure 1: US Tech 100 index (daily) price chart
          Hang Seng Index consolidates on profit-taking
          Following an approximate 40% appreciation since start of the year, the Hang Seng Index (HSI) terminated its five-month winning sequence, retreating 3.5% in October to close marginally below 26,000.
          The highly anticipated Trump-Xi summit in Busan failed to catalyse sustained market enthusiasm, as the agreement's substance had been largely priced into valuations. In fact, 'sell the news' dynamics emerged as investors sought to crystallise substantial year-to-date gains ahead of year-end settlement. We view the deal as constructive, noting the one-year truce duration substantially exceeds the three-month extensions of previous negotiations. Furthermore, the expeditious de-escalation observed in recent discussions reflects Beijing's proactive approach to resolving external challenges as China continues to grapple with persistent structural headwinds within its domestic economy.
          Sector rotation dynamics intensified as market participants secured profits from growth-oriented equities, particularly within biotechnology and artificial intelligence (AI) sectors, while reallocating capital towards equities aligned with the 'valuation system with China characteristics' framework – typically denoting undervalued state-owned enterprises offering attractive dividend yields. Energy and Financials sectors led HSI gains during October, while Information Technology, Consumer Discretionary and Communication Services sectors underperformed.
          The HSI's inability to maintain positions above its 20-day MA demonstrates insufficient upward momentum. Should the index decline further, triggering a death cross formation between the 20-day and 50-day MA, near-term directional characteristics would likely mirror corrective Wave C within Elliott Wave theory. This downward leg's magnitude would minimally equal corrective Wave A, targeting approximately 24,316. Conversely, swift recovery above the 50-day MA may re-establish the ascending channel pattern established since mid-April, with the recent peak of 27,382 representing key resistance.
          Figure 2: Hang Seng Index (daily) price chart
          Nikkei 225 posts best monthly performance since 1990
          The Nikkei 225 index surged above 50,000 and delivered exceptional returns of 16.6% throughout October, its strongest monthly performance since October 1990. Multiple catalysts underpinned this rally: confirmation of Prime Minister Sanae Takaichi, perceived as supportive of fiscal expansion and accommodative monetary policy; renewed US-Japan strategic partnership; robust corporate earnings; and yen weakness benefiting exporters.
          Information Technology emerged as October's best-performing sector, while Financials and Real Estate detracted. Japanese corporations capitalised on AI infrastructure demand, with Hitachi reporting 56% net income growth driven by power grid infrastructure and digital transformation demand. Tokyo Electron raised full-year guidance, benefiting from semiconductor equipment market recovery. The forthcoming week proves critical as automotive exporters Toyota and Honda release earnings alongside technology investor SoftBank.
          On balance, markets may insufficiently account for political risks, as PM Takaichi's policy effectiveness could be constrained by the Liberal Democratic Party's declining public support, while domestic consumption remains weak amid negative real wage growth.
          Exuberant market sentiment propelled the Japan 225 index beyond its ascending channel established since April, leaving no clearly defined technical resistance. However, the RSI reading of 76 indicates overbought conditions. All seven previous instances when the RSI exceeded 70 preceded pullbacks, though correction magnitudes varied between 2% and 8%. Given the rally's steep trajectory, a technical correction towards the 20-day MA near 49,000 appears probable before the advance resumes.
          Figure 3: Japan 225 index (daily) price chart
          The week ahead
          The forthcoming week centres on critical central bank policy decisions and labour market assessments. The Reserve Bank of Australia (RBA) confronts a complex policy decision on Tuesday. Australia's third quarter trimmed mean inflation accelerated to 3.0% year-on-year (YoY) from 2.7% in the second quarter. Education and housing costs represented primary inflation drivers. Concurrently, the unemployment rate elevated to 4.5% in September, the highest reading since November 2021, complicating the central bank's assessment. Governor Bullock's recent commentary emphasised the institution's reluctance to rely upon isolated data spikes when calibrating policy. Markets anticipate rates holding at 3.6%, with attention concentrated on guidance regarding potential easing timing.
          Thursday's Bank of England (BoE) decision carries equivalent significance as policymakers evaluate whether inflation remains sufficiently controlled to justify additional rate reductions from the current 4% level maintained since August. Bond futures markets price a 70% probability of unchanged rates.
          Official US employment data release remains uncertain owing to the government shutdown potentially delaying Friday's non-farm payrolls report. However, Wednesday's ADP employment change should provide valuable insights into labour market conditions. Latest weekly data reveals improvement following September's concerning negative 32,000 reading.
          China's inflation statistics on Sunday will prove particularly significant following the recent Fourth Plenum's identification of 'involution' – excessive competition driving deflationary pressures – as a priority concern. We anticipate consumer prices may have improved from September's negative 0.3% YoY contraction, though persistent producer price deflation suggests structural challenges persist. Sustained improvement would bolster risk appetite in Chinese and Hong Kong markets.
          On the corporate front, technology earnings dominate, with semiconductor leaders Advanced Micro Devices and Qualcomm alongside software providers Palantir and AppLovin reporting results. Their commentary regarding artificial intelligence infrastructure demand, enterprise and government spending will prove critical for technology sector sentiment. Japanese automotive manufacturers Toyota Motor and Honda Motor will provide perspectives on global export conditions.
          Figure 4: Australia's latest unemployment and inflation data complicate RBA's decision

          Source:ig

          To stay updated on all economic events of today, please check out our Economic calendar
          Risk Warnings and Disclaimers
          You understand and acknowledge that there is a high degree of risk involved in trading. Following any strategies or investment methods may lead to potential losses. The content on the site is provided by our contributors and analysts for information purposes only. You are solely responsible for determining whether any trading assets, securities, strategy, or any other product is suitable for investing based on your own investment objectives and financial situation.
          Add to Favorites
          Share

          Trump Trade War: Can the S&P 500 Rally Survive Legal and Policy Risks?

          Adam

          Stocks

          US markets remain positive despite ongoing economic and political uncertainties. The S&P 500 marked a new record high last week at the 6,920 level and is consolidating above the 6,750 support level. However, the consolidation following the bullish chart patterns comes with growing concerns that Donald Trump’s trade policies could challenge the rally beneath the surface.
          Supreme Court to Decide Fate of Trump’s Tariff Powers
          The Supreme Court will hear arguments this week about Trump’s use of emergency powers to impose global tariffs. The case could define whether the International Emergency Economic Powers Act (IEEPA) can be used as a long-term tariff tool. While lower courts have rejected this approach, some believe the conservative majority on the bench could reverse that ruling. A decision in Trump’s favour would expand executive authority and lock in a more aggressive trade stance.
          The S&P 500 (SPX) is highly sensitive to global trade dynamics. Tariffs increase input costs for companies, disrupt supply chains, and affect forward guidance. Moreover, technology, industrials, and consumer goods sectors face the most exposure. If Trump’s authority to impose broad tariffs is upheld, investor confidence may start to shift. Markets could then begin to price in higher operational risks for multinational firms.
          On the other hand, the U.S. dollar is rebounding from its key support level at 96. Strong resistance remains at 100.50, and a break above this level would maintain a positive trend.
          Trump Trade War: Can the S&P 500 Rally Survive Legal and Policy Risks?_1
          Gold is consolidating above $4,000, while energy prices remain firm as OPEC+ signaled a pause in production increases, adding to inflation concerns. All of this feeds into S&P 500 valuations, which are sensitive to earnings expectations and monetary policy signals.

          S&P 500 Technical Analysis: Bullish Structure Holds

          The 4-hour chart for the S&P 500 shows that the index has been trading within an ascending channel pattern. It has found strong support at the 6,550 level, which triggered a sharp rebound. The key resistance level remains at 7,100. However, a break below 6,550 would invalidate the ascending channel and could lead to a deeper correction.
          Trump Trade War: Can the S&P 500 Rally Survive Legal and Policy Risks?_2
          The daily chart for the S&P 500 shows a strong bullish structure in 2025. This structure is supported by the formation of an inverted head-and-shoulders pattern, with the head formed in April 2025. The index broke above the 6,000 level in June 2025, confirming the pattern. After the breakout, it has been trading in a positive trend and shows no apparent signs of a correction.
          Trump Trade War: Can the S&P 500 Rally Survive Legal and Policy Risks?_3

          Final Thoughts

          In short, the Trump trade war remains a wildcard. A favourable court ruling could lead to broader use of tariffs, putting pressure on corporate earnings and weighing on the S&P 500’s outlook. The market is riding a wave of optimism, but legal and political risks could quickly shift the tone.
          On the other hand, the S&P 500 remains in a strong bullish structure, supported by technical patterns and recent market momentum. Short-term charts indicate that key support levels are holding, while long-term charts confirm an upward trend with no immediate signs of weakness. This supports the idea that investor sentiment remains intact despite policy risks.

          Source: fxempire

          Risk Warnings and Disclaimers
          You understand and acknowledge that there is a high degree of risk involved in trading. Following any strategies or investment methods may lead to potential losses. The content on the site is provided by our contributors and analysts for information purposes only. You are solely responsible for determining whether any trading assets, securities, strategy, or any other product is suitable for investing based on your own investment objectives and financial situation.
          Add to Favorites
          Share

          Fed's Miran Says He Can't Base Policy Stance On Buoyant Financial Markets

          Justin

          Central Bank

          Federal Reserve Governor Stephen Miran said on Monday it is wrong to put too much emphasis on the strength of equity and corporate credit markets in assessing monetary policy that he feels remains too restrictive and is heightening the risk of a downturn.

          "Financial markets are driven by a lot of things, not just monetary policy," Miran said on the Bloomberg Surveillance television program, in explaining why he dissented last week against a quarter-percentage-point rate cut in favor of a half-percentage-point reduction.Rising equity prices, narrow corporate credit spreads, and other factors don't "necessarily tell you anything about the stance of monetary policy" at a moment when interest-sensitive sectors like housing are less buoyant and some parts of the private credit market appear under stress.

          Miran's remarks highlight the competing views that Fed officials have begun to offer about the state of the economy and the risks facing it since last week's divided decision to reduce the U.S. central bank's benchmark policy rate by a quarter of a percentage point to the 3.75%-4.00% range.

          The 10-2 policy vote marked only the third time since 1990 that voting Fed members have objected in favor of both tighter and looser monetary policy, and Fed Chair Jerome Powell's remarks at his post-meeting press conference indicated an even deeper divide as he noted the "strongly differing views about how to proceed" at the central bank's December 9-10 meeting.

          It was an unusual reference to action at an upcoming meeting, with Powell emphasizing that another rate cut "is not a foregone conclusion - far from it."

          SCHMID LAYS OUT CASE FOR KEEPING MORE FOCUS ON INFLATION

          Kansas City Fed President Jeffrey Schmid, who dissented in favor of no rate cut last week, laid out on Friday the case for keeping more of a focus on inflation that remains above the central bank's 2% target, including the fact that "financial markets appear to be easy across many metrics. Equity markets are near record highs, corporate bond spreads are very narrow, and high-yield bond issuance is high. None of this suggests that financial conditions are particularly tight or that the stance of policy is restrictive."

          Asked specifically about the arguments cited by Schmid, a career banker, Miran said it overlooked stress that may be developing elsewhere in the financial system and the sluggishness in the housing market.

          In addition, repeating arguments he has laid out since joining the Fed while on leave as a top economic adviser to President Donald Trump, Miran said the economy has been buffeted by population changes and other shocks since last year that have lowered underlying interest rates and mean "that policy has passively tightened" despite the Fed's rate cuts. He said he continues to think the Fed should cut in half-percentage-point increments until hitting a "neutral" level he estimates is "quite a ways below" where it is now.

          Other U.S. central bank officials are due to continue the debate later on Monday, including in an appearance at the Brookings Institution by Fed Governor Lisa Cook, her first since Trump attempted to fire her earlier this year in an action so far blocked by federal judges but awaiting an appeal to the U.S. Supreme Court.

          Source: Kitco

          Risk Warnings and Disclaimers
          You understand and acknowledge that there is a high degree of risk involved in trading. Following any strategies or investment methods may lead to potential losses. The content on the site is provided by our contributors and analysts for information purposes only. You are solely responsible for determining whether any trading assets, securities, strategy, or any other product is suitable for investing based on your own investment objectives and financial situation.
          Add to Favorites
          Share
          FastBull
          Copyright © 2025 FastBull Ltd

          728 RM B 7/F GEE LOK IND BLDG NO 34 HUNG TO RD KWUN TONG KLN HONG KONG

          TelegramInstagramTwitterfacebooklinkedin
          App Store Google Play Google Play
          Products
          Charts

          Chats

          Q&A with Experts
          Screeners
          Economic Calendar
          Data
          Tools
          Membership
          Features
          Function
          Markets
          Copy Trading
          Latest Signals
          Contests
          News
          Analysis
          24/7
          Columns
          Education
          Company
          Careers
          About Us
          Contact Us
          Advertising
          Help Center
          Feedback
          User Agreement
          Privacy Policy
          Business

          White Label

          Data API

          Web Plug-ins

          Poster Maker

          Affiliate Program

          Risk Disclosure

          The risk of loss in trading financial instruments such as stocks, FX, commodities, futures, bonds, ETFs and crypto can be substantial. You may sustain a total loss of the funds that you deposit with your broker. Therefore, you should carefully consider whether such trading is suitable for you in light of your circumstances and financial resources.

          No decision to invest should be made without thoroughly conducting due diligence by yourself or consulting with your financial advisors. Our web content might not suit you since we don't know your financial conditions and investment needs. Our financial information might have latency or contain inaccuracy, so you should be fully responsible for any of your trading and investment decisions. The company will not be responsible for your capital loss.

          Without getting permission from the website, you are not allowed to copy the website's graphics, texts, or trademarks. Intellectual property rights in the content or data incorporated into this website belong to its providers and exchange merchants.

          Not Logged In

          Log in to access more features

          FastBull Membership

          Not yet

          Purchase

          Become a signal provider
          Help Center
          Customer Service
          Dark Mode
          Price Up/Down Colors

          Log In

          Sign Up

          Position
          Layout
          Fullscreen
          Default to Chart
          The chart page opens by default when you visit fastbull.com