• Trade
  • Markets
  • Copy
  • Contests
  • News
  • 24/7
  • Calendar
  • Q&A
  • Chats
Trending
Screeners
SYMBOL
LAST
BID
ASK
HIGH
LOW
NET CHG.
%CHG.
SPREAD
SPX
S&P 500 Index
6870.39
6870.39
6870.39
6895.79
6858.28
+13.27
+ 0.19%
--
DJI
Dow Jones Industrial Average
47954.98
47954.98
47954.98
48133.54
47871.51
+104.05
+ 0.22%
--
IXIC
NASDAQ Composite Index
23578.12
23578.12
23578.12
23680.03
23506.00
+72.99
+ 0.31%
--
USDX
US Dollar Index
98.950
99.030
98.950
99.060
98.740
-0.030
-0.03%
--
EURUSD
Euro / US Dollar
1.16426
1.16443
1.16426
1.16715
1.16277
-0.00019
-0.02%
--
GBPUSD
Pound Sterling / US Dollar
1.33312
1.33342
1.33312
1.33622
1.33159
+0.00041
+ 0.03%
--
XAUUSD
Gold / US Dollar
4197.91
4197.91
4197.91
4259.16
4191.87
-9.26
-0.22%
--
WTI
Light Sweet Crude Oil
59.809
60.061
59.809
60.236
59.187
+0.426
+ 0.72%
--

Community Accounts

Signal Accounts
--
Profit Accounts
--
Loss Accounts
--
View More

Become a signal provider

Sell trading signals to earn additional income

View More

Guide to Copy Trading

Get started with ease and confidence

View More

Signal Accounts for Members

All Signal Accounts

Best Return
  • Best Return
  • Best P/L
  • Best MDD
Past 1W
  • Past 1W
  • Past 1M
  • Past 1Y

All Contests

  • All
  • Trump Updates
  • Recommend
  • Stocks
  • Cryptocurrencies
  • Central Banks
  • Featured News
Top News Only
Share

French President Macron: Nigeria Seeks French Help To Combat Insecurity

Share

Industry Source: EU Commission May Announce Package To Support Auto Industry On December 16

Share

Israel Foreign Currency Reserves $231.425 Billion In November Versus$231.954 Billion In October -Bank Of Israel

Share

[Moodeng Surges Over 43% In The Last 24 Hours, With A Current Market Cap Of $104 Million.] December 7Th, According To Gmgn Market Data, The Solana-Based Meme Coin Moodeng Surged Over 43% In The Past 24 Hours, With A Market Capitalization Currently Standing At 104 Million USD

Share

Jerusalem-German Chancellor Merz: We Have Not Discussed A Visit To Germany By Israeli Prime Minister Benjamin Netanyahu, Not An Issue At The Moment

Share

Israeli Prime Minister Netanyahu: We're Close To The Second Phase Of Trump's Gaza Plan

Share

West Africa's ECOWAS Bloc: 'Strongly Condemns' Attempted Military Coup In Benin

Share

Israeli Prime Minister Netanyahu: Political Annexation Of The West Bank Remains A Subject Of Discussion

Share

Israeli Prime Minister Netanyahu: Sovereign Power Of Security From The Jordan River To The Mediterranean Will Always Remain In Israel's Hands

Share

Israeli Prime Minister Netanyahu: We Believe There Is A Path To A Workable Peace With Our Palestinian Neighbors

Share

Israeli Prime Minister Netanyahu: I Will Meet Trump This Month

Share

Egypt's Net Foreign Reserves Rise To $50.216 Billion In November From $50.071 Billion In October

Share

Uganda Opposition Candidate Says He Was Beaten By Security Forces

Share

Benin's Foreign Minister Bakari:Large Part Of The Army And National Guard Still Loyalist And Are Controlling The Situation

Share

Russian Defence Ministry: Russian Troops Complete Capture Of Rivne In Ukraine's Donetsk Region

Share

Russian Defence Ministry: Russian Troops Carried Out Group Strike Overnight On Ukraine's Transport Infrastructure Facilities, Fuel And Energy Complexes, And Long-Range Drone Complexes

Share

Russian Defence Ministry: Russian Forces Capture Kucherivka In Ukraine's Kharkiv Region

Share

US Envoy Kellogg Says Ukraine Peace Deal Is Really Close

Share

US Embassy In India- US Under Secretary Of State For Political Affairs Allison Hooker Will Visit New Delhi And Bengaluru, India, From December 7 To 11

Share

Japan Prime Minister Takaichi: To Respond Calmly And Resolutely To The Development

TIME
ACT
FCST
PREV
Euro Zone Employment YoY (SA) (Q3)

A:--

F: --

P: --

Euro Zone GDP Final YoY (Q3)

A:--

F: --

P: --

Euro Zone GDP Final QoQ (Q3)

A:--

F: --

P: --

Euro Zone Employment Final QoQ (SA) (Q3)

A:--

F: --

P: --

Euro Zone Employment Final (SA) (Q3)

A:--

F: --

P: --
Brazil PPI MoM (Oct)

A:--

F: --

P: --

Mexico Consumer Confidence Index (Nov)

A:--

F: --

P: --

Canada Unemployment Rate (SA) (Nov)

A:--

F: --

P: --

Canada Labor Force Participation Rate (SA) (Nov)

A:--

F: --

P: --

Canada Employment (SA) (Nov)

A:--

F: --

P: --

Canada Part-Time Employment (SA) (Nov)

A:--

F: --

P: --

Canada Full-time Employment (SA) (Nov)

A:--

F: --

P: --

U.S. Personal Income MoM (Sept)

A:--

F: --

P: --

U.S. PCE Price Index YoY (SA) (Sept)

A:--

F: --

P: --

U.S. PCE Price Index MoM (Sept)

A:--

F: --

P: --

U.S. Personal Outlays MoM (SA) (Sept)

A:--

F: --

P: --

U.S. Core PCE Price Index MoM (Sept)

A:--

F: --

P: --

U.S. Core PCE Price Index YoY (Sept)

A:--

F: --

P: --

U.S. UMich 5-Year-Ahead Inflation Expectations Prelim YoY (Dec)

A:--

F: --

P: --

U.S. Real Personal Consumption Expenditures MoM (Sept)

A:--

F: --

P: --

U.S. 5-10 Year-Ahead Inflation Expectations (Dec)

A:--

F: --

P: --

U.S. UMich Current Economic Conditions Index Prelim (Dec)

A:--

F: --

P: --

U.S. UMich Consumer Sentiment Index Prelim (Dec)

A:--

F: --

P: --

U.S. UMich 1-Year-Ahead Inflation Expectations Prelim (Dec)

A:--

F: --

P: --

U.S. UMich Consumer Expectations Index Prelim (Dec)

A:--

F: --

P: --

U.S. Weekly Total Rig Count

A:--

F: --

P: --

U.S. Weekly Total Oil Rig Count

A:--

F: --

P: --

U.S. Unit Labor Cost Prelim (SA) (Q3)

--

F: --

P: --

U.S. Consumer Credit (SA) (Oct)

A:--

F: --

P: --

China, Mainland Foreign Exchange Reserves (Nov)

A:--

F: --

P: --

China, Mainland Exports YoY (USD) (Nov)

--

F: --

P: --

China, Mainland Imports YoY (CNH) (Nov)

--

F: --

P: --

China, Mainland Imports YoY (USD) (Nov)

--

F: --

P: --

China, Mainland Imports (CNH) (Nov)

--

F: --

P: --

China, Mainland Trade Balance (CNH) (Nov)

--

F: --

P: --

China, Mainland Exports (Nov)

--

F: --

P: --

Japan Wages MoM (Oct)

--

F: --

P: --

Japan Trade Balance (Oct)

--

F: --

P: --

Japan Nominal GDP Revised QoQ (Q3)

--

F: --

P: --

Japan Trade Balance (Customs Data) (SA) (Oct)

--

F: --

P: --

Japan GDP Annualized QoQ Revised (Q3)

--

F: --

P: --
China, Mainland Exports YoY (CNH) (Nov)

--

F: --

P: --

China, Mainland Trade Balance (USD) (Nov)

--

F: --

P: --

Germany Industrial Output MoM (SA) (Oct)

--

F: --

P: --

Euro Zone Sentix Investor Confidence Index (Dec)

--

F: --

P: --

Canada Leading Index MoM (Nov)

--

F: --

P: --

Canada National Economic Confidence Index

--

F: --

P: --

U.S. Dallas Fed PCE Price Index YoY (Sept)

--

F: --

P: --

U.S. 3-Year Note Auction Yield

--

F: --

P: --

U.K. BRC Overall Retail Sales YoY (Nov)

--

F: --

P: --

U.K. BRC Like-For-Like Retail Sales YoY (Nov)

--

F: --

P: --

Australia Overnight (Borrowing) Key Rate

--

F: --

P: --

RBA Rate Statement
RBA Press Conference
Germany Exports MoM (SA) (Oct)

--

F: --

P: --

U.S. NFIB Small Business Optimism Index (SA) (Nov)

--

F: --

P: --

Mexico Core CPI YoY (Nov)

--

F: --

P: --

Mexico 12-Month Inflation (CPI) (Nov)

--

F: --

P: --

Mexico PPI YoY (Nov)

--

F: --

P: --

Mexico CPI YoY (Nov)

--

F: --

P: --

U.S. Weekly Redbook Index YoY

--

F: --

P: --

Q&A with Experts
    • All
    • Chatrooms
    • Groups
    • Friends
    Connecting
    .
    .
    .
    Type here...
    Add Symbol or Code

      No matching data

      All
      Trump Updates
      Recommend
      Stocks
      Cryptocurrencies
      Central Banks
      Featured News
      • All
      • Russia-Ukraine Conflict
      • Middle East Flashpoint
      • All
      • Russia-Ukraine Conflict
      • Middle East Flashpoint
      Search
      Products

      Charts Free Forever

      Chats Q&A with Experts
      Screeners Economic Calendar Data Tools
      Membership Features
      Data Warehouse Market Trends Institutional Data Policy Rates Macro

      Market Trends

      Market Sentiment Order Book Forex Correlations

      Top Indicators

      Charts Free Forever
      Markets

      News

      News Analysis 24/7 Columns Education
      From Institutions From Analysts
      Topics Columnists

      Latest Views

      Latest Views

      Trending Topics

      Top Columnists

      Latest Update

      Signals

      Copy Rankings Latest Signals Become a signal provider AI Rating
      Contests
      Brokers

      Overview Brokers Assessment Rankings Regulators News Claims
      Broker listing Forex Brokers Comparison Tool Live Spread Comparison Scam
      Q&A Complaint Scam Alert Videos Tips to Detect Scam
      More

      Business
      Events
      Careers About Us Advertising Help Center

      White Label

      Data API

      Web Plug-ins

      Affiliate Program

      Awards Institution Evaluation IB Seminar Salon Event Exhibition
      Vietnam Thailand Singapore Dubai
      Fans Party Investment Sharing Session
      FastBull Summit BrokersView Expo
      Recent Searches
        Top Searches
          Markets
          News
          Analysis
          User
          24/7
          Economic Calendar
          Education
          Data
          • Names
          • Latest
          • Prev

          View All

          No data

          Scan to Download

          Faster Charts, Chat Faster!

          Download App
          English
          • English
          • Español
          • العربية
          • Bahasa Indonesia
          • Bahasa Melayu
          • Tiếng Việt
          • ภาษาไทย
          • Français
          • Italiano
          • Türkçe
          • Русский язык
          • 简中
          • 繁中
          Open Account
          Search
          Products
          Charts Free Forever
          Markets
          News
          Signals

          Copy Rankings Latest Signals Become a signal provider AI Rating
          Contests
          Brokers

          Overview Brokers Assessment Rankings Regulators News Claims
          Broker listing Forex Brokers Comparison Tool Live Spread Comparison Scam
          Q&A Complaint Scam Alert Videos Tips to Detect Scam
          More

          Business
          Events
          Careers About Us Advertising Help Center

          White Label

          Data API

          Web Plug-ins

          Affiliate Program

          Awards Institution Evaluation IB Seminar Salon Event Exhibition
          Vietnam Thailand Singapore Dubai
          Fans Party Investment Sharing Session
          FastBull Summit BrokersView Expo

          ISM Services Survey Soars In October To Highest Since February

          Devin

          Economic

          Summary:

          ...new-orders and prices-paid soaring.

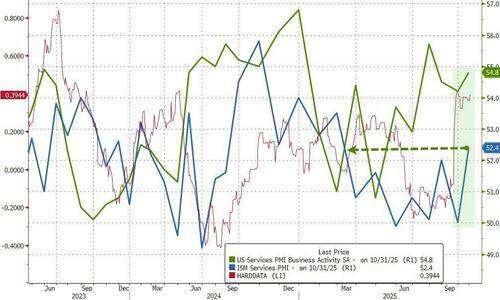
          After yesterday's mixed picture on Manufacturing (PMI up, ISM down), analysts expected both Services surveys this morning to show an upward bounce.

          • S&P Global's Services PMI disappointed but did rise from September's 54.2 to 54.8 (but that was less than expected and less than the 55.2 preliminary print)

          • ISM's Services PMI beat expectations, rising from 50.0 to 52.4, well above the 50.8 expectations.

          And this is happening amid a rise in 'hard' data (though admittedly based on housing and marginal labor data given the vacuum since the shutdown)

          Source: Bloomberg

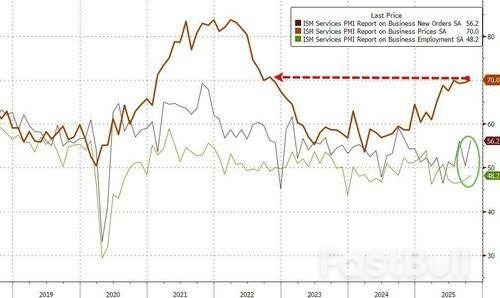
          Under the hood, Prices surged to their highest in three years, new orders expanded at their fastest pace in a year and employment improved (though remained below 50)...

          Source: Bloomberg

          "October's final PMI data add to signs that the US economy has entered the fourth quarter with strong momentum," according to Chris Williamson, Chief Business Economist at S&P Global Market Intelligence.

          "Growth in the vast services economy has picked up speed to accompany an improved performance in the manufacturing sector.

          In total, business activity is growing at a rate commensurate with GDP rising at an annualized pace of around 2.5% after a similarly solid expansion was signalled for the third quarter."

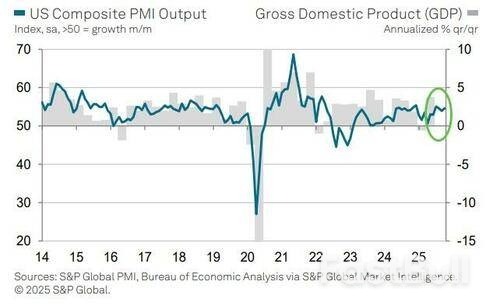
          While growth is being driven principally by the financial services and tech sectors, Williamson says the survey is also picking up signs of improving demand from consumers.

          However, the surge in prices paid is having some consequences

          "However, there are signs that new business is coming at the cost of service providers having to soak up continued high input price growth to remain competitive.

          Customers are often pushing back on price rises, especially in consumer-facing markets.

          While good news in terms of inflation, this lack of pricing power hints at weak underlying demand and lower profits. "

          Business expectations about the year ahead have also fallen sharply and are now running at one of the lowest levels seen over the past three years, as Williamson notes "signs of spending caution from customers is accompanied by heightened political and economic uncertainty."

          However, Williamson points out that lower interest rates have helped offset some of the drags to business confidence, for which the October FOMC rate cut will have likely helped further.

          Certainly nothing here to shift The Fed strongly from its easing path but Treasury yields are on the rise (likely driven by the inflation jump)

          Source: Zero Hedge

          To stay updated on all economic events of today, please check out our Economic calendar
          Risk Warnings and Disclaimers
          You understand and acknowledge that there is a high degree of risk involved in trading. Following any strategies or investment methods may lead to potential losses. The content on the site is provided by our contributors and analysts for information purposes only. You are solely responsible for determining whether any trading assets, securities, strategy, or any other product is suitable for investing based on your own investment objectives and financial situation.
          Add to Favorites
          Share

          Uk To Launch Pilot Scheme That Helps Homeless People Access Banking

          Winkelmann

          Political

          Economic

          Homeless people will for the first time be able to open accounts with the UK's five biggest banks, in a pilot scheme marking the launch of the government's financial inclusion strategy.

          The Treasury said its new national plan was meant to ensure financial services "worked for everyone", as it also revealed programmes that could help rebuild the credit scores of domestic abuse victims, support families with no savings and roll out financial education in primary schools across the UK.

          One of the key schemes will see the high street lenders Lloyds, NatWest, Barclays, Nationwide and Santander waive the need for people to have a fixed address in order to open a bank account. The move will help vulnerable people avoid the chicken-and-egg problem of needing a bank account to apply for work and rental accommodation across the UK.

          It will involve partnerships with the homelessness charity Shelter, which will vouch for prospective customers based on information on the charity's database, while accompanying individuals to face-to-face meetings at a local bank branch. The scheme expands on a partnership with HSBC, which has opened 7,000 accounts for people experiencing homelessness since its start in 2019.

          The City minister, Lucy Rigby, said: "This plan is about opening doors – helping people experiencing homelessness into work, helping survivors of abuse rebuild their credit and helping families save for a rainy day.

          "No one should be locked out of the chance to build a better future. Our strategy gives people the tools to get on and boosts the economy by supporting more people back into work."

          The Treasury said it was also rolling out plans to help victims of domestic abuse repair credit ratings that have been damaged as a result of perpetrators having forced partners to take on debt on their behalf.

          Credit agencies including Experian, Equifax and TransUnion will start reviewing how they could rescore victim's credit ratings, before reporting back to government. Charities said it would give survivors a fair chance to rebuild their financial independence.

          "For far too long, domestic abusers have stolen victim-survivors' futures – forcing them into debt and destroying their credit scores with life-shattering consequences," said Sam Smethers, the chief executive of the Surviving Economic Abuse charity.

          "This strategy provides a golden opportunity to help survivors rebuild their lives by restoring their credit scores. It's one we must seize so that credit reports reflect victim-survivors' creditworthiness, not the economic abuse they have experienced."

          The financial inclusion strategy, which follows a years-long review by a Treasury-led financial inclusion committee, is aimed at boosting support for vulnerable people who have struggled to access banking and build financial resilience.

          It comes as statistics reveal that more than 11.5 million people in the UK have less than £100 in savings, severely reducing their ability to recover from emergencies and unexpected costs such as boiler breakdowns or an extended illness.

          The Treasury's strategy will also look at how to provide support for employers hoping to offer payroll savings schemes, where money is automatically deducted from wages and placed into an accessible savings pot on the workers' behalf before it hits their main bank accounts.

          While the Treasury said these schemes have been popular with workers, some companies have been reluctant to take part for fear of inadvertently breaching minimum wage laws. The government said it would be "providing them with the certainty they need through the strategy to roll out such schemes far and wide".

          Ministers said they would also inject financial education into the national curriculum as part of broader reforms announced by the Department for Education (DfE). Teachers will soon be teaching key financial concepts such as calculating interest as part of the maths curriculum, followed by additional financial literacy in a new compulsory "citizenship" course.

          The DfE said it would ensure that primary pupils learned more about "fundamentals of money, recognising that children are now consumers often before they reach secondary school".

          Source: GUARDIAN

          To stay updated on all economic events of today, please check out our Economic calendar
          Risk Warnings and Disclaimers
          You understand and acknowledge that there is a high degree of risk involved in trading. Following any strategies or investment methods may lead to potential losses. The content on the site is provided by our contributors and analysts for information purposes only. You are solely responsible for determining whether any trading assets, securities, strategy, or any other product is suitable for investing based on your own investment objectives and financial situation.
          Add to Favorites
          Share

          Risky assets retreat on valuation concerns: US tech and Bitcoin analysis

          Adam

          Cryptocurrency

          Stocks

          US equities tumble on valuation fears

          The S&P 500 declined 1.2% overnight, while the tech-heavy Nasdaq 100 dropped 2.0%. High-profile Tesla and Nvidia bore the brunt of selling, falling 5.2% and 4.0% respectively. The sell-off highlighted growing concerns about US stock valuations after a strong year-to-date rally.
          Palantir, arguably the most expensive stock in the S&P 500 by various metrics, plunged 7.9% despite announcing positive financial results. The market's reaction underscored investor nervousness about premium valuations, even when companies deliver solid earnings beats.
          The S&P 500 now trades at 23.1 times forward price-to-earnings ratio, according to Factset data. This represents a significant premium to the five-year average of 19.9 times, and marks the highest level since September 2020.
          Valuation concerns have intensified as the index has climbed higher throughout the year. Investors are questioning whether current price levels can be sustained, particularly on stocks boosted by the AI boom if interest rates remain elevated for longer than expected.

          Strong earnings underpin market gains

          Despite the pullback, the year-to-date rally has fundamental support. Approximately 63% of S&P 500 constituents have released third quarter results as of 31 October.
          Corporate earnings have proven robust, with 83% of reporting S&P 500 constituents exceeding earnings expectations. The blended earnings growth rate currently stands at 13.8%, surpassing the growth rates achieved in both the first and second quarters.
          The earnings season has provided solid evidence that valuations, while elevated, are mostly backed by genuine profit growth rather than pure speculation.

          Technical perspective on US Tech 100

          The recent pullback represents a healthy calibration after an extended rally. From a technical analysis standpoint, we highlighted signs of weakening bullish momentum in the US Tech 100 in the latest Weekly Market Navigator, suggesting a correction could be imminent.
          The index currently sits at the support of its 20-day moving average and the lower bound of an ascending channel formed since mid-May. These technical levels will prove crucial in determining whether this represents a brief pause or something more significant.
          A 50% Fibonacci retracement of the last upward wave could take the index towards 24,635. The critical support zone lies around 23,000. A failure to maintain support at that level would significantly increase the probability of a bear market developing. Until then, the decline could be interpreted as a correction rather than a major reversal in trend.
          Figure 1: US Tech 100 index (daily) price chart

          Risky assets retreat on valuation concerns: US tech and Bitcoin analysis_1as of 5 November 2025. Past performance is not a reliable indicator of future performance.

          Cryptocurrency markets face steep losses
          Cryptocurrency markets also experienced severe turbulence overnight. Bitcoin fell 6%, briefly dropping below 100,000, while Ether plunged 11%.
          From its early October peak, Bitcoin has declined as much as 22%. Ether's drawdown proved even steeper at 36% from its highs. The cryptocurrency market officially entered a technical bear market, defined as a decline of more than 20% from recent peaks. This represents a dramatic reversal from the optimism that prevailed just weeks ago.
          The Bitcoin sell-off began immediately after the asset reached a new record high of $126,212 on 7 October. Risk-off sentiment from regional bank credit events and threats of 100% US tariffs on Chinese goods triggered the initial decline. Despite the correction, Bitcoin remains 7% higher year-to-date.
          Record liquidations reveal market stress
          Cryptocurrencies recorded their largest single-day liquidation event on 11 October, with liquidations exceeding $19 billion according to Coinglass data. These forced position closures amplified the sell-off, creating a cascade effect as leveraged traders were stopped out.
          While liquidations have since stabilised, sentiment towards Bitcoin has not recovered. Exchange-traded fund (ETF) flow data reveals net outflows of $986 million since 27 October, indicating sustained selling pressure from institutional and retail investors alike.

          Options positioning fails to show clear direction

          Options data from Deribit reveals strongly divided opinions on Bitcoin's near-term trajectory. Open interest on call options with strike prices above current levels (indicated by blue arrow in chart) slightly exceeds put options with strikes below current pricing, suggesting marginal optimism.
          However, put options with an $80,000 strike commanded the highest open interest. This clustering suggests many traders are positioning for further downside, hedging existing positions or speculating on continued weakness. The market currently has no consensus on direction.
          Figure 2: Divided views on BTC for options expiring on 28 November
          Risky assets retreat on valuation concerns: US tech and Bitcoin analysis_2

          Technical indicators suggest further downside risk

          Several technical indicators point to the possibility of additional losses ahead. The moving average convergence divergence (MACD) chart has yet to exhibit signs of improvement.
          The latest price action shows characteristics of a corrective Wave C under Elliott Wave Theory. Typically, Wave C should match or exceed the magnitude of Wave A, which would take Bitcoin below $93,750 if this pattern plays out as expected.
          June's low at $98,235 has provided some support to Bitcoin prices. However, a failure to hold this level would open up considerably more room for decline.
          Any recovery attempt will face resistance at $116,369. This level represents the starting point of the recent decline and will need to be reclaimed before bulls can feel confident about renewed upside momentum.
          Figure 3: Bitcoin (daily) price chart

          Risky assets retreat on valuation concerns: US tech and Bitcoin analysis_3as of 5 November 2025. Past performance is not a reliable indicator of future performance.

          Source: ig

          Risk Warnings and Disclaimers
          You understand and acknowledge that there is a high degree of risk involved in trading. Following any strategies or investment methods may lead to potential losses. The content on the site is provided by our contributors and analysts for information purposes only. You are solely responsible for determining whether any trading assets, securities, strategy, or any other product is suitable for investing based on your own investment objectives and financial situation.
          Add to Favorites
          Share

          US Treasuries Slip After Better-Than-Expected ADP Jobs Data

          Daniel Carter

          Bond

          Treasuries slipped as signs of resilience in the US jobs market combined with lingering concerns over future supply.
          The yield on 10-year notes rose three basis points on Wednesday to 4.11%, on course for the highest close in almost a month. Longer-dated notes led the decline, which was initially triggered by ADP Research data showing employment at US companies increased by more than forecast in October.
          "This employment report should serve to alleviate the Federal Reserve's apprehensions regarding labor market deterioration," said Florian Ielpo, head of macro, multi asset team at Lombard Odier Asset Management. He sees a trading range between 4.00% and 4.25% "for an extended period."
          The selling extended on the Treasury's refunding announcement. While officials indicated the US is not looking to boost sales of notes and bonds until well into next year, the unchanged language was widely expected and may have disappointed those betting on a more aggressive shortening of the borrowing program.
          The ADP data has taken on greater importance due to the US government shutdown. It's one of the few monthly snapshots of the labor market, making it a key input into investors' outlook for the US economy as well as Federal Reserve decision-making on interest-rate policy.

          Source: Bloomberg Europe

          Risk Warnings and Disclaimers
          You understand and acknowledge that there is a high degree of risk involved in trading. Following any strategies or investment methods may lead to potential losses. The content on the site is provided by our contributors and analysts for information purposes only. You are solely responsible for determining whether any trading assets, securities, strategy, or any other product is suitable for investing based on your own investment objectives and financial situation.
          Add to Favorites
          Share

          Three Things That Must Happen for Bitcoin to Avoid the Bear Market

          Warren Takunda

          Cryptocurrency

          Key takeaways:
          Bitcoin’s bull structure remains intact as long as it holds above a key trendline.
          Fed liquidity and US fiscal policy will likely decide Bitcoin’s next major move.
          Bitcoin tumbled more than 8% this week, slipping below the $100,000 mark for the first time since June as long-term holders offloaded roughly $45 billion worth of BTC.Three Things That Must Happen for Bitcoin to Avoid the Bear Market_1
          BTC/USD vs. Nasdaq, Dow Jones, and S&P 500 indexes year-to-date chart. Source: TradingView
          The sell-off intensified amid sharp declines in AI-related stocks, which fueled a broader risk-off shift across markets.
          Data resource The Kobeissei Letter said that BTC has “officially entered a bear market territory” after correcting by around 20% from its record high on Oct. 6.
          Nevertheless, some indicators suggest BTC can still avoid a full-blown bear market, but several things must happen first.

          Bitcoin must hold above its weekly moving average

          Bitcoin continues to trade above its 200-week exponential moving average (EMA), currently near $100,950, a key long-term support that has defined every major correction since late 2023.
          Each time BTC has tested this level following strong rallies, it has rebounded sharply to set new highs, confirming the EMA as the market’s structural floor, as shown below.Three Things That Must Happen for Bitcoin to Avoid the Bear Market_2

          BTC/USDT weekly price chart. Source: TradingView

          The current drawdown of 22% finds the BTC/USD trading pair defending the same wave support on the chart above.
          Its weekly relative strength index (RSI) is also holding at its horizontal support near 45, an area that has historically preceded major bullish reversals.
          As long as BTC maintains support above its 200-week EMA and RSI base, the broader bullish structure remains intact. A breakdown below both, however, would increase the risk of a deeper bear market retracement.

          Fed’s “stealth QE” can save Bitcoin bulls

          Former BitMEX CEO Arthur Hayes argued that US fiscal policy will eventually force the Federal Reserve to expand its balance sheet again, this time through what he calls “stealth QE.”
          The US is running deficits near $2 trillion a year, financed by Treasury debt, according to the Office of Debt Management’s Q3 2025 report.
          Traditional buyers, such as foreign central banks and US households, have not absorbed the growing Treasury supply, leaving hedge funds as the marginal buyers, as acknowledged by the Fed in a recent paper.
          These funds rely on overnight repo loans, i.e, borrowing cash against Treasurys as collateral.
          When that cash runs short, the Fed’s Standing Repo Facility (SRF) quietly steps in to lend more money, Hayes wrote, adding that it creates new dollars behind the scenes, mimicking quantitative easing.
          Hayes argued that as deficits rise, SRF usage will increase, stealthily boosting liquidity and supporting bullish outlooks for risk assets, such as Bitcoin. Hayes wrote:
          “If the Fed’s balance sheet grows, that is dollar liquidity positive, and ultimately pumps the price of Bitcoin and other cryptos.”

          No rally until the US government shutdown ends

          However, the market can stay volatile until the US government shutdown ends and liquidity conditions improve, argued Hayes.
          Luckily for the bulls, the shutdown could be resolved sooner rather than later. On Polymarket, more traders are betting on a resolution as early as next week.
          For instance, bets in favor of a resolution between Nov. 8 and Nov. 11 (orange) have jumped to 36% as of Wednesday from 22% last week. Similarly, odds of a resolution between Nov. 12 and 15 have risen to 28% from 17%.Three Things That Must Happen for Bitcoin to Avoid the Bear Market_3

          Odds of US government shutdown end. Source: Polymarket

          For now, the Treasury is issuing large amounts of debt—draining dollar liquidity—while its Treasury General Account (TGA) sits about $150 billion above its $850 billion target, meaning that money isn’t yet flowing back into the economy.Three Things That Must Happen for Bitcoin to Avoid the Bear Market_4
          This temporary liquidity squeeze is one reason behind Bitcoin’s latest decline.
          Hayes warned that many traders may misread this stagnation as the market top, just as the four-year cycle anniversary of Bitcoin’s 2021 all-time high approaches.
          But he argued that the underlying dollar plumbing suggests otherwise: once spending resumes and liquidity returns, it will mark the next leg higher.
          “The system only has two modes,” Hayes writes, “print money or destroy money. Right now, it’s the latter—but not for long.”

          Source: Cointelegraph

          Risk Warnings and Disclaimers
          You understand and acknowledge that there is a high degree of risk involved in trading. Following any strategies or investment methods may lead to potential losses. The content on the site is provided by our contributors and analysts for information purposes only. You are solely responsible for determining whether any trading assets, securities, strategy, or any other product is suitable for investing based on your own investment objectives and financial situation.
          Add to Favorites
          Share

          US Dow Jones: A star performer amid the current US AI stocks sell-off

          Adam

          Economic

          Key takeaways

          Dow Jones outperforms as major US AI stocks tumble — the Nasdaq 100 and S&P 500 dropped 2.1% and 1.2%, while the Dow fell a milder 0.5%.
          Financials show resilience with JPMorgan, Bank of America, Goldman Sachs, and Morgan Stanley holding steady or posting modest gains, signalling no systemic stress.
          Technical setup favours a rebound, with the Dow Jones holding above its 20-day moving average and bullish signals emerging from the RSI momentum indicator.
          The technology-heavy Nasdaq 100 and S&P 500 tumbled on Tuesday, 4 November, by 2.1% and 1.2% respectively, weighed down by an 8% plunge in Artificial Intelligence (AI) favourite Palantir Technologies, despite its Q3 earnings beat.
          The selloff was driven by valuation concerns, as Palantir’s price-to-sales ratio surged to 85 as of Friday, 31 October, the highest in the S&P 500. Adding to bearish sentiment, hedge fund manager Michael Burry revealed short positions against Palantir and Nvidia in his latest 13F filing.
          Notably, the US financial sector remained largely insulated from the tech rout, signaling no signs of systemic contagion. Major lenders JPMorgan Chase and Bank of America ended flat, while investment banking leaders Goldman Sachs and Morgan Stanley posted modest gains of 0.7% and 0.2%, respectively. This resilience helped the Dow Jones Industrial Average outperform, dipping by a milder 0.5% on the same day.
          Let’s now examine the technical factors, short-term (1 to 3 days) trajectory, key elements, and key levels to watch on the US Wall Street CFD Index (a proxy of the Dow Jones Industrial E-mini futures).

          S&P 500 US Financials sector underperformance has eased

          US Dow Jones: A star performer amid the current US AI stocks sell-off_1Fig. 1: Relative strength of US S&P 500 Financials & Technology sectors ETFs as of 4 Nov 2025

          The US S&P 500 Financials sector exchange-traded fund (XLF)’s six months of underperformance against the S&P 500 exchange-traded fund (SPY) has started to lose momentum, as shown by its relative strength chart, XLF/SPY (see Fig. 1).
          The ratio of XLF/SPY has started to shape a “higher low”. In contrast, the current top outperformer, the US S&P 500 Technology sector exchange-traded fund (XLK), which consists of those mega-cap technology stocks such as Nvidia, Microsoft, and Apple, has started to lose steam as indicated by the “lower high” of its relative strength chart, XLK/SPY.
          Given that the Financials sector forms the biggest weightage of around 30% in the Dow Jones Industrial Average, a reversal of fortunes in the Financials (a further slowdown of underperformance against the S&P 500) may support a positive feedback loop back into the Dow Jones.

          Preferred trend bias (1-3 days) – Potential recovery at 20-day moving average

          US Dow Jones: A star performer amid the current US AI stocks sell-off_2Fig. 2: US Wall Street 30 CFD Index minor trend as of 5 Nov 2025

          Bullish bias on the US Wall Street 30 CFD Index with 46,740 as the key medium-term pivotal support. A clearance of 47,255 increases the odds of a short-term bullish reversal towards the next intermediate resistances at 47,460 and 47,750 in the first step (see Fig. 2).

          Key elements

          The price action of the US Wall Street 30 CFD Index has formed a daily bullish “Hammer” candlestick pattern right above the upward-sloping 20-day moving average on Tuesday, 4 November, after a prior 5-day corrective decline from its current all-time high of 48,088 on 29 October.
          The hourly RSI momentum indicator has staged a breakout above its descending resistance, which suggests a potential revival of short-term bullish momentum.

          Alternative trend bias (1 to 3 days)

          A break below the 46,740 key support invalidates the bullish reversal scenario on the US Wall Street 30 CFD Index for a deeper corrective decline towards 46,350 and even 45,485 next.

          Source: marketpulse

          To stay updated on all economic events of today, please check out our Economic calendar
          Risk Warnings and Disclaimers
          You understand and acknowledge that there is a high degree of risk involved in trading. Following any strategies or investment methods may lead to potential losses. The content on the site is provided by our contributors and analysts for information purposes only. You are solely responsible for determining whether any trading assets, securities, strategy, or any other product is suitable for investing based on your own investment objectives and financial situation.
          Add to Favorites
          Share

          AI’s Capital Engine Is Overheating as Cash Turns to Credit

          Adam

          Economic

          The AI trade isn’t just a boom; it’s a capital structure. Revenues loop through the system like an ouroboros—hyperscalers sell compute to foundation models, models kick back usage to clouds, vendors book “tomorrow’s” dollars today—and the whole wheel is greased by increasingly non-traditional credit. That’s fine while free cash flow covers the tab. It stops working the moment the cash fountain slows and the bill moves from retained earnings to term sheets.
          Comically, zerohedge X posted this yesterday
          AI’s Capital Engine Is Overheating as Cash Turns to Credit_1
          Oracle’s (NYSE:ORCL) mega-pledge crystallized the turn. It wasn’t a story about software; it was a story about funding: promises sized like nations, facilities that don’t exist yet, and power draw measured in Hoover Dams. That’s not “product-market fit”; that’s balance-sheet drag racing. Once a disciplined, cash-funded oligopoly morphs into a debt-fuelled arms race, the capital cycle changes character. Equity cheerleading gives way to creditors with clipboards.
          Private credit is the new pit crew—until it isn’t. The street wants us to believe there’s infinite “dry powder” to span a trillion-plus gap in data-center buildout. But when listed proxies for that ecosystem wobble and the consumer credit gears grind, the go-go narrative meets a carry cost with teeth. If that funding axle seizes, AI capex doesn’t glide lower—it lurches. The weak link isn’t a chip shortage anymore; it’s a term-sheet shortage at non-concessionary rates.
          Beyond funding, physics intrudes. You can financial-engineer a data center; you can’t financial-engineer 4–5 gigawatts onto a stressed grid overnight. Specialized tariffs that don’t fully load new-build generation costs simply shift the invoice to everyone else, and that’s before we argue about interconnect queues measured in years. The macro punchline: what was priced as secular, self-funded productivity could look suspiciously cyclical once it collides with rate duration, credit spread beta, and electrons.
          So are we in a bubble? Maybe. But bubbles don’t pop on clever analysts’ notes; they pop when the marginal dollar gets expensive and, in this case, when the marginal kilowatt gets scarce. Until then, expect the classic saw-tooth: valuation scares, narrative rebounds, and a market that rallies hardest right after it terrifies you. The signal isn’t headlines about “AI fatigue”; it’s tightening in the funding pipes, slippage in capital expenditure (capex) guides, and utilities talking like central bankers.
          Trader’s frame:
          Watch the funding channel, not the fanfare. If private credit multiples compress while AI capex guides stretch, your factor exposure flips from “growth at any price” to “growth at any cost.” Beta feels fine—right up to the moment carry and cash-flow timing disagree. Pair that with grid-linked second-order trades (select data-center REIT spreads, power merchants, transmission capex beneficiaries) and keep a cynical eye on vendor-financed hockeysticks. In this tape, theory is cheap; kWh and coupons are not.

          Source: investing

          To stay updated on all economic events of today, please check out our Economic calendar
          Risk Warnings and Disclaimers
          You understand and acknowledge that there is a high degree of risk involved in trading. Following any strategies or investment methods may lead to potential losses. The content on the site is provided by our contributors and analysts for information purposes only. You are solely responsible for determining whether any trading assets, securities, strategy, or any other product is suitable for investing based on your own investment objectives and financial situation.
          Add to Favorites
          Share
          FastBull
          Copyright © 2025 FastBull Ltd

          728 RM B 7/F GEE LOK IND BLDG NO 34 HUNG TO RD KWUN TONG KLN HONG KONG

          TelegramInstagramTwitterfacebooklinkedin
          App Store Google Play Google Play
          Products
          Charts

          Chats

          Q&A with Experts
          Screeners
          Economic Calendar
          Data
          Tools
          Membership
          Features
          Function
          Markets
          Copy Trading
          Latest Signals
          Contests
          News
          Analysis
          24/7
          Columns
          Education
          Company
          Careers
          About Us
          Contact Us
          Advertising
          Help Center
          Feedback
          User Agreement
          Privacy Policy
          Business

          White Label

          Data API

          Web Plug-ins

          Poster Maker

          Affiliate Program

          Risk Disclosure

          The risk of loss in trading financial instruments such as stocks, FX, commodities, futures, bonds, ETFs and crypto can be substantial. You may sustain a total loss of the funds that you deposit with your broker. Therefore, you should carefully consider whether such trading is suitable for you in light of your circumstances and financial resources.

          No decision to invest should be made without thoroughly conducting due diligence by yourself or consulting with your financial advisors. Our web content might not suit you since we don't know your financial conditions and investment needs. Our financial information might have latency or contain inaccuracy, so you should be fully responsible for any of your trading and investment decisions. The company will not be responsible for your capital loss.

          Without getting permission from the website, you are not allowed to copy the website's graphics, texts, or trademarks. Intellectual property rights in the content or data incorporated into this website belong to its providers and exchange merchants.

          Not Logged In

          Log in to access more features

          FastBull Membership

          Not yet

          Purchase

          Become a signal provider
          Help Center
          Customer Service
          Dark Mode
          Price Up/Down Colors

          Log In

          Sign Up

          Position
          Layout
          Fullscreen
          Default to Chart
          The chart page opens by default when you visit fastbull.com