• 貿易
  • マーケット情報
  • コピー
  • コンテスト
  • 7x24
  • カレンダー
  • Q&A
  • チャット
フィルター
資産
最新の価格
ビッド
アスク
高値
安値
準変動
変動%
スプレッド
ソース
SPX
S&P 500 Index
7316.16
7316.16
7316.16
7450.84
7313.92
-112.61
-1.52%
--
--
DJI
Dow Jones Industrial Average
51594.44
51594.44
51594.44
52674.21
51551.18
-1152.88
-2.19%
--
--
IXIC
NASDAQ Composite Index
24442.95
24442.95
24442.95
25054.53
24425.34
-433.95
-1.74%
--
--
USDX
US Dollar Index
100.730
100.730
100.810
100.750
100.610
+0.110
+ 0.11%
--
--
EURUSD
Euro / US Dollar
1.14536
1.14536
1.14543
1.14746
1.14511
-0.00116
-0.10%
--
--
GBPUSD
Pound Sterling / US Dollar
1.33509
1.33509
1.33516
1.33751
1.33486
-0.00156
-0.12%
--
--
XAUUSD
Gold / US Dollar
4076.89
4076.89
4077.28
4100.26
4064.56
+9.54
+ 0.23%
--
--
WTI
Light Sweet Crude Oil
82.189
82.189
82.224
83.517
82.124
-1.374
-1.64%
--
--

NULL_CELL

NULL_CELL
--
NULL_CELL
--
NULL_CELL
--
さらに見る

信号プロバイダーになる

トレーディング シグナルを販売して追加収入を得てください

さらに見る

NULL_CELL

NULL_CELL

さらに見る

NULL_CELL

NULL_CELL

NULL_CELL
  • NULL_CELL
  • NULL_CELL
  • NULL_CELL
NULL_CELL
  • NULL_CELL
  • NULL_CELL
  • NULL_CELL

すべてのコンテスト

  • 全て
  • 推薦する
  • 株式
  • 暗号通貨
  • 中央銀行
  • トランプの最新情報
  • 注目のニュース
トップニュースのみを表示
共有

卵の主要先物契約は日中取引で2.00%以上下落し、現在500kgあたり4016.00元で取引されている。

共有

DBSグループ:米連邦準備制度理事会(FRB)と他中央銀行間のフォワードガイダンスの相違が、米ドルの下落要因となる可能性

共有

地元当局は、初期報告によると、ウクライナのリヴィウにある住宅ビルが被害を受けたと述べた。

共有

BNOニュースによると、ポーランドのルブリンで空襲警報が鳴り響き、ミサイルがポーランド領空に侵入したとの報告が浮上したが、これらの報告は確認されていない。

共有

地元当局者によると、ウクライナ西部リヴィウで爆発音が聞こえたとのこと。

共有

香港金融管理局(HKMA)は、(米連邦準備制度理事会の金利決定に関する)市場動向を引き続き綿密に監視していく。

共有

日本の片山さつき財務大臣:財政政策を市場に十分に説明することが重要だ

共有

米軍の攻撃による短時間の停電の後、イランのゲシュム島で電力供給が復旧した。

共有

菜種粕の主要先物契約は日中に2.00%下落し、現在2293.00元/トンで取引されている。

共有

アルミナの主要先物契約は日中に2.00%下落し、現在2,630元/トンで取引されている。

共有

国家統計局:上半期、文化企業の営業収益は着実に増加

共有

商務省報道官は、米国連邦通信委員会が外国製の電力インバーターと高度なロボット機器を「対象リスト」に掲載することを決定したことに関して、記者からの質問に答えた。

共有

オーストラリアの輸入物価指数は第2四半期に前期比5.7%上昇し、前回の0.10%上昇から大幅に上昇した。

共有

上海錫先物価格は日中取引で2.00%以上上昇し、現在423,110.00元/トンで取引されている。

共有

中国人民銀行(PBOC)は本日、7日間のリバースレポオペレーションを2,705億元実施し、買値と落札額はともに2,705億元、金利は1.40%に設定された。同時に、6,000億元のオーバーナイトリバースレポオペレーションも実施した。

共有

人民元の対米ドル基準レートは前日から7ベーシスポイント引き上げられ、6.7892となり、2023年2月10日以来の高水準に達した。

共有

日本の30年国債利回りは4.5ベーシスポイント上昇し、3.975%となった。

共有

上海銀先物主要契約は日中取引で2.00%上昇し、現在14,347.00元/kgで取引されている。

共有

フィリピンでは6月に輸入が前年同月比19.6%増加、輸出が前年同月比24.1%増加した。

共有

主要ガラス先物契約は日中に2.00%以上下落し、現在868.00元/トンで取引されている。

時間
実際の値
予測値
以前の値
インパクト(PR)
アメリカ API 週間精製石油在庫

実:--

予: --

戻: --

WTI
  • WTI
  • XAUUSD
  • XAGUSD
  • USDX
アメリカ API 週間ガソリン在庫

実:--

予: --

戻: --

WTI
  • WTI
  • XAUUSD
  • XAGUSD
  • USDX
オーストラリア 前四半期比CPI (第二四半期)

実:--

予: --

戻: --

AUDUSD
  • AUDUSD
  • XAUUSD
  • XAGUSD
  • WTI
オーストラリア CPI前月比(SA) (6月)

実:--

予: --

戻: --

オーストラリア 加重CPI前年比(SA) (6月)

実:--

予: --

戻: --

オーストラリア RBA トリム平均 CPI 前年比 (第二四半期)

実:--

予: --

戻: --

AUDUSD
  • AUDUSD
  • XAUUSD
  • XAGUSD
  • WTI
オーストラリア CPI前年比 (第二四半期)

実:--

予: --

戻: --

AUDUSD
  • AUDUSD
  • XAUUSD
  • XAGUSD
  • WTI
オーストラリア 加重CPI前年比 (6月)

実:--

予: --

戻: --

イギリス M4 マネーサプライ前年比 (6月)

実:--

予: --

戻: --

GBPUSD
  • GBPUSD
  • XAUUSD
  • XAGUSD
  • WTI
  • USDX
イギリス BOE 住宅ローンの承認 (6月)

実:--

予: --

戻: --
GBPUSD
  • GBPUSD
  • XAUUSD
  • XAGUSD
  • WTI
  • USDX
イギリス M4 マネーサプライ前月比 (6月)

実:--

予: --

戻: --

GBPUSD
  • GBPUSD
  • XAUUSD
  • XAGUSD
  • WTI
  • USDX
イギリス BOE住宅ローン融資 (6月)

実:--

予: --

戻: --
GBPUSD
  • GBPUSD
  • XAUUSD
  • XAGUSD
  • WTI
  • USDX
イタリア 平均時給前月比 (6月)

実:--

予: --

戻: --

EURUSD
  • EURUSD
  • XAUUSD
  • XAGUSD
  • WTI
  • USDX
ドイツ 10年国債入札平均 収率

実:--

予: --

戻: --

EURUSD
  • EURUSD
  • XAUUSD
  • XAGUSD
  • WTI
  • USDX
アメリカ MBA 住宅ローン申請活動指数 WOW

実:--

予: --

戻: --

USDX
  • USDX
  • XAUUSD
  • XAGUSD
  • WTI
アメリカ EIA の毎週の灯油在庫推移

実:--

予: --

戻: --

WTI
  • WTI
  • XAUUSD
  • XAGUSD
  • USDX
アメリカ EIA 週間原油輸入量の推移

実:--

予: --

戻: --

WTI
  • WTI
  • XAUUSD
  • XAGUSD
  • USDX
アメリカ EIA 週次 原油在庫変動

実:--

予: --

戻: --

WTI
  • WTI
  • XAUUSD
  • XAGUSD
  • USDX
アメリカ EIA 週次 オクラホマ州クッシング原油在庫変動

実:--

予: --

戻: --

WTI
  • WTI
  • XAUUSD
  • XAGUSD
  • USDX
アメリカ EIA 生産別週間原油需要予測

実:--

予: --

戻: --

WTI
  • WTI
  • XAUUSD
  • XAGUSD
  • USDX
アメリカ EIA 週次 ガソリン在庫変動

実:--

予: --

戻: --

WTI
  • WTI
  • XAUUSD
  • XAGUSD
  • USDX
ロシア 小売売上高前年比 (6月)

実:--

予: --

戻: --

WTI
  • WTI
  • XAUUSD
  • XAGUSD
  • USDX
ロシア 失業率 (6月)

実:--

予: --

戻: --

WTI
  • WTI
  • XAUUSD
  • XAGUSD
  • USDX
ブラジル CAGED ネット給与ジョブ (6月)

実:--

予: --

戻: --

XAUUSD
  • XAUUSD
  • XAGUSD
  • WTI
  • USDX
アメリカ FOMC金利下限(翌日物リバースレポ金利)

実:--

予: --

戻: --

XAUUSD
  • XAUUSD
  • XAGUSD
  • WTI
  • USDX
アメリカ FOMC金利上限(超過準備比率)

実:--

予: --

戻: --

XAUUSD
  • XAUUSD
  • XAGUSD
  • WTI
  • USDX
FOMC声明
FOMC記者会見
オーストラリア 建築許可MoM (SA) (6月)

実:--

予: --

戻: --
AUDUSD
  • AUDUSD
  • XAUUSD
  • XAGUSD
  • WTI
  • USDX
オーストラリア 輸入物価指数前年比 (第二四半期)

実:--

予: --

戻: --

オーストラリア 建築許可件数前年比 (SA) (6月)

実:--

予: --

戻: --

AUDUSD
  • AUDUSD
  • XAUUSD
  • XAGUSD
  • WTI
  • USDX
オーストラリア 民間建設許可MoM (SA) (6月)

実:--

予: --

戻: --

AUDUSD
  • AUDUSD
  • XAUUSD
  • XAGUSD
  • WTI
  • USDX
日本 30年国債入札利回り

--

予: --

戻: --

日本 家計消費者信頼感指数 (7月)

--

予: --

戻: --

フランス GDP速報値前年比(SA) (第二四半期)

--

予: --

戻: --

七面鳥 経済信頼感指数 (7月)

--

予: --

戻: --

ドイツ GDP速報値前年比(SA) (第二四半期)

--

予: --

戻: --

イタリア GDP速報値前年比(SA) (第二四半期)

--

予: --

戻: --

ドイツ GDP速報値前年比(SAではない) (第二四半期)

--

予: --

戻: --

ドイツ GDP速報値前四半期比(SA) (第二四半期)

--

予: --

戻: --

ユーロ圏 GDP速報値前四半期比(SA) (第二四半期)

--

予: --

戻: --
ユーロ圏 消費者信頼感指数最終版 (7月)

--

予: --

戻: --

ユーロ圏 サービス産業繁栄指数 (7月)

--

予: --

戻: --

ユーロ圏 GDP速報値前年比(SA) (第二四半期)

--

予: --

戻: --

ユーロ圏 経済信頼感指数 (7月)

--

予: --

戻: --

イタリア 四半期ごとの失業率 (SA) (6月)

--

予: --

戻: --

ユーロ圏 産業気候指数 (7月)

--

予: --

戻: --

ユーロ圏 失業率 (6月)

--

予: --

戻: --

イタリア 失業率 (SA) (6月)

--

予: --

戻: --

ユーロ圏 予想販売価格 (7月)

--

予: --

戻: --

ユーロ圏 消費者のインフレ期待 (7月)

--

予: --

戻: --

イタリア 10年BTP債券オークション平均 収率

--

予: --

戻: --

イタリア 5年BTP債券オークション平均 収率

--

予: --

戻: --

南アフリカ PPI前年比 (6月)

--

予: --

戻: --

イタリア PPI前年比 (6月)

--

予: --

戻: --

イギリス BOE MPC 投票削減

--

予: --

戻: --

イギリス BOE MPC 投票引き上げ

--

予: --

戻: --

イギリス BOE MPC 投票は変更なし

--

予: --

戻: --

イギリス 基準金利

--

予: --

戻: --

専門家によるQ&A
    • 全て
    • チャットルーム
    • グループ
    • 友達
    风神1号 flag
    风神1号 flag
    风神1号 flag
    Sonam flag
    Sonam
    ready for signal
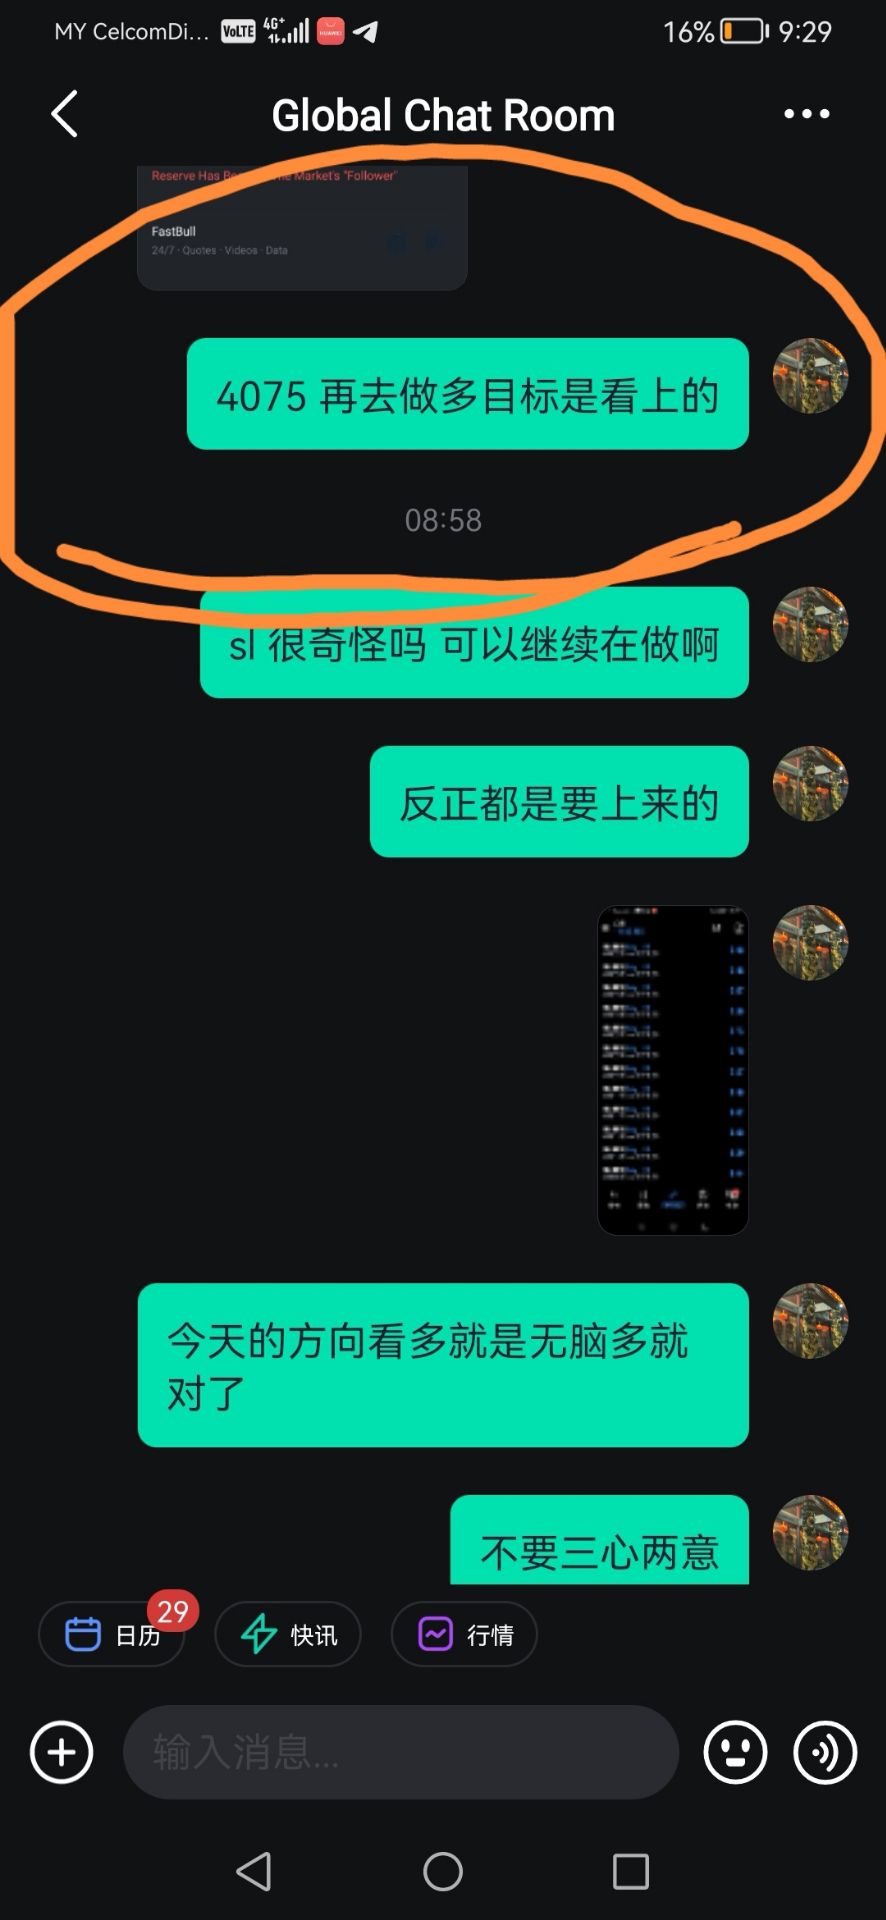
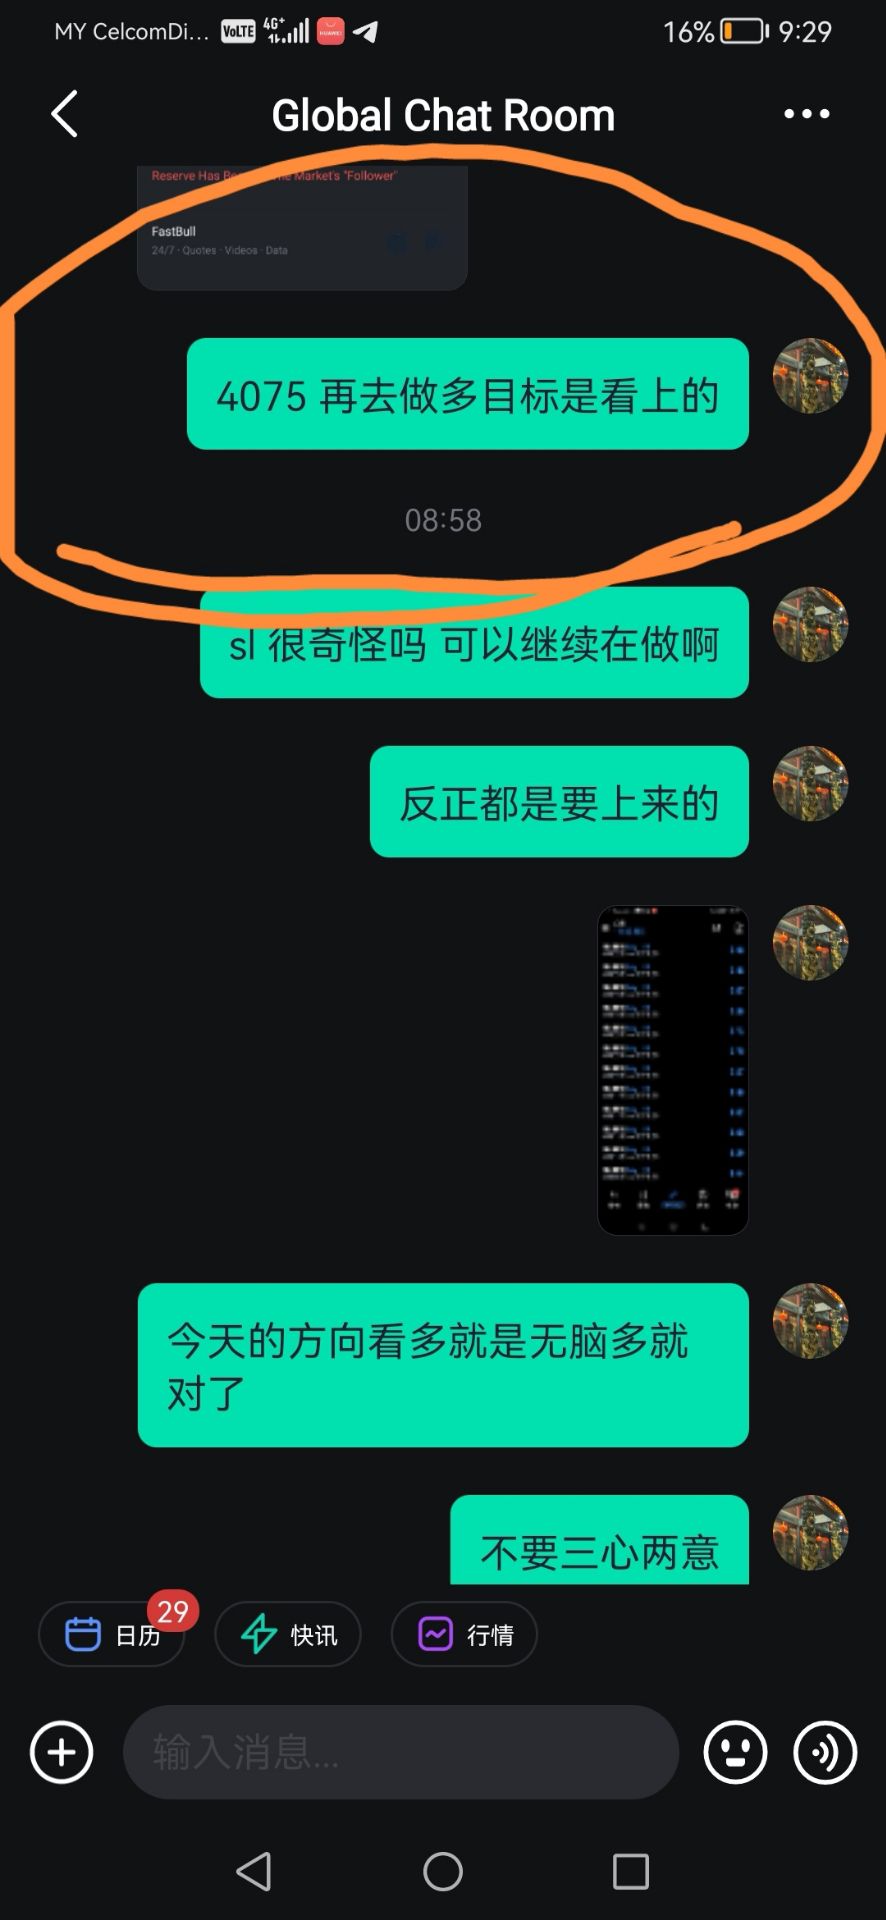
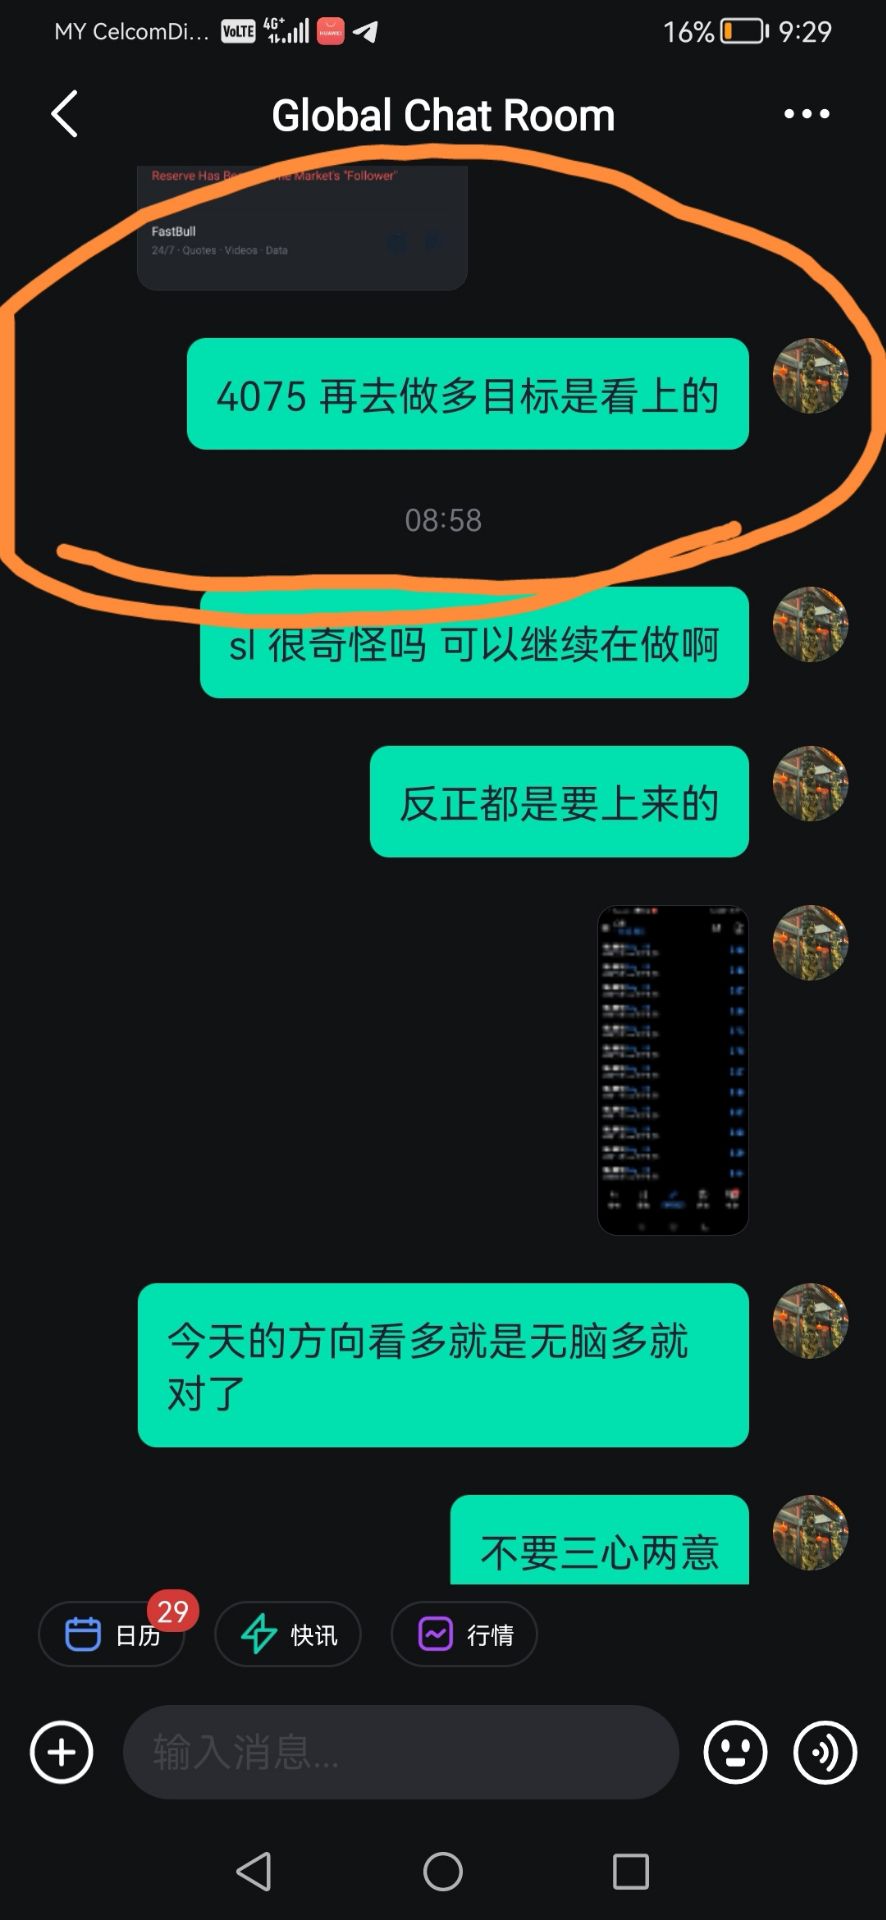
    Gold Buy Now
    风神1号 flag
    还要玩什么 最多我玩到我被踢出来啊
    Sonam flag
    Sonam
    Gold Buy Now
    Gold Buy Now 4080-4075 SL 4070 TP 4085 TP 4090 TP 4095 TP 4100 TP Open
    日昇 flag
    风神1号
    还要玩什么 最多我玩到我被踢出来啊
    Enjoy the clown show, everyone.
    风神1号 flag
    风神1号 flag
    风神1号 flag
    风神1号 flag
    风神1号 flag
    风神1号 flag
    风神1号 flag
    方向不一样的可以选择去做空
    风神1号 flag
    今天今天量你也不敢空
    风神1号 flag
    风神1号 flag
    𝐊𝐚𝐩𝐨𝐱 𝐟𝐱 𝐯𝐥𝐩 flag
    good morning everyone 👋
    𝐊𝐚𝐩𝐨𝐱 𝐟𝐱 𝐯𝐥𝐩 flag
    𝐆𝐨𝐥𝐝 1𝐇 𝐁𝐮𝐲 𝐄𝐧𝐭𝐫𝐲 𝐩𝐨𝐢𝐧𝐭: 𝟒,𝟎𝟖𝟖.𝟓𝟎 𝐓𝐏1: 𝟒,𝟏𝟎𝟎.𝟎𝟎 𝐓𝐏2: 𝟒,𝟏𝟐𝟓.𝟎𝟎 𝐓𝐏3: 𝟒,𝟏𝟓𝟎.𝟎𝟎 𝐓𝐏4: 𝟒,𝟏𝟕𝟓.𝟎𝟎 𝐒𝐋: 𝟒,𝟎𝟔𝟎.𝟎𝟎
    风神1号 flag
    这就对了
    ここに入力...
    アセット名またはコードを追加する

      一致するデータがありません

      全て
      推薦する
      株式
      暗号通貨
      中央銀行
      トランプの最新情報
      注目のニュース
      • 全て
      • ロシアとウクライナの紛争
      • 中東の火種
      • 全て
      • ロシアとウクライナの紛争
      • 中東の火種
      検索
      製品

      チャート 永遠に無料

      チャット 専門家によるQ&A
      フィルター 経済カレンダー データ 道具
      FastBull プロ 特徴
      データウェアハウス マーケットトレンド 機関のデータ 政策金利 マクロ経済

      マーケットトレンド

      投機的センチメント 注文帳 品種相関

      トップ指標

      チャート 永遠に無料
      マーケット

      金融ニュース

      7x24 分析 教育

      最新の意見

      最新アップデート

      シグナル

      コピー ランキング AIによるシグナル 信号プロバイダーになる AI評価
      コンテスト
      Brokers

      概要 トレードブローカー 評価 ランキング 規制機関 ニュース 請求
      ブローカーリスト FXブローカー比較ツール リアルタイムスプレッド比較 詐欺
      Q&A 苦情 詐欺警告ビデオ 詐欺を見抜くためのヒント
      さらに

      仕事
      活動
      採用 ファストブルについて NULL_CELL ヘルプセンター

      白いラベル

      Broker API

      データAPI

      Webプラグイン

      アフィリエイト プログラム

      受賞歴 機関評価 IB Seminar サロンイベント 展示会
      ベトナム タイ シンガポール ドバイ
      Fans Party 投資共有セッション
      FastBull サミット BrokersView エキスポ
      最近の検索
        トップの検索
          マーケット情報
          分析
          ユーザー
          7x24
          経済カレンダー
          教育
          データ
          • 名前
          • 最新値
          • 戻る

          すべて見る

          データがありません

          スキャンしてダウンロード

          Faster Charts, Chat Faster!

          ダウンロード
          • English
          • Español
          • العربية
          • Bahasa Indonesia
          • Bahasa Melayu
          • Tiếng Việt
          • ภาษาไทย
          • Français
          • Italiano
          • Türkçe
          • Русский язык
          • 简中
          • 繁中
          口座を開設
          検索
          製品
          チャート 永遠に無料
          マーケット
          金融ニュース
          シグナル

          コピー ランキング AIによるシグナル 信号プロバイダーになる AI評価
          コンテスト
          Brokers

          概要 トレードブローカー 評価 ランキング 規制機関 ニュース 請求
          ブローカーリスト FXブローカー比較ツール リアルタイムスプレッド比較 詐欺
          Q&A 苦情 詐欺警告ビデオ 詐欺を見抜くためのヒント
          さらに

          仕事
          活動
          採用 ファストブルについて NULL_CELL ヘルプセンター

          白いラベル

          Broker API

          データAPI

          Webプラグイン

          アフィリエイト プログラム

          受賞歴 機関評価 IB Seminar サロンイベント 展示会
          ベトナム タイ シンガポール ドバイ
          Fans Party 投資共有セッション
          FastBull サミット BrokersView エキスポ

          2026年版、無料株式スクリーナーベスト10:テストと比較

          ジャン・チェン

          株式

          概要:

          2026年版、テスト済みで比較もされた最高の無料株式スクリーナーをご紹介します。実際の制限事項、データ遅延、そしてあなたの取引・投資スタイルに合ったツールを見つけてください。

          無料の株式スクリーナーは、投資家が大規模な市場から実用的な銘柄を絞り込むために広く利用されていますが、すべての「無料」ツールが同じデータ量や速度を提供しているわけではありません。このガイドでは、2026年版のベスト無料株式スクリーナーをテストおよび比較し、フィルターの制限、データ遅延、さまざまな取引スタイルや投資スタイルに最適なツールに焦点を当て、実際の使用においてどのプラットフォームが優れているかを明らかにします。
          2026年版、無料株式スクリーナーベスト10:テストと比較_1

          自分に最適な無料株式スクリーナーの選び方

          最適な無料株式スクリーナーを選ぶ際に重要なのは、機能一覧が最も長いツールを探すことではありません。より良いアプローチは、自分のデータニーズ、市場の焦点、そして投資スタイルに合ったスクリーナーを選ぶことです。

          • まずデータの遅延を確認してください。無料のスクリーナーは遅延した価格データを使用することが多いため、リアルタイムでの取引実行よりもアイデア創出に適しています。例えば、Finvizの無料版では、遅延した米国市場データを使用しています。
          • 戦略に合わせてツールを選びましょう。デイトレーダーはより速いデータとテクニカルシグナルを必要とし、スイングトレーダーは通常、遅延データでも対応できます。長期投資家は、バリュエーション、収益、収益性、財務履歴を優先すべきです。
          • 市場カバレッジを確認しましょう。一部のツールは主に米国株に焦点を当てていますが、他のツールはより広範なグローバル市場や特定の国際市場を対象としています。NASDAQ、NYSE、AMEX以外の銘柄をスクリーニングしたい場合は、この点が重要になります。
          • 制限事項を確認してください。無料のスクリーナーでは、エクスポート、保存済みスクリーニング、高度なフィルター、リアルタイムフィード、過去の財務データ、または表示できるレポートの数に制限がある場合があります。
          • 必要に応じて複数のスクリーナーを使用しましょう。多くの投資家は、米国株のアイデアを素早く見つけるためにFinvizを、テクニカルチャートに基づいたワークフローのためにTradingViewを、そしてより詳細な企業調査のためにStock AnalysisやWallStreetZenなどのファンダメンタルツールを使用しています。

          つまり、最適な無料株式スクリーナーとは、あなたのワークフローに適合し、かつあなたの戦略にとって最も重要なデータ、市場、機能の制限を隠すことなく利用できるものです。

          1. TradingViewの株式スクリーナー

          TradingView Stock Screenerは、テクニカル分析やファンダメンタル分析のフィルターを用いて世界の市場をスキャンするために広く利用されていますが、無料版にはデータ処理速度や実行時のユースケースにおいて明らかな制限があります。

          主な無料機能と制限事項

          • 幅広いフィルター範囲:株式、ETF、および複数の資産クラスに関するテクニカル指標、ファンダメンタルズ、およびバリュエーション指標が含まれます。
          • グローバル市場へのアクセス:主要な国際取引所における数千もの金融商品を網羅しています。
          • データ遅延:リアルタイム取引所データが別途有効になっていない限り、無料ユーザーは一部の取引所について遅延した価格データまたは終値データを受け取る場合があります。
          • 機能制限:高度なアラート、より詳細な分析、および強化されたデータフィードは、有料プランでのみ利用可能です。

          長所と短所

          • 長所:強力なフィルタリングシステム、統合されたチャートツール、幅広い市場カバレッジ。
          • 短所:無料プランではリアルタイムデータが限られており、主要な高度な機能は有料プランに加入しないと利用できない。

          最適な用途

          リアルタイムでの取引実行ではなく、アイデア創出やテクニカル分析のためにスクリーニングを活用するスイングトレーダーや長期投資家に最適です。

          2. Finviz

          Finviz is one of the most widely used free stock screeners for U.S. equity markets, known for its fast interface and simple filtering system. Its strength is speed and simplicity, but its limitations become clear when you look at market coverage and data access.

          Key Free Features and Limits

          • Market coverage: Limited to U.S. listed stocks, including NASDAQ, NYSE, and AMEX. It does not support direct screening of most international markets.
          • Data delay: Free version typically provides delayed quotes around 15 minutes, making it less suitable for real-time intraday decision-making.
          • Filter system: Offers a large set of screening filters covering fundamentals, technical indicators, and valuation metrics.
          • Export limitations: Advanced export features such as detailed data downloads, including CSV exports, are restricted to the paid Elite version.

          Pros and Cons

          • Pros: Very fast screening interface, strong visual usability, and widely recognized for efficient U.S. stock filtering.
          • Cons: Limited to U.S. markets, delayed data in free version, and key export and advanced features locked behind paywall.

          Best For

          Finviz is best suited for U.S.-focused traders who need fast stock screening for idea generation and shortlisting, especially swing traders and active investors who do not rely on real-time data precision.

          3. Yahoo Finance Stock Screener

          Yahoo Finance Stock Screener is primarily designed for beginners who need a simple and accessible way to filter stocks, but it is not built for advanced trading strategies or real-time market analysis.

          Key Free Features and Limits

          • Beginner-friendly interface: Simple layout that allows users to quickly filter stocks based on common metrics such as price, market cap, and P/E ratio.
          • Basic screening depth: Suitable for simple stock discovery, but less advanced than dedicated technical screening tools used in active trading workflows.
          • No advanced intraday tools: Does not support detailed breakout scanning, relative volume alerts, or high-frequency technical signal filtering.
          • Limited strategy flexibility: Compared with dedicated screeners like Finviz or TradingView, it offers fewer customization options for complex technical screening strategies.

          Pros and Cons

          • Pros: Very easy to use, strong brand trust, and fully integrated with Yahoo Finance news and fundamental data ecosystem.
          • Cons: Limited technical screening depth, weaker active-trading capabilities, and not suitable for advanced intraday trading strategies.

          Best For

          Yahoo Finance Stock Screener is best for beginners and long-term investors who prioritize simplicity and fundamental stock discovery over advanced technical screening or real-time trading signals.

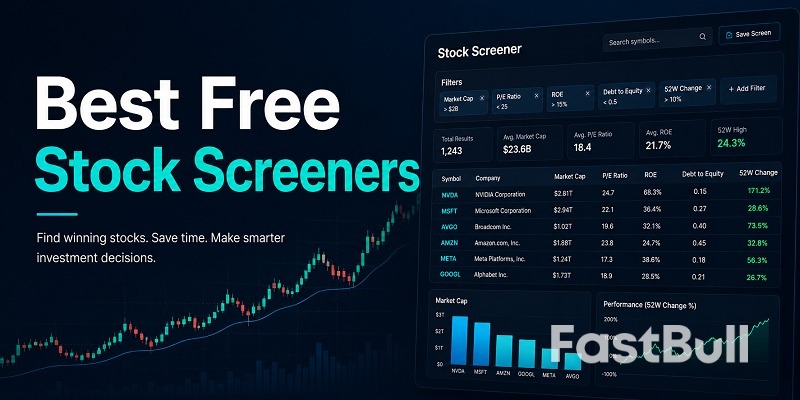
          4. FastBull Stock Screener

          FastBull Stock Screener stands out from typical U.S.-only free screeners by combining stock screening with an integrated research environment — charts, news, financial indicators, and technical analysis in one place, across both U.S. and Vietnamese markets.

          Key Free Features and Limits

          • U.S. and Vietnam screening: FastBull supports stock screening for U.S. and Vietnamese equities, making it useful for investors who want exposure beyond a purely U.S.-only workflow.
          • Integrated research workflow: Investors can move from screening results to price charts, market news, financial indicators, and technical analysis without switching between multiple platforms.
          • Emerging-market angle: FastBull is especially useful for users who want to monitor selected international and emerging market opportunities, rather than only scanning NASDAQ, NYSE, and AMEX stocks.
          • Flexible idea generation: The screener is suitable for building watchlists, comparing stocks, and identifying potential opportunities across different market environments.

          Pros and Cons

          • Pros: Strong fit for cross-market stock discovery, useful U.S. and Vietnam coverage, integrated charts and market news, and a smoother research workflow than many basic free screeners.
          • Cons: Current screener coverage is limited to two markets, which is narrower than global platforms like TradingView or Koyfin.

          Best For

          FastBull Stock Screener is best suited for investors who want a free, practical stock screening tool with U.S. and Vietnam coverage, especially those looking for international diversification ideas and a smoother research workflow beyond basic watchlists.

          5. Zacks Stock Screener

          Zacks Stock Screener is built around a proprietary ranking system that focuses on earnings-based performance signals rather than simple technical or price-based filters, making it more strategy-driven than most free screeners.

          Key Free Features and Limits

          • Zacks Rank integration: Uses a proprietary 1–5 ranking system that evaluates stocks based on earnings estimate revisions, a core factor in Zacks’ investment methodology.
          • Style Score system: Combines Value, Growth, and Momentum scores to help investors filter stocks based on different investment strategies.
          • Custom screener access: Free users can build and use a basic custom screener with standard filters across valuation, fundamentals, and performance metrics.
          • Premium gating: More advanced tools such as pre-built premium screens, Focus List strategies, and deeper research features are restricted to paid plans.

          Pros and Cons

          • Pros: Strong earnings-focused ranking system, structured investment framework, and useful for systematic stock selection.
          • Cons: Many advanced screening strategies are locked behind premium subscription, and the system is more oriented toward medium-term investing than intraday trading.

          Best For

          Zacks Stock Screener is best suited for fundamental investors who prioritize earnings momentum and structured ranking systems over technical chart-based screening, especially those following value, growth, or momentum strategies.

          6. Stock Analysis Stock Screener

          Stock Analysis Stock Screener is designed for users who want a clean, beginner-friendly interface for screening stocks, combining basic fundamental metrics with an easy-to-navigate layout. Its strength is simplicity, but deeper historical data access is limited in the free version.

          Key Free Features and Limits

          • Simple interface: Focuses on clarity and ease of use, making it suitable for beginners who are new to stock screening.
          • Broad fundamental metrics: Includes standard metrics such as valuation ratios, profitability indicators, financial health data, and other screening indicators for stock selection.
          • Limited historical depth: Extended financial history and deeper long-term datasets may be less suitable for institutional-style research compared with premium platforms.
          • Lightweight workflow: Optimized for quick screening and idea generation rather than deep institutional-style analysis.

          Pros and Cons

          • Pros: Very clean UI, easy learning curve, and suitable for quick stock discovery without complexity.
          • Cons: Limited advanced screening depth compared with professional terminals, less strategy automation, and less suitable for complex multi-factor workflows.

          Best For

          Stock Analysis Stock Screener is best suited for beginner and lightweight investors who want to quickly explore stocks and transition gradually into deeper fundamental analysis before upgrading to more advanced tools.

          7. Koyfin

          Koyfin is a more advanced stock screening and analytics platform designed for investors who need deeper market visibility than typical free beginner screeners. It combines global screening, charting, and financial data tools, but its free tier is intentionally limited for professional-scale use cases.

          Key Free Features and Limits

          • Global stock screener: Provides access to international equities screening across multiple regions, making it more global than most U.S.-focused free tools.
          • Watchlists and tracking tools: Users can build watchlists to monitor stocks and macro themes in a structured way.
          • Advanced charting: Includes institutional-style charts and financial visualization tools that go beyond basic screener interfaces.
          • Workflow limitations: Free users may face restrictions on advanced workflows, saved templates, exports, or deeper platform usage depending on the current plan structure.
          • Financial history limits: Access to deeper financial history and professional-scale datasets may require paid plans, which reduces deep fundamental analysis capability for free-only users.

          Pros and Cons

          • Pros: Strong global coverage, professional-grade interface, useful watchlist system, and more advanced analytics compared to beginner-focused screeners.
          • Cons: Some advanced features are limited in free plan, deeper financial history may require paid access, and it has a steeper learning curve compared to simple tools like Yahoo Finance or Stock Analysis.

          Best For

          Koyfin is best suited for intermediate to advanced investors who want a more institutional-style workflow, especially those who analyze multiple markets and require more structured financial data than beginner screeners provide.

          8. Simply Wall St

          Simply Wall St is a visually driven stock analysis platform designed to simplify fundamental investing by turning financial data into intuitive graphics, making it easier for investors to evaluate companies without relying on traditional tables and ratios.

          Key Free Features and Limits

          • Snowflake visualization: Core feature that summarizes a stock’s valuation, financial health, growth, and dividends in a single visual dashboard.
          • Simplified company reports: Provides easy-to-read breakdowns of fundamentals, suitable for non-technical investors.
          • Limited report access: Free users may face limits on how many full company reports or deeper analysis features they can access, depending on the current plan structure.
          • Restricted screener access: Full screening capabilities are limited in the free plan compared to paid tiers, especially for building custom multi-factor screens.

          Pros and Cons

          • Pros: Extremely user-friendly interface, strong visual storytelling via Snowflake model, and ideal for quick fundamental understanding without financial jargon.
          • Cons: Limited free access, reduced screening flexibility in free version, and less suitable for advanced or quantitative investors.

          Best For

          Simply Wall St is best suited for visual-oriented long-term investors who prefer simplified, graphics-based analysis over traditional financial tables, especially those who want quick company evaluation without deep technical screening.

          9. MarketWatch Stock Screener

          MarketWatch Stock Screener is designed as a lightweight entry-level tool that prioritizes simplicity and news integration over advanced screening depth, making it more of a discovery and research gateway than a professional screening platform.

          Key Free Features and Limits

          • Minimal filter set: Offers a small number of core screening inputs, including price, volume, market cap, P/E ratio, and technical filters.
          • Beginner-oriented design: Simplified structure intended for users who are new to stock markets and need basic filtering without complex setup.
          • Strong news integration: Screening results are tightly connected to MarketWatch news articles, analyst commentary, and related market context for each stock.
          • Limited screening depth: Lacks advanced technical filters such as breakout signals, relative volume analysis, or multi-factor screening logic.

          Pros and Cons

          • Pros: Extremely easy to use, strong integration with financial news and analysis content, and useful for initial stock discovery.
          • Cons: Very limited screening capabilities, not suitable for technical traders or strategy-based screening, and lacks customization depth.

          Best For

          MarketWatch Stock Screener is best suited for first-time investors who want a simple entry point into stock screening combined with immediate access to news, analyst opinions, and market context rather than advanced trading analysis.

          10. WallStreetZen Stock Screener

          WallStreetZen Stock Screener is built for long-term fundamental investors who prefer structured stock evaluation over technical or intraday trading tools. Its core system, Zen Ratings, simplifies complex financial analysis into a single score-based framework.

          Key Free Features and Limits

          • Zen Ratings system: Assigns stocks a composite rating based on approximately 115 fundamental factors, including valuation, growth, profitability, risk, and AI-driven analysis.
          • Due Diligence Score: Free users can view structured analysis for selected stocks, providing insight into company quality and risk profile.
          • Limited screening functionality: Some custom screener creation, saved screening strategies, or deeper analysis features may be restricted in the free version.
          • Focus on fundamentals: Designed primarily for long-term investing decisions rather than short-term trading signals or technical chart-based strategies.

          Pros and Cons

          • Pros: Strong fundamental scoring system, simplified decision-making framework, and useful for identifying long-term quality stocks.
          • Cons: Limited free access to deep analysis, some advanced workflows require paid access, and not suitable for day trading or technical trading workflows.

          Best For

          WallStreetZen is best suited for long-term fundamental investors who want a simplified, score-based approach to stock selection and prefer structured quality ratings over real-time or technical screening tools.

          Free Stock Screener Comparison Table

          This comparison highlights the Best Free Stock Screeners based on the factors that actually impact decision-making: filter depth, data delay, and most importantly, market coverage.

          ScreenerFilter DepthData DelayMarket Coverage
          TradingViewHighEnd-of-day / delayed for some markets unless real-time data is enabledGlobal multi-asset markets
          FinvizHighAround 15 min delayUS (NASDAQ / NYSE / AMEX)
          Yahoo FinanceLow to MediumDelayedUS + selected global exposure
          FastBullMediumVaries by marketUS + Vietnam
          KoyfinHighDelayed / mixed depending on market and planGlobal coverage
          Stock AnalysisMedium to HighFrequent updates, not positioned as a real-time trading toolUS + Global
          Simply Wall StMediumDelayedGlobal
          MarketWatchVery Low to LowDelayedUS-focused
          ZacksMediumDelayedUS stocks
          WallStreetZenMediumDelayedUS stocks

          FAQs About Free Stock Screeners

          Can I use ChatGPT as a stock screener?

          No, ChatGPT cannot function as a real-time stock screener. It does not have live market data or direct access to screening databases, so it cannot filter stocks dynamically.

          Is Finviz the best free stock screener?

          Finviz is one of the best free stock screeners for U.S. markets. It is especially strong for fast filtering, but it is limited to U.S. exchanges and delayed data.

          Which AI is best for stock screening?

          株式スクリーニングに最適な単一のAIは存在しない。なぜなら、スクリーニングには言語モデルだけでなく、構造化された市場データが必要だからである。ほとんどの「AIスクリーナー」は依然として、従来の金融データベースとランキングアルゴリズムを組み合わせたものに依存している。

          TradingViewはFinvizより優れていますか?

          TradingViewはテクニカルチャート分析とグローバル市場の網羅性において優れています。一方、Finvizは米国市場に特化した迅速な銘柄選定に優れているため、どちらを選ぶかはあなたの取引スタイルによって異なります。

          無料の株式スクリーニングツールは正確ですか?

          はい、ただし、遅延型で非組織的な利用ケースに限ります。無料のスクリーニングツールはアイデア創出においては概ね正確ですが、リアルタイムでの精度や高度なデータ分析能力に欠ける場合が多いです。

          結論

          最適な無料株式スクリーナーは、単一の「最高」ツールではなく、トレーディングスタイル、必要なデータ、そして注目する市場によって異なります。デイトレーダーやテクニカル分析を行うユーザーはTradingViewやFinvizを優先すべきでしょう。初心者にはYahoo Financeがより適しています。米国とベトナムの株式スクリーニングと幅広い市場調査ツールを求める投資家はFastBullを検討すべきです。一方、長期的なファンダメンタル投資家にはWallStreetZenやStock Analysisが最適です。

          「リスク警告と投資免責事項」
          あなたはトレードにおける戦略には高いリスクがあることを理解し認識する必要があります。 戦略や投資方法に従うことは損失の可能性があります。 このサイトのコンテンツは情報提供のみを目的として投稿者およびアナリストによって提供されています。投資目的と財務状況に基づいて、取引資産、証券、戦略、またはその他の製品があなたに適しているかどうかを判断する責任はあなただけにあります。
          お気に入り
          共有
          FastBull
          Copyright © 2026 FastBull Ltd

          728 RM B 7/F GEE LOK IND BLDG NO 34 HUNG TO RD KWUN TONG KLN HONG KONG

          TelegramInstagramTwitterfacebooklinkedin
          App Store Google Play Android Windows
          製品
          チャート

          チャット

          専門家によるQ&A
          フィルター
          経済カレンダー
          データ
          道具
          FastBull プロ
          特徴
          関数
          マーケット情報
          コピー取引
          AIによるシグナル
          コンテスト
          7x24
          分析
          教育
          会社
          採用
          ファストブルについて
          お問い合わせ
          NULL_CELL
          ダウンロード FastBull
          ヘルプセンター
          フィードバック
          ユーザー規約
          プライバシーポリシー
          個人情報保護声明
          仕事

          白いラベル

          Broker API

          データAPI

          Webプラグイン

          ポスターメーカー

          アフィリエイト プログラム

          リスク開示

          株式、FX、コモディティ、先物、債券、ETF、仮想通貨などの金融資産を取引する際の損失のリスクは大きなものになる可能性があります。ブローカーに預け入れた資金が完全に失われる可能性があります。したがって、お客様の状況と財政的資源に照らして、そのような取引が適しているかどうかを慎重に検討していただく必要があります.

          十分なデューデリジェンスを実施するか、ファイナンシャルアドバイザーに相談することなく、投資を検討するべきではありません。お客様の財務状況や投資ニーズを把握していないため、当社の ウェブコンテンツはお客様に適しない可能性があります。当社の財務情報には遅延があったり、不正確な情報が含まれている可能性があるため、取引や投資に関する決定については、お客様が全責任を負う必要があります。当社はお客様の資本の損失に対して責任を負いません。

          ウェブサイトから許可を得ずに、ウェブサイトのグラフィック、テキスト、または商標をコピーすることはできません。このウェブサイトに組み込まれているコンテンツまたはデータの知的財産権は、そのプロバイダーおよび交換業者に帰属します。

          ログインしていません

          ログインしてさらに多くの機能にアクセス

          ブローカーに接続
          信号プロバイダーになる
          ヘルプセンター
          顧客サービス
          ダークモード
          価格の上昇/下降の色

          サインイン

          サインアップ

          位置
          レイアウト
          フルスクリーン
          デフォルトをチャートに設定
          fastbull.com を訪問すると、デフォルトでチャートページが開きます