Markets
News
Analysis
User
24/7
Economic Calendar
Education
Data
- Names
- Latest
- Prev


Signal Accounts for Members
All Signal Accounts
All Contests


Euro Zone Employment YoY (SA) (Q3)A:--
F: --
P: --
Euro Zone GDP Final YoY (Q3)A:--
F: --
P: --
Euro Zone GDP Final QoQ (Q3)A:--
F: --
P: --
Euro Zone Employment Final QoQ (SA) (Q3)A:--
F: --
P: --
Euro Zone Employment Final (SA) (Q3)A:--
F: --
Brazil PPI MoM (Oct)A:--
F: --
P: --
Mexico Consumer Confidence Index (Nov)A:--
F: --
P: --
Canada Unemployment Rate (SA) (Nov)A:--
F: --
P: --
Canada Labor Force Participation Rate (SA) (Nov)A:--
F: --
P: --
Canada Employment (SA) (Nov)A:--
F: --
P: --
Canada Part-Time Employment (SA) (Nov)A:--
F: --
P: --
Canada Full-time Employment (SA) (Nov)A:--
F: --
P: --
U.S. Personal Income MoM (Sept)A:--
F: --
P: --
U.S. PCE Price Index YoY (SA) (Sept)A:--
F: --
P: --
U.S. PCE Price Index MoM (Sept)A:--
F: --
P: --
U.S. Personal Outlays MoM (SA) (Sept)A:--
F: --
P: --
U.S. Core PCE Price Index MoM (Sept)A:--
F: --
P: --
U.S. Core PCE Price Index YoY (Sept)A:--
F: --
P: --
U.S. UMich 5-Year-Ahead Inflation Expectations Prelim YoY (Dec)A:--
F: --
P: --
U.S. Real Personal Consumption Expenditures MoM (Sept)A:--
F: --
P: --
U.S. 5-10 Year-Ahead Inflation Expectations (Dec)A:--
F: --
P: --
U.S. UMich Current Economic Conditions Index Prelim (Dec)A:--
F: --
P: --
U.S. UMich Consumer Sentiment Index Prelim (Dec)A:--
F: --
P: --
U.S. UMich 1-Year-Ahead Inflation Expectations Prelim (Dec)A:--
F: --
P: --
U.S. UMich Consumer Expectations Index Prelim (Dec)A:--
F: --
P: --
U.S. Weekly Total Rig CountA:--
F: --
P: --
U.S. Weekly Total Oil Rig CountA:--
F: --
P: --
U.S. Unit Labor Cost Prelim (SA) (Q3)--
F: --
P: --
U.S. Consumer Credit (SA) (Oct)A:--
F: --
P: --
China, Mainland Foreign Exchange Reserves (Nov)A:--
F: --
P: --
China, Mainland Exports YoY (USD) (Nov)--
F: --
P: --
China, Mainland Imports YoY (CNH) (Nov)--
F: --
P: --
China, Mainland Imports YoY (USD) (Nov)--
F: --
P: --
China, Mainland Imports (CNH) (Nov)--
F: --
P: --
China, Mainland Trade Balance (CNH) (Nov)--
F: --
P: --
China, Mainland Exports (Nov)--
F: --
P: --
Japan Wages MoM (Oct)--
F: --
P: --
Japan Trade Balance (Oct)--
F: --
P: --
Japan Nominal GDP Revised QoQ (Q3)--
F: --
P: --
Japan Trade Balance (Customs Data) (SA) (Oct)--
F: --
P: --
Japan GDP Annualized QoQ Revised (Q3)--
F: --
China, Mainland Exports YoY (CNH) (Nov)--
F: --
P: --
China, Mainland Trade Balance (USD) (Nov)--
F: --
P: --
Germany Industrial Output MoM (SA) (Oct)--
F: --
P: --
Euro Zone Sentix Investor Confidence Index (Dec)--
F: --
P: --
Canada Leading Index MoM (Nov)--
F: --
P: --
Canada National Economic Confidence Index--
F: --
P: --
U.S. Dallas Fed PCE Price Index YoY (Sept)--
F: --
P: --
U.S. 3-Year Note Auction Yield--
F: --
P: --
U.K. BRC Overall Retail Sales YoY (Nov)--
F: --
P: --
U.K. BRC Like-For-Like Retail Sales YoY (Nov)--
F: --
P: --
Australia Overnight (Borrowing) Key Rate--
F: --
P: --
RBA Rate Statement
RBA Press Conference
Germany Exports MoM (SA) (Oct)--
F: --
P: --
U.S. NFIB Small Business Optimism Index (SA) (Nov)--
F: --
P: --
Mexico Core CPI YoY (Nov)--
F: --
P: --
Mexico 12-Month Inflation (CPI) (Nov)--
F: --
P: --
Mexico PPI YoY (Nov)--
F: --
P: --
Mexico CPI YoY (Nov)--
F: --
P: --
U.S. Weekly Redbook Index YoY--
F: --
P: --


No matching data
Latest Views
Latest Views
Trending Topics
Top Columnists
Latest Update
White Label
Data API
Web Plug-ins
Affiliate Program
View All

No data
An ascending triangle is a chart pattern traders rely on to identify potential breakouts and further price movements. Recognised for its versatility, this pattern can signal trend continuations across
An ascending triangle is a chart pattern traders rely on to identify potential breakouts and further price movements. Recognised for its versatility, this pattern can signal trend continuations across all types of markets, including stocks, forex, commodities, and cryptocurrencies*. In this article, we’ll break down how to spot and trade this formation.
An ascending or rising triangle is a bullish chart pattern that usually signals a trend continuation. It is framed by two trendlines. The upper line connects highs placed at almost the same level, while the lower line is angled and connects higher lows.The triangle’s appearance is explained as follows: buyers try to push the price up, but they meet a strong resistance level, so the price rebounds. Still, buyers have strength, which is reflected in higher lows. Therefore, they continue pushing the price until it breaks above the resistance level. The period during which the price bounces back and forth between the two lines depends on the timeframe. On daily charts, the triangle can be in place for over a week.
Note: The ascending triangle is a continuation chart pattern but sometimes it can be used as a reversal signal. It happens when the ascending triangle occurs in a downtrend. It’s the biggest challenge of all the triangles.The rising triangle is one of the setups in the triangle group. There are also descending and symmetrical formations.
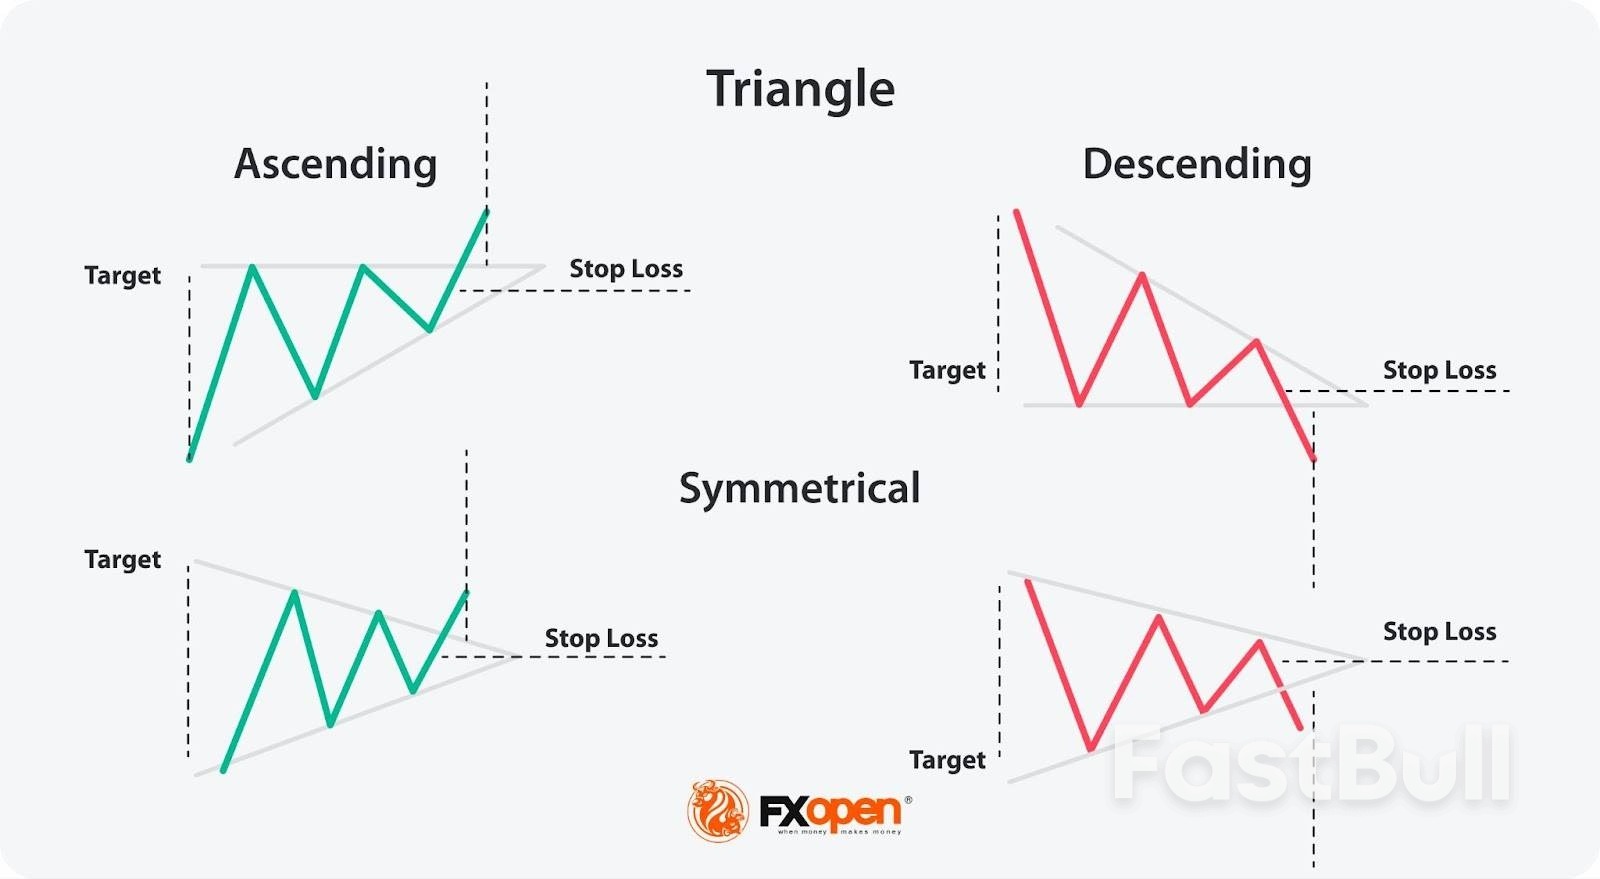
Ascending, Descending, and Symmetrical Triangles: The Differences
The triangle group of patterns comprises ascending, descending, and symmetrical formations.The ascending triangle is a bullish formation and the descending triangle is bearish. At the same time, the symmetrical triangle is a bilateral setup that signals a rise and a fall in the price.To distinguish between them, traders draw trendlines. In a rising triangle pattern, an upper trendline is horizontal and connects equal or almost equal highs, while the lower trendline is rising as it connects higher lows. In a descending or falling triangle pattern, the lower trendline is horizontal and connects equal or almost equal lows, while the upper trendline declines, going through lower highs. A symmetrical triangle has a falling upper line that connects lower highs and a rising lower line that connects upper lows.

It’s quite easy to identify the formation on a chart. Still, there are a few rules that may help a trader determine its strength.
The rising triangle pattern is usually considered a continuation setup formed in an uptrend. Still, if the ascending triangle is in a downtrend, it may signal a trend reversal. The trading rules will be the same in both cases.
As with most chart patterns, triangles have specific rules that help traders place entry and exit points.
The theory suggests trades go long when the price breaks above the setup's upper boundary. In a conservative approach, traders wait for the price to form at least several candles before entering the market. In a risky strategy, traders open a position as soon as the breakout occurs, and the breakout candlestick closes.
It's worth considering trading volumes as breakouts often turn into fakeouts, meaning the market returns to its previous trend. The chance of a strong breakout is higher if the volumes are high.However, increased volumes aren't the only tool used to confirm a breakout. Many traders consider trend indicators and oscillators to potentially limit the risks of bad trading decisions.
A standard take-profit target equals the size of the largest part of the setup and is measured just from the breakout trendline.
Traders consider several options when placing stop-loss levels. In a conservative approach, they implement the risk/reward ratio, which is usually 1:2 or 1:3 but depends on the trader's willingness to take risks. Also, traders utilise the upper trendline as a threshold and place the stop-loss order just under it.
Note: these are general rules. However, traders can develop their own trading strategies and adjust the pattern's parameters and rules according to their trading approach.
Ascending Triangle: Trading Example

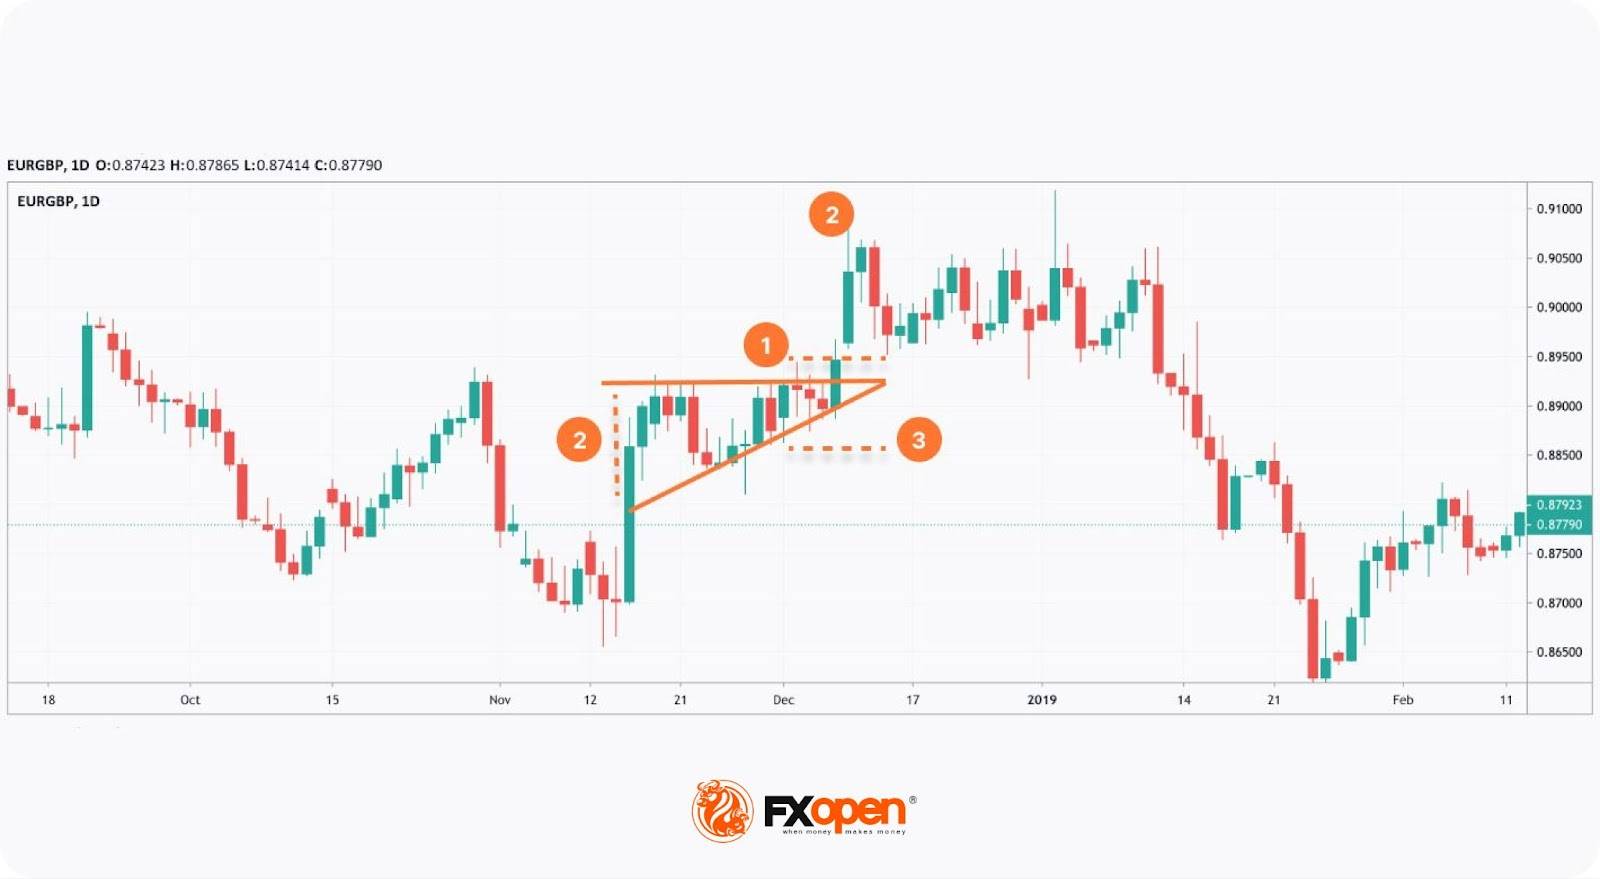
A bullish ascending triangle pattern formed on the daily chart of the EUR/GBP pair. The price skyrocketed, and as a result, the rising triangle formed, allowing bulls to take a break. As the trend wasn’t solid, a trader could go long as soon as the breakout candle closed (1). Otherwise, the trade would fail. A take-profit target would equal the size of the triangle’s widest part (2) and be measured just from the upper trendline. A stop-loss level of 1:2 or 1:3 risk/reward ratio would work (3).

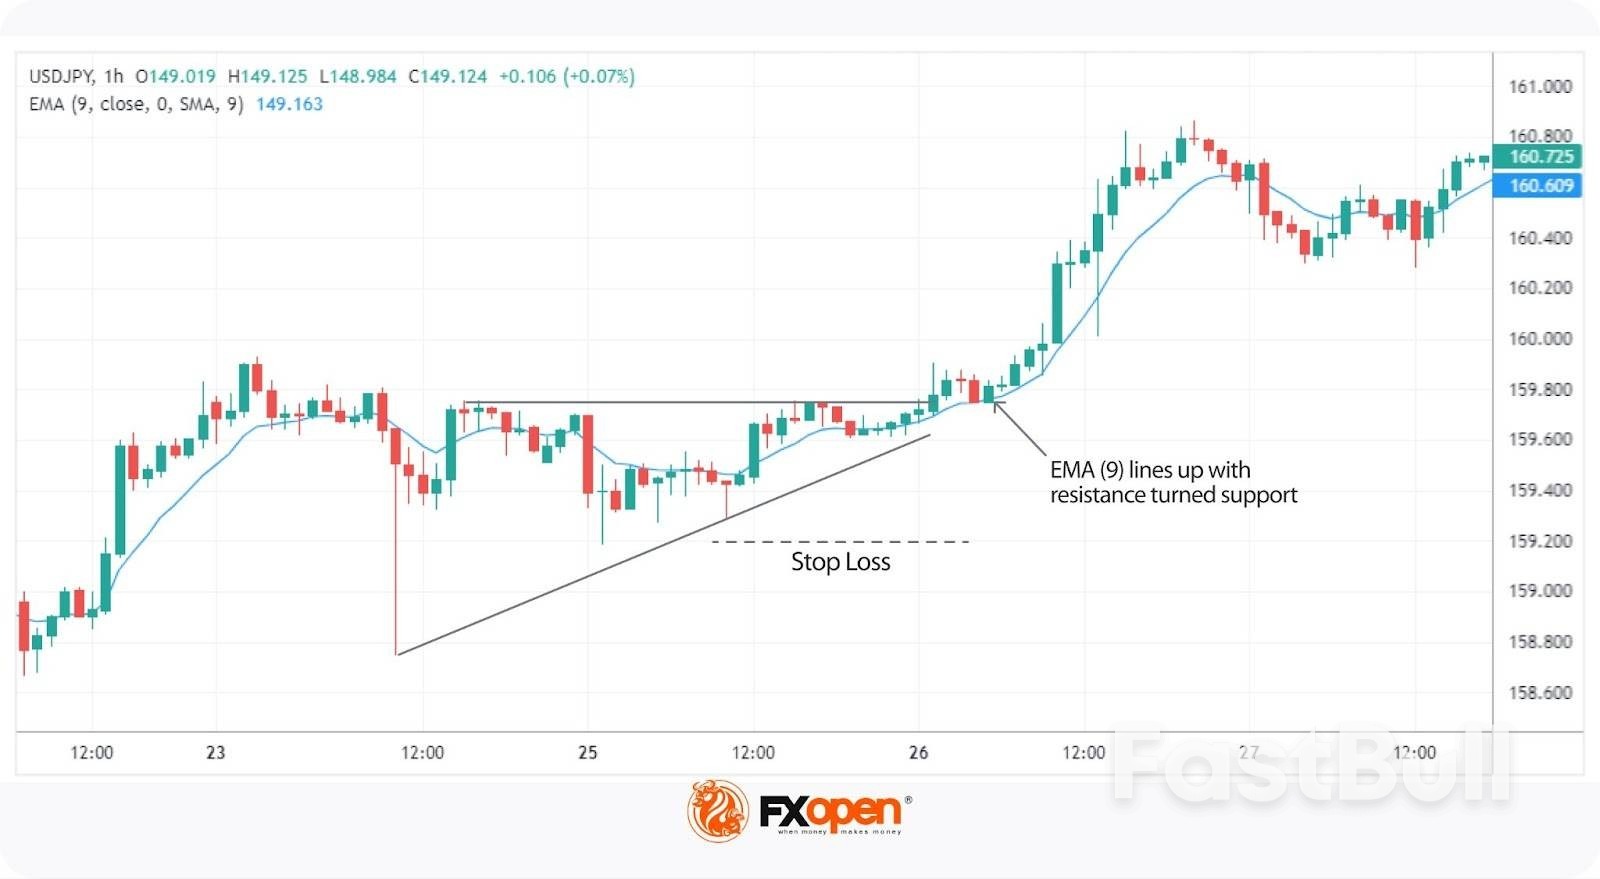
In this strategy, traders observe an existing bullish trend and the formation of an ascending triangle, which suggests the potential for a continuation pattern. Incorporating a short-term moving average, such as a 9-period EMA, provides dynamic support, aligning with the trendline to strengthen the setup.
Entries
Stop Loss
Take Profit
Rising Triangle: Benefits and Drawbacks
This formation has advantages and pitfalls that traders consider when developing their strategies.
Benefits
Drawbacks
The ascending triangle is one of the more common chart patterns traders use when trading various assets. Still, there is no 100% guarantee that it will work every time you spot it on a price chart. It's vital to remember that every signal must be confirmed with other indicators, chart patterns, and candlesticks. Also, it's a well-known fact that any trade involves risks that should be considered every time a trader enters the market. Improve your skills by practising on different assets and timeframes.
FAQ
How Do You Form an Ascending Triangle?
An ascending triangle is formed when the price action creates a series of higher lows while facing a resistance level, resulting in a horizontal upper trendline and a rising lower trendline. The price consolidates between these two lines before potentially breaking out above the resistance, signalling a bullish continuation.
Is an Ascending Triangle Bullish or Bearish?
The ascending triangle is a bullish pattern. It suggests that buyers are gaining strength as higher lows form, increasing the likelihood of a breakout above the resistance level. There is a descending triangle pattern that usually appears in a downtrend, signalling a downward movement.
How to Enter an Ascending Triangle?
According to the theory, in triangle pattern trading, it’s common to enter the market when the price breaks above the upper trendline of the triangle. In a conservative approach, traders wait for confirmation through several closing candles after the breakout. The increased volume also adds confidence to the trade.
What Is the Ascending Triangle Pattern Retest?
A retest occurs when the price breaks out of the triangle but then briefly falls back to test the former resistance level. A successful retest confirms the breakout and can provide an additional entry point.
How Long Does an Ascending Triangle Pattern Take to Form?
The formation of a bullish triangle pattern can vary based on the timeframe. On daily charts, it can take several days to weeks, while on shorter timeframes, it might form within hours.
What Is the Difference Between an Ascending Triangle and a Rising Wedge?
In comparing the ascending triangle vs. the rising wedge, it’s key to recognise that the rising wedge has converging trendlines, signalling a possible weakening trend, often leading to a bearish reversal. In contrast, an ascending triangle trading pattern typically signals a continuation of the uptrend.
EURUSD daily
EURUSD 4 hour
EURUSD 1 hourAccording to the latest market reports, traders are pricing in a quarter-point rate cut at the October 29 FOMC meeting with 90% probability according to CME’s FedWatch tool. This is a turn from recent rate-hike anxiety.
Prediction markets like Polymarket and Kalshi are also betting the Fed will cut from 4.00-4.25% to 3.75-4.00%. If they do, rate-sensitive assets like Bitcoin, tech stocks, and high-yield credit could breathe a sigh of relief.
CME’s FedWatch tool shows 90.8% chance that the Fed will lower rates by a 25 bps cut, with only 9.2% chance of no change. Other platforms show 91.9% implied probability. Some sources show slightly lower but still dominant odds around 89.8% for the cut.

These odds define how far the markets have leaned into this expectation. They’ve priced in a near-certainty for a 25 bps move, leaving little room for surprises.
Several factors are driving the consensus. First, fed futures markets have moved sharply and expectations for future rates have shifted towards easing.
Second, Fed officials have said they have room to ease. Chicago Fed’s Austan Goolsbee recently said the Fed has “room to cut rates,” in response to softening labor signals.
Third, many analysts and institutions now expect multiple cuts this year. Some updated their forecasts to expect cuts in both October and December.
Fourth, the Fed’s own dot plot and statements have hinted at room for further easing to support a soft landing.
According to market experts; if the Fed cuts rates by 25 bps, it would lower borrowing costs, ease pressure on credit-sensitive sectors and potentially re-ignite inflows into equities, growth sectors and crypto. Rate-sensitive markets react quickly, although it might not be uniform.
The forward guidance which refers to how the Fed signals the future path, could matter more than the cut itself. Markets are set to watch the post-meeting press conference and dot plot update for clues on more easing.
Conversely, a decision to hold rates would likely spook markets, increase volatility and force risk assets to adjust downward quickly. With odds at 90%, surprises would be amplified.
Despite the strong consensus, there are still risks. A hot economic print (e.g. CPI, PCE, jobs) before or after the meeting could change the math.

The Fed might sound dovish but hold back on action, preferring flexibility in the face of inflation uncertainty. Internal FOMC disagreement could lead to dissent or a more cautious cut. External shocks ike geopolitical, fiscal or credit events, could blow up policy confidence.
Powell has warned to be cautious; if inflation is sticky the Fed might not cut too fast.
Based on the latest research; Markets are fully pricing in a 25 bps Fed rate cut in October with 90% probability. This has big implications for equities, credit and crypto. But the Fed’s discretion is not gone.
A surprise twist from inflation prints, internal disagreement or cautious tone, could shock markets. Market participants are to be prepared for both the expected and the unexpected.
A Fed rate cut in October is highly likely but not guaranteed. Markets are fully on board with a quarter-point move. What matters next is how the Fed frames its path forward and whether data forces a rethink. Though consensus is clear, history shows central banks can still surprise.

Daily Light Crude Oil FuturesYen held firm as the strongest performer heading into the US session, supported by mounting speculation that the BoJ is moving closer to a rate hike. Traders seized on a hawkish shift from a known dove on the Policy Board, a sign that internal momentum is building for further normalization.
This shift in tone from the BoJ was partly balanced by a cautious note from the Japanese government. In its September monthly report, the Cabinet Office kept its basic economic assessment unchanged, describing the recovery as “moderate” while highlighting the drag from US trade policies, particularly in the automotive sector. Officials also warned that attention should remain on downside risks linked to external headwinds.
Still, the currency’s next major driver will be global risk sentiment. Heavyweight US releases this week — highlighted by Friday’s non-farm payrolls — will be decisive for both stocks, bonds and currencies. Any data surprise strong enough to sway Fed expectations will inevitably spill over into USD/JPY and broader Yen crosses.
In the upcoming Asian session, attention is shifting to the RBA’s policy decision. The RBA is expected to keep rates on hold at 3.60%, but the outcome carries added weight after August CPI accelerated to 3.0% from 2.8%. While consensus sees a year-end rate of 3.35%, a handful of analysts have delayed their calls for a November cut in light of the firmer inflation print.
Australia’s largest banks are split: ANZ, CBA, and Westpac forecast a 25bps reduction in November, while NAB expects no easing until May. A Reuters poll found more than 80% of respondents still see a cut to 3.35% by year-end, though the number expecting no change has risen since August.
For the day so far, Dollar is the weakest major currency, followed by Swiss Franc and Loonie. Yen sits at the top of the ladder, ahead of Sterling and Aussie, with the Kiwi and Euro trading in the middle of the pack.
In Europe, at the time of writing, FTSE is up 0.54%. DAX is up 0.02%. CAC is up 0.26%. UK 10-year yield is down -0.038 at 4.72. Germany 10-year yield is down -0.023 at 2.731. Earlier in Asia, Nikkei fell -0.69%. Hong Kong HSI rose 1.89%. China Shanghai SSE rose 0.90%. Singapore Strait Times rose 0.09%. Japan 10-year JGB yield fell -0.013 to 1.647.
Economic sentiment in the Eurozone improved slightly in September, with the Economic Sentiment Indicator rising 0.2 points to 95.5. The broader EU also gained 0.6 points to the same level. Despite the uptick, sentiment remains below the long-term average of 100.
The modest gains were driven by stronger confidence in industry, services, and among consumers, offset partly by weaker retail sentiment and stable conditions in construction.
By contrast, labor market expectations slipped, with the Employment Expectations Indicator dropping -0.9 points in the EU and -1.3 points in the euro area, suggesting hiring momentum is fading.
Country-level trends were uneven. Spain led with a notable 3-point jump, followed by Italy (+0.7), while sentiment weakened in the Netherlands (-0.7) and Germany (-0.4). France (+0.3) and Poland (+0.1) saw little change.
BoJ board member Asahi Noguchi, long seen as one of the most dovish voices on the Board, struck a notably hawkish tone today. He argued that Japan is making steady progress toward its 2% inflation goal, citing stronger wage momentum and greater corporate willingness to pass on rising costs.
Noguchi said the “need to adjust the policy interest rate is increasing more than ever,” highlighting that upside risks to prices and growth now outweigh the downside. He noted the labor market is “close to full employment” and the output gap has “almost reached zero”, warranting a shift in policy perspective to address rising inflation risks.
His comments mark a significant departure from his usual stance, adding to expectations that the BoJ could deliver another rate hike in the near future. Noguchi did caution that U.S. tariffs remain a source of downside risk, but the overall message suggests growing consensus within the Board for normalization.
Daily Pivots: (S1) 149.28; (P) 149.62; (R1) 149.83;
Intraday bias in USD/JPY stays neutral for the moment and some more consolidations could be seen below 149.95 temporary top. Further rally is expected as long as 147.45 support holds. Corrective pattern from 150.90 should have completed at 145.47. Above 149.95 will bring retest of 150.90 first. Firm break there will target 151.22 fibonacci level. However, sustained break of 147.45 will dampen this bullish view and bring deeper fall back to 145.47 support instead.
In the bigger picture, price actions from 161.94 (2024 high) are seen as a corrective pattern to rise from 102.58 (2021 low). Decisive break of 61.8% retracement of 158.86 to 139.87 at 151.22 will argue that it has already completed with three waves at 139.87. Larger up trend might then be ready to resume through 161.94 high. In case the corrective pattern extends with another fall, strong support is expected from 38.2% retracement of 102.58 to 161.94 at 139.26 to bring rebound.
Consensus-matching August PCE deflators (headline 0.3% M/M and 2.7% Y/Y from 2.6%, core 0.2% and 2.9%) halted a technical rebound both in US yields and of the dollar last Friday. Personal income (0.4% M/M) and spending (0.6%) remained solid. Even so, with markets looking forward to this week’s labour data, the PCE provided little reason to further price out Fed rate cuts this year and early next year. US yields changed one bp or less across the curve. US yields in the meantime have created some ‘breathing space’ vis-à-vis the technical levels that were tested around the time of the September 17 Fed meeting (2-y 3.64% vs 3.50% area, 10-y 4.15% vs 4% support area). German yields in technical trading slightly outperformed with yields easing up to 2.7 bps at the belly of the curve. Risk sentiment remained constructive, with little overall impact from the new sector tariffs the US announced on Thursday. The S&P 50 gained 0.59%. The Eurostoxx 50 even added 1%. The (yield-driven) USD rebound on Wednesday and Thursday ran into resistance. DXY failed to test 98.83 resistance and even made a small step back to close the week in the established ST trading range (close 98.15). USD/JPY approached the 150 barrier (close 149.49). EUR/USD finished the week near the 1.17 big figure (vs a week low of 1.1646 on Thursday).
Asian risk sentiment stays constructive this morning. Aside from key eco data, markets also keep a close eye at a meeting between president Trump and Congressional leaders as they seek to reach an agreement on a short-term spending bill (by October 01) to avoid a government shutdown. Regarding the data, first national EMU CPI data will be published today (Spain, Belgium) and tomorrow (France, Germany, Italy …) to be summarized into Wednesday’s EMU release (expected 0.1% M/M and 2.2% Y/Y for headline, 2.3% for core). The EMU data most likely won’t challenge a prolonged ECB status-quo. In the US, the focus evidently stays on labour market data (JOLTS , tomorrow), ADP on Wednesday, jobless claims on Thursday and the payrolls on Friday (if they are not delayed by a US government shutdown). The picture from the labour data will be complemented by the ISM’s (Wednesday manufacturing, Friday services) and by the conference board consumer confidence release. Data probably will have to be materially stronger than expected for markets to leave the idea of a follow-up Fed rate cut end next month. A halt in the US yields’ rebound and maybe some noise on a US government shutdown might also abort the most recent USD rebound. EUR/USD could return higher in the 1.1574/1.1919 range. In Japan, we keep an eye at the Tankan survey, as the BOJ MPC internally debates the timing of the next rate hike, potentially coming as soon as the October 30 meeting. The yen last week tested key support near USD/JPY 150, with EUR/JPY (currently 174.5) only a whisker away from the 175.43 2024 multi-year top. In the UK, the Labour Party Congress in Liverpool will highlight the difficult fiscal balancing act of Chancellor Reeves, with key EUR/GBP resistance at 0.8769 still within reach.
People familiar with the plans said that OPEC+ is likely to raise oil output again in November. The oil cartel is considering adding the same amount as they plan to do in October, i.e. 137k barrels a day. It’s technically restoring a layer of previous output curbs (of 1.66 million b/d) that was originally planned to remain in place through the end of this year. It has prompted warnings of a supply glut from the oil industry. So far, though, oil prices withstood the extra supply relatively well with OPEC+ delegates saying that the actual restored output is less than the amounts announced due to production constraints in some countries. Brent this morning holds steady around a two-month high just shy of $70. OPEC+ meets this Sunday.
Moldova’s pro-European ruling Party of Action and Solidarity secured 50% of the votes in yesterday’s ballot, putting president Maia Sandu on track for a second term in office. With the projected 54 seats in the 101-seat parliament, PAS doesn’t rely on support from other parties to form a government. The pro-Russian Patriotic Electoral Bloc won a little over 24% of the votes. Moldova, squeezed between Romania and Ukraine, has a population of just 2.4 mln but with an outsized geopolitical importance. The former Soviet state was granted EU candidate status, along with Ukraine, four months after the Russian invasion in 2022. Its goal is to join the EU by the end of the decade.
White Label
Data API
Web Plug-ins
Poster Maker
Affiliate Program
The risk of loss in trading financial instruments such as stocks, FX, commodities, futures, bonds, ETFs and crypto can be substantial. You may sustain a total loss of the funds that you deposit with your broker. Therefore, you should carefully consider whether such trading is suitable for you in light of your circumstances and financial resources.
No decision to invest should be made without thoroughly conducting due diligence by yourself or consulting with your financial advisors. Our web content might not suit you since we don't know your financial conditions and investment needs. Our financial information might have latency or contain inaccuracy, so you should be fully responsible for any of your trading and investment decisions. The company will not be responsible for your capital loss.
Without getting permission from the website, you are not allowed to copy the website's graphics, texts, or trademarks. Intellectual property rights in the content or data incorporated into this website belong to its providers and exchange merchants.
Not Logged In
Log in to access more features

FastBull Membership
Not yet
Purchase
Log In
Sign Up