• Trade
  • Markets
  • Copy
  • Contests
  • 24/7
  • Calendar
  • Q&A
  • Chats
Screeners
SYMBOL
LAST
BID
ASK
HIGH
LOW
NET CHG.
%CHG.
SPREAD
SOURCE
SPX
S&P 500 Index
7405.72
7405.72
7405.72
7466.81
7395.13
+21.99
+ 0.30%
--
--
DJI
Dow Jones Industrial Average
50786.00
50786.00
50786.00
51277.15
50732.35
-80.77
-0.16%
--
--
IXIC
NASDAQ Composite Index
25929.65
25929.65
25929.65
26179.65
25872.68
+220.23
+ 0.86%
--
--
USDX
US Dollar Index
99.840
99.840
99.920
100.010
99.780
-0.060
-0.06%
--
--
EURUSD
Euro / US Dollar
1.15456
1.15456
1.15463
1.15532
1.15268
+0.00140
+ 0.12%
--
--
GBPUSD
Pound Sterling / US Dollar
1.33652
1.33652
1.33661
1.33742
1.33307
+0.00273
+ 0.20%
--
--
XAUUSD
Gold / US Dollar
4336.44
4336.44
4336.85
4351.34
4312.80
+6.49
+ 0.15%
--
--
WTI
Light Sweet Crude Oil
88.358
88.358
88.388
89.917
88.216
-1.336
-1.49%
--
--

Community Accounts

Signal Accounts
--
Profit Accounts
--
Loss Accounts
--
View More

Become a signal provider

Sell trading signals to earn additional income

View More

Guide to Copy Trading

Get started with ease and confidence

View More

Signal Accounts for Members

All Signal Accounts

Best Return
  • Best Return
  • Best P/L
  • Best MDD
Past 1W
  • Past 1W
  • Past 1M
  • Past 1Y

All Contests

  • All
  • Recommend
  • Stocks
  • Cryptocurrencies
  • Central Banks
  • Trump Updates
  • Featured News
Top News Only
Share

Ministry Of Commerce: Supports Central Asian Countries In Expanding Their Exports Of Non-resource Commodities And Agricultural Products To China

Share

The Yield On Japan's 40-year Government Bonds Fell 4 Basis Points To 3.760%

Share

The Main Alumina Futures Contract Surged, Rising More Than 2.00% Intraday, And Is Currently Trading At 2,830 Yuan/ton

Share

Navigation Warning: Military Exercises In The Beibu Gulf

Share

The Main Paraxylene (PX) Contract Fell By More Than 2.00% During The Day, And Is Currently Trading At 8,654 Yuan/ton

Share

Germany's Seasonally Adjusted Industrial Production Rose 0.4% Month-on-month In April, The Largest Increase Since October 2025

Share

The Most Active PET Chip Futures Contract Fell More Than 2.00% Intraday, Currently Trading At 7578 Yuan/ton. The Most Active Ethylene Glycol Futures Contract Fell More Than 2.00% Intraday, Currently Trading At 4450.00 Yuan/ton

Share

Japanese Government Bond Yields Are Accelerating Lower

Share

Germany's Seasonally Adjusted Industrial Output Year-on-Year In April Was -0.5%, Compared With The Previous Reading Of -2.80%

Share

Germany's Seasonally Adjusted Trade Surplus In April Was €14.5 Billion, Compared With An Expected €15.3 Billion And A Prior Reading Revised Down To €14.1 Billion From €14.3 Billion

Share

Germany's Seasonally Adjusted Exports Rose By 0.9% Month-on-month In April, Versus An Expected Decline Of 0.5% And A Prior Reading Of 0.50%

Share

Germany's Seasonally Adjusted Imports Rose By 1.2% Month-over-month In April, Versus An Expected Decline Of 1.8%, With The Prior Month's Figure Revised Upward From 5.10% To 5.20%

Share

Saudi Arabia's Real GDP Grew By 3% Year-on-Year In The First Quarter

Share

The South Korean Won Rose 1% Against The US Dollar

Share

The Yield On Japan's 30-year Government Bonds Fell 3.5 Basis Points To 3.9%

Share

SC Crude Oil Futures Contract 2607 Weakened During The Session, With The Decline Widening To 3.07%, And Last Quoted At 578.4 Yuan/barrel; The Trading Volume Was Approximately 15.507 Billion Yuan, With A Decrease Of Nearly 3,300 Lots In Open Interest During The Day, And Open Interest Slightly Declining

Share

The Yield On Japan's 20-year Government Bonds Fell 3.0 Basis Points To 3.605%

Share

The Indonesian Rupiah Rose To 18,100 Against The US Dollar After The Indonesian Central Bank Raised Interest Rates By 25 Basis Points

Share

Central Bank Indonesia: The Interest Rate Hike Policy Aims To Improve Asset Yields, Thereby Attracting Foreign Investment Inflows

Share

Sources Say The Bank Of Japan Will Continue Its Current Pace Of Bond Purchases Into The Next Fiscal Year

TIME
ACT
FCST
PREV
IMPACT
U.S. Government Employment (May)

A:--

F: --

P: --

USDX
  • USDX
  • XAUUSD
  • XAGUSD
  • WTI
U.S. Manufacturing Employment (SA) (May)

A:--

F: --

P: --
USDX
  • USDX
  • XAUUSD
  • XAGUSD
  • WTI
U.S. Labor Force Participation Rate (SA) (May)

A:--

F: --

P: --

XAUUSD
  • XAUUSD
  • XAGUSD
  • WTI
  • USDX
U.S. Average Weekly Working Hours (SA) (May)

A:--

F: --

P: --

XAUUSD
  • XAUUSD
  • XAGUSD
  • WTI
  • USDX
U.S. Private Nonfarm Payrolls (SA) (May)

A:--

F: --

P: --
XAUUSD
  • XAUUSD
  • XAGUSD
  • WTI
  • USDX
Canada Ivey PMI (SA) (May)

A:--

F: --

P: --

USDCAD
  • USDCAD
  • XAUUSD
  • XAGUSD
  • WTI
  • USDX
Canada Ivey PMI (Not SA) (May)

A:--

F: --

P: --

USDCAD
  • USDCAD
  • XAUUSD
  • XAGUSD
  • WTI
  • USDX
U.S. Weekly Total Oil Rig Count

A:--

F: --

P: --

WTI
  • WTI
  • XAUUSD
  • XAGUSD
  • USDX
U.S. Weekly Total Rig Count

A:--

F: --

P: --

WTI
  • WTI
  • XAUUSD
  • XAGUSD
  • USDX
BOE Gov Bailey Speaks
U.S. Consumer Credit (SA) (Apr)

A:--

F: --

P: --
USDX
  • USDX
  • XAUUSD
  • XAGUSD
  • WTI
Richmond Federal Reserve President Barkin delivered a speech.
China, Mainland Foreign Exchange Reserves (May)

A:--

F: --

P: --

XAUUSD
  • XAUUSD
  • XAGUSD
  • WTI
  • USDX
Japan Trade Balance (Apr)

A:--

F: --

P: --

USDJPY
  • USDJPY
  • XAUUSD
  • XAGUSD
  • WTI
  • USDX
Japan Nominal GDP Revised QoQ (Q1)

A:--

F: --

P: --

USDJPY
  • USDJPY
  • XAUUSD
  • XAGUSD
  • WTI
Euro Zone Sentix Investor Confidence Index (Jun)

A:--

F: --

P: --

EURUSD
  • EURUSD
  • XAUUSD
  • XAGUSD
  • WTI
  • USDX
India Trade Balance (Q1)

A:--

F: --

P: --

XAUUSD
  • XAUUSD
  • XAGUSD
  • WTI
  • USDX
Canada National Economic Confidence Index

A:--

F: --

P: --

USDCAD
  • USDCAD
  • XAUUSD
  • XAGUSD
  • WTI
  • USDX
U.S. Conference Board Employment Trends Index (SA) (May)

A:--

F: --

P: --
USDX
  • USDX
  • XAUUSD
  • XAGUSD
  • WTI
U.K. BRC Overall Retail Sales YoY (May)

A:--

F: --

P: --

GBPUSD
  • GBPUSD
  • XAUUSD
  • XAGUSD
  • WTI
U.K. BRC Like-For-Like Retail Sales YoY (May)

A:--

F: --

P: --

GBPUSD
  • GBPUSD
  • XAUUSD
  • XAGUSD
  • WTI
China, Mainland Trade Balance (USD) (May)

A:--

F: --

P: --

XAUUSD
  • XAUUSD
  • XAGUSD
  • WTI
  • USDX
China, Mainland Trade Balance (CNH) (May)

A:--

F: --

P: --

XAUUSD
  • XAUUSD
  • XAGUSD
  • WTI
  • USDX
China, Mainland Exports (May)

A:--

F: --

P: --

XAUUSD
  • XAUUSD
  • XAGUSD
  • WTI
  • USDX
China, Mainland Imports (CNH) (May)

A:--

F: --

P: --

XAUUSD
  • XAUUSD
  • XAGUSD
  • WTI
  • USDX
China, Mainland Imports YoY (CNH) (May)

A:--

F: --

P: --

XAUUSD
  • XAUUSD
  • XAGUSD
  • WTI
  • USDX
China, Mainland Imports YoY (USD) (May)

A:--

F: --

P: --

XAUUSD
  • XAUUSD
  • XAGUSD
  • WTI
  • USDX
China, Mainland Exports YoY (USD) (May)

A:--

F: --

P: --

XAUUSD
  • XAUUSD
  • XAGUSD
  • WTI
  • USDX
Indonesia Lending Facility Rate (Jun)

A:--

F: --

P: --

XAUUSD
  • XAUUSD
  • XAGUSD
  • WTI
  • USDX
Indonesia Deposit Facility Rate (Jun)

A:--

F: --

P: --

XAUUSD
  • XAUUSD
  • XAGUSD
  • WTI
  • USDX
Germany Industrial Output MoM (SA) (Apr)

A:--

F: --

P: --
EURUSD
  • EURUSD
  • XAUUSD
  • XAGUSD
  • WTI
  • USDX
Germany Exports MoM (SA) (Apr)

A:--

F: --

P: --
EURUSD
  • EURUSD
  • XAUUSD
  • XAGUSD
  • WTI
  • USDX
South Africa GDP YoY (Q1)

--

F: --

P: --

U.S. NFIB Small Business Optimism Index (SA) (May)

--

F: --

P: --

Mexico CPI YoY (May)

--

F: --

P: --

U.S. Trade Balance (Apr)

--

F: --

P: --

Canada Trade Balance (SA) (Apr)

--

F: --

P: --

Canada Imports (SA) (Apr)

--

F: --

P: --

Canada Exports (SA) (Apr)

--

F: --

P: --

U.S. Exports (Apr)

--

F: --

P: --

U.S. Weekly Redbook Index YoY

--

F: --

P: --

U.S. Existing Home Sales Annualized Total (May)

--

F: --

P: --

U.S. Existing Home Sales Annualized MoM (May)

--

F: --

P: --

U.S. Wholesale Sales MoM (SA) (Apr)

--

F: --

P: --

China, Mainland M1 Money Supply YoY (May)

--

F: --

P: --

China, Mainland M2 Money Supply YoY (May)

--

F: --

P: --

China, Mainland M0 Money Supply YoY (May)

--

F: --

P: --

U.S. EIA Natural Gas Production Forecast For The Next Year (Jun)

--

F: --

P: --

U.S. EIA Short-Term Crude Production Forecast For The Year (Jun)

--

F: --

P: --

U.S. EIA Short-Term Crude Production Forecast For The Next Year (Jun)

--

F: --

P: --

EIA Monthly Short-Term Energy Outlook
U.S. 3-Year Note Auction Yield

--

F: --

P: --

U.S. API Weekly Crude Oil Stocks

--

F: --

P: --

U.S. API Weekly Refined Oil Stocks

--

F: --

P: --

U.S. API Weekly Gasoline Stocks

--

F: --

P: --

U.S. API Weekly Cushing Crude Oil Stocks

--

F: --

P: --

Japan Domestic Enterprise Commodity Price Index MoM (May)

--

F: --

P: --

Japan Domestic Enterprise Commodity Price Index YoY (May)

--

F: --

P: --

Japan PPI MoM (May)

--

F: --

P: --

Q&A with Experts
    • All
    • Chatrooms
    • Groups
    • Friends
    Size flag
    Keep your head up though, more opportunities will always come@Lonewolve
    Hafiz Dian flag
    for scalping, I think can buy 4333, I think it's okay there
    SlowBear ⛅ flag
    Lonewolve
    @Sizetoo bad for me Gu didn't take me in
    @LonewolveWell i will not suggest you call it a day on GU yet
    Sanjeev Ku flag
    use any dip towards 4316 to add more gold CMP 4338
    Size flag
    What are you focusing on next in the market?@Lonewolve
    SlowBear ⛅ flag
    Sanjeev Ku
    use any dip towards 4316 to add more gold CMP 4338
    @Sanjeev KuYes and i am in for now, slowly like we talked about
    Size flag
    Hafiz Dian
    for scalping, I think can buy 4333, I think it's okay there
    @Hafiz DianInteresting level mate....
    SlowBear ⛅ flag
    Sanjeev Ku
    use any dip towards 4316 to add more gold CMP 4338
    @Sanjeev KuIf we see annother retest of 4325 i will buy a small portion again
    Aftab Empire flag
    SlowBear ⛅
    @Aftab Empire Hello mate, how are you doing today?
    @SlowBear ⛅"Hello mate, I'm doing well, thanks. How are you?" یا
    Size flag
    Sanjeev Ku
    use any dip towards 4316 to add more gold CMP 4338
    I’m waiting for a retest around the 4330 level before considering an entry
    SlowBear ⛅ flag
    Aftab Empire
    @SlowBear ⛅"Hello mate, I'm doing well, thanks. How are you?" یا
    @Aftab Empire Hi bro, happy to hear you are doig well
    SlowBear ⛅ flag
    Aftab Empire
    @SlowBear ⛅"Hello mate, I'm doing well, thanks. How are you?" یا
    @Aftab Empire I am also doing very good, how is the market treating you today?
    Size flag
    Want to see how price reacts there first before making a move.@Sanjeev Ku
    Hafiz Dian flag
    Aftab Empire flag
    SlowBear ⛅
    @Aftab Empire Hi bro, happy to hear you are doig well
    @SlowBear ⛅"Thanks bro, I appreciate it. Hope you're doing well too."
    Size flag
    SlowBear ⛅ flag
    Aftab Empire
    @SlowBear ⛅"Thanks bro, I appreciate it. Hope you're doing well too."
    @Aftab Empire I really am bro,i really am
    Size flag
    Size
    That’s a strong move from the China-Korea Semiconductor ETF
    SlowBear ⛅ flag
    Hafiz Dian
    @Hafiz Dianvery well, the 1min timeframe of gold up to 5min screams buy somehow
    Aftab Empire flag
    SlowBear ⛅
    @Aftab Empire I am also doing very good, how is the market treating you today?
    @SlowBear ⛅"The market is good so far. I'm waiting for the best setup before taking a trade."
    Type here...
    Add Symbol or Code

      No matching data

      All
      Recommend
      Stocks
      Cryptocurrencies
      Central Banks
      Trump Updates
      Featured News
      • All
      • Russia-Ukraine Conflict
      • Middle East Flashpoint
      • All
      • Russia-Ukraine Conflict
      • Middle East Flashpoint

      Search
      Products

      Charts Free Forever

      Chats Q&A with Experts
      Screeners Economic Calendar Data Tools
      Membership Features
      Data Warehouse Market Trends Institutional Data Policy Rates Macro

      Market Trends

      Market Sentiment Order Book Forex Correlations

      Top Indicators

      Charts Free Forever
      Markets

      News

      24/7 Analysis Education

      Latest Views

      Latest Update

      Signals

      Copy Rankings Latest Signals Become a signal provider AI Rating
      Contests
      Brokers

      Overview Brokers Assessment Rankings Regulators News Claims
      Broker listing Forex Brokers Comparison Tool Live Spread Comparison Scam
      Q&A Complaint Scam Alert Videos Tips to Detect Scam
      More

      Business
      Events
      Careers About Us Advertising Help Center

      White Label

      Broker API

      Data API

      Web Plug-ins

      Affiliate Program

      Awards Institution Evaluation IB Seminar Salon Event Exhibition
      Vietnam Thailand Singapore Dubai
      Fans Party Investment Sharing Session
      FastBull Summit BrokersView Expo
      Recent Searches
        Top Searches
          Markets
          Analysis
          User
          24/7
          Economic Calendar
          Education
          Data
          • Names
          • Latest
          • Prev

          View All

          No data

          Scan to Download

          Faster Charts, Chat Faster!

          Download App
          English
          • English
          • Español
          • العربية
          • Bahasa Indonesia
          • Bahasa Melayu
          • Tiếng Việt
          • ภาษาไทย
          • Français
          • Italiano
          • Türkçe
          • Русский язык
          • 简中
          • 繁中
          Open Account
          Search
          Products
          Charts Free Forever
          Markets
          News
          Signals

          Copy Rankings Latest Signals Become a signal provider AI Rating
          Contests
          Brokers

          Overview Brokers Assessment Rankings Regulators News Claims
          Broker listing Forex Brokers Comparison Tool Live Spread Comparison Scam
          Q&A Complaint Scam Alert Videos Tips to Detect Scam
          More

          Business
          Events
          Careers About Us Advertising Help Center

          White Label

          Broker API

          Data API

          Web Plug-ins

          Affiliate Program

          Awards Institution Evaluation IB Seminar Salon Event Exhibition
          Vietnam Thailand Singapore Dubai
          Fans Party Investment Sharing Session
          FastBull Summit BrokersView Expo

          XAU/USD Extends Losses as Rising Yields Pressure Bullion

          Warren Takunda

          Traders' Opinions

          Summary:

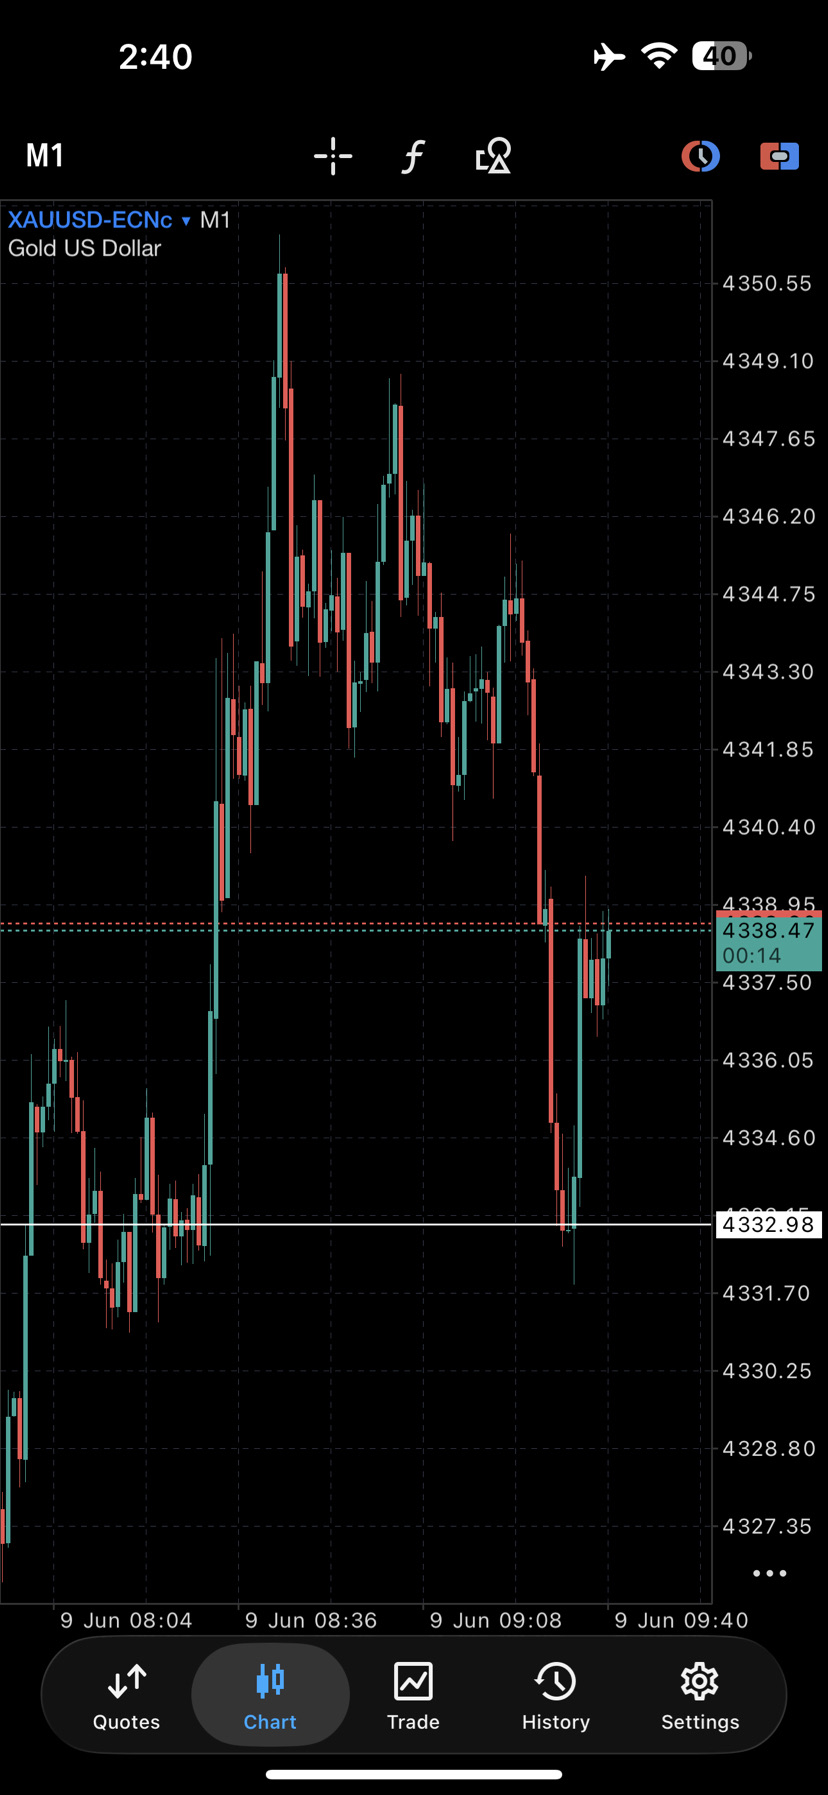
          Gold fell for a second straight session on Monday, dropping more than 4% over the past two trading days and hitting its lowest level in over two months. A stronger US Dollar, rising Treasury yields, and growing expectations of further Federal Reserve tightening outweighed geopolitical concerns in the Middle East.

          SELL XAUUSD
          EXP
          TRADING

          4320.00

          Entry Price

          4000.00

          TP

          4520.00

          SL

          4336.44 +6.49 +0.15%

          0.0

          Pips

          Flat

          4000.00

          TP

          Exit Price

          4320.00

          Entry Price

          4520.00

          SL

          Gold prices extended their decline on Monday, falling to $4,268 and marking their lowest level in more than two months as investors continued to favor the US Dollar amid rising Treasury yields and increasing expectations of further Federal Reserve tightening.
          The precious metal has lost more than 4% over the last two trading sessions, despite renewed geopolitical tensions following missile exchanges between Israel and Iran. While such developments would typically support safe-haven demand for gold, investors have instead flocked to the Dollar, which has emerged as the preferred defensive asset.
          Market sentiment remains fragile as concerns grow that the conflict could escalate further, threatening regional stability and energy markets. However, the impact of geopolitical uncertainty has been overshadowed by a stronger US economic outlook and shifting monetary policy expectations.
          Friday's stronger-than-expected Nonfarm Payrolls report, combined with robust manufacturing and services activity data released earlier in the week, reinforced confidence in the resilience of the US economy. As a result, investors have increased bets that the Federal Reserve could maintain a hawkish stance for longer, pushing Treasury yields higher and boosting the Dollar.
          Higher yields continue to weigh on non-interest-bearing assets such as gold, while a stronger Dollar reduces the appeal of bullion for international buyers. Traders are now closely watching Wednesday's US Consumer Price Index report for further clues on the inflation outlook and the Fed's policy path.
          In my view, gold remains vulnerable in the near term as rising yields and Dollar strength continue to dominate market sentiment. Unless inflation data significantly weaken expectations for tighter monetary policy, bullion could remain under pressure despite ongoing geopolitical risks.

          Technical AnalysisXAU/USD Extends Losses as Rising Yields Pressure Bullion_1

          From a technical perspective, Gold continues to trade within a well-established bearish framework on the 4-hour chart, with recent price action reinforcing downside momentum rather than challenging it. The breakdown below the $4,480 region marked the first major shift in short-term structure, followed by a second wave of selling that carried price through the $4,360 zone, an area that had repeatedly acted as a stabilising base in prior sessions.
          The failure to hold these levels has left the market in a vulnerable position, with the broader trend still defined by a sequence of declining peaks and weakening rebound attempts. While price is attempting to stabilise near the $4,280–$4,300 region, the recovery so far lacks conviction and appears more corrective than directional.
          Any bounce from current levels is expected to encounter friction around $4,360, a zone that has now flipped from support into supply. Beyond that, the $4,480 area aligns with a heavier technical ceiling where prior breakdowns originated, making it a key reference point for any broader recovery attempt. Unless buyers can reclaim this upper band with follow-through, upside moves are likely to stall.
          On the downside, the market remains exposed to a retest of the $4,260 area, which now stands as the immediate inflection point. A clear break beneath this level would reinforce the existing bearish cycle and open the way toward $4,120, a deeper structural support region. Below that, the $4,000 handle comes into view as a longer-term downside marker if momentum accelerates further.
          Overall, the chart continues to favour sellers as long as price holds beneath the $4,360–$4,480 resistance band. The recent pullback has not altered the dominant trend, and rallies are still being absorbed rather than extended, suggesting that distribution conditions remain in play rather than accumulation.

          TRADE RECOMMENDATION

          SELL GOLD
          ENTRY PRICE: 4,320.00
          STOP LOSS: 4,410.00
          TAKE PROFIT: 4,000.00
          Risk Warnings and Disclaimers
          You understand and acknowledge that there is a high degree of risk involved in trading. Following any strategies or investment methods may lead to potential losses. The content on the site is provided by our contributors and analysts for information purposes only. You are solely responsible for determining whether any trading assets, securities, strategy, or any other product is suitable for investing based on your own investment objectives and financial situation.
          Add to Favorites
          Share
          FastBull
          Copyright © 2026 FastBull Ltd

          728 RM B 7/F GEE LOK IND BLDG NO 34 HUNG TO RD KWUN TONG KLN HONG KONG

          TelegramInstagramTwitterfacebooklinkedin
          App Store Google Play Google Play
          Products
          Charts

          Chats

          Q&A with Experts
          Screeners
          Economic Calendar
          Data
          Tools
          Membership
          Features
          Function
          Markets
          Copy Trading
          Latest Signals
          Contests
          24/7
          Analysis
          Education
          Company
          Careers
          About Us
          Contact Us
          Advertising
          Help Center
          Feedback
          User Agreement
          Privacy Policy
          Personal Information Protection Statement
          Business

          White Label

          Broker API

          Data API

          Web Plug-ins

          Poster Maker

          Affiliate Program

          Risk Disclosure

          The risk of loss in trading financial instruments such as stocks, FX, commodities, futures, bonds, ETFs and crypto can be substantial. You may sustain a total loss of the funds that you deposit with your broker. Therefore, you should carefully consider whether such trading is suitable for you in light of your circumstances and financial resources.

          No decision to invest should be made without thoroughly conducting due diligence by yourself or consulting with your financial advisors. Our web content might not suit you since we don't know your financial conditions and investment needs. Our financial information might have latency or contain inaccuracy, so you should be fully responsible for any of your trading and investment decisions. The company will not be responsible for your capital loss.

          Without getting permission from the website, you are not allowed to copy the website's graphics, texts, or trademarks. Intellectual property rights in the content or data incorporated into this website belong to its providers and exchange merchants.

          Not Logged In

          Log in to access more features

          Connect Broker
          Become a signal provider
          Help Center
          Customer Service
          Dark Mode
          Price Up/Down Colors

          Log In

          Sign Up

          Position
          Layout
          Fullscreen
          Default to Chart
          The chart page opens by default when you visit fastbull.com